Design a scheduled email report
Configuration → Email Template → Custom Email Template v2 lets you assemble a recurring security email — its figures, its tables, its charts, its spreadsheet attachment, its recipients and its schedule — without anyone writing a template for you. One definition can also fan out into many emails, one per owner, each carrying only that owner's findings.
This is the deepest configuration surface in the platform, so it is worth reading before you build rather than after.
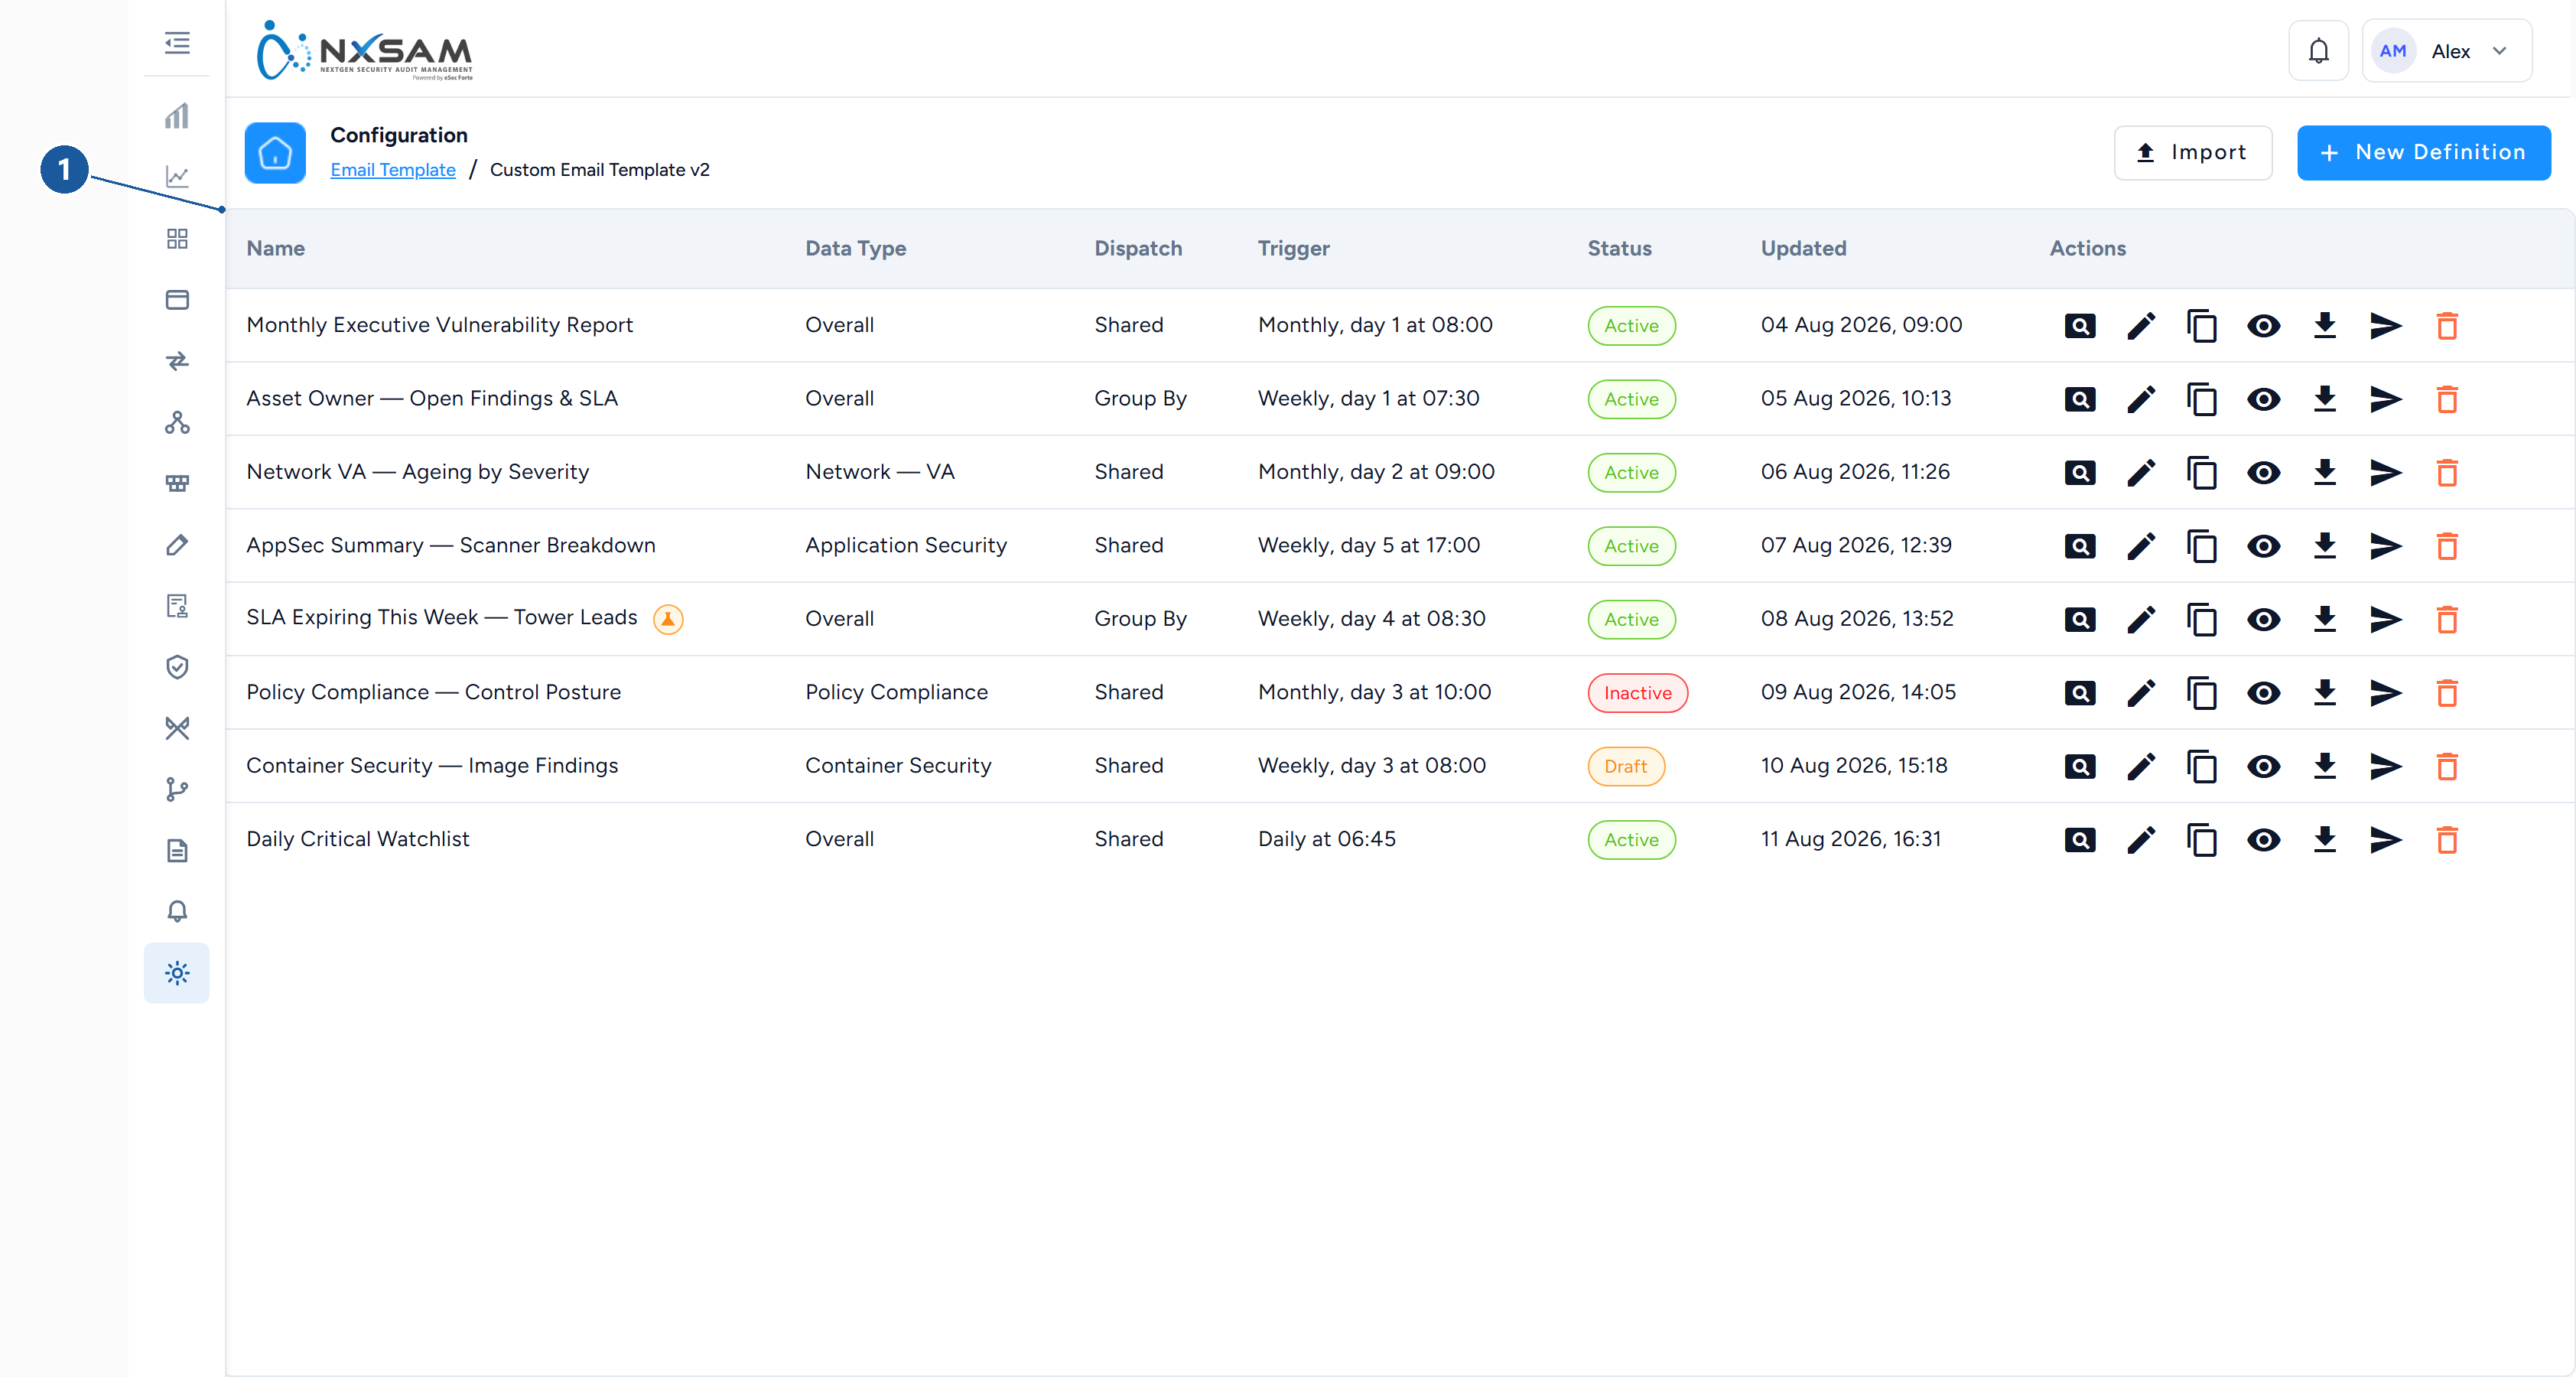
1 Dispatch mode, send cadence and status
The list, and what you can do from it
Each definition shows its Name, Data Type, Dispatch, Trigger, Status and when it was last Updated. A template running in test mode is flagged on its name.
New Definition starts an empty one; Import loads a definition exported elsewhere.
| Action | What it does |
|---|---|
| View | Opens every tab read-only. A banner says so, and Preview still works |
| Edit | Opens the same screen for changes |
| Clone | Copies the whole definition. The usual way to start — begin from something that already works |
| Preview email | Renders the email against live data, without sending |
| Export | Downloads the definition as a file |
| Import | Loads a definition exported from another instance |
| Send Now | Sends immediately, off-schedule |
| Delete | Removes it |
Each is separately permissioned, so a colleague can be allowed to preview and send without being allowed to edit or delete.
Status is Draft, Active or Inactive. Only Active definitions are picked up by
the schedule — a finished template left on Draft is the usual reason a report never
arrives.
Import and Export are how a report travels between environments
Build and prove a definition on a test instance, export it, import it into production. The file carries the whole definition, including any advanced settings the screen does not display.
Before you start: two decisions that shape everything else
One email, or one per owner?
Dispatch mode is the first choice and the one hardest to change later.
- Shared — a single email to a fixed audience. An executive summary, a weekly digest.
- Group by — one email per distinct value of a chosen field, each containing only that group's findings. Choose the field in Group By Field: any standard dimension, or any asset property you have defined. Pick the property that carries ownership, and each owner receives their own report with nobody else's findings in it.
Group-by is what turns one definition into a hundred personalised emails. It also changes what the recipient options mean, which is covered under Recipients.
Which findings are in scope?
Data Type groups the template in the list; Client scope restricts every data source to the chosen clients. Both are set on the first tab.
Tab 1 — Scope & Data
The name, subject and scope, and then the data sources — the figures everything else draws from.
The subject line
Type it freely and use Insert variable for values resolved at send time:
| Variable | Resolves to |
|---|---|
| Group value | The group this email is for — the owner's name, on a group-by template |
| Client name | The client the report belongs to |
| Today's date | The date the email is generated |
| Month & year | For example June 2026 — the natural choice for a monthly report title |
| Month | The month name alone |
A subject of Monthly Vulnerability Report — Group value — Month & year produces Monthly Vulnerability Report — Payments Platform — June 2026 for one recipient and the same line with their own group for the next.
Data sources
A data source is one query. Every table, chart and card in the email names a source, so build these first. Give each a short Key — you will pick it by that name later.
Each source has three parts: where it reads from, how it shapes the result, and what it excludes.
Source is the population: Open Issues, VA Closed or PC Closed.
Mode decides the shape, and which fields appear below it:
| Mode | Shape | Feeds |
|---|---|---|
| Aggregate | One metric, grouped by one dimension | Summary tables, summary cards, bar charts, chart images |
| Metrics | Several metrics as columns, grouped by one dimension | Metrics tables |
| Matrix | One metric across two dimensions, optionally grouped by a third | Matrix tables, grouped matrix tables, charts |
| Nested | Parent group → member rows → value columns | Nested tables |
| List | Raw finding rows with the columns you choose | Data tables, and the attachment |
| Trend | A metric over months | Line charts |
Metrics available to aggregate, metrics and matrix modes:
| Metric | Notes |
|---|---|
| Issue Count | The default |
| Affected Assets | Distinct assets rather than findings |
| Avg Vuln Score, Total Vuln Score | Weighted views |
| Overdue Count, Overdue % | Past the SLA date |
| No-SLA Count | Findings with no SLA date at all |
| Within-SLA Count | Still inside the SLA |
| Exception Count, No-Exception Count | Risk-accepted and not |
| SLA Breached (exclusive), Within SLA (exclusive), Exception (exclusive), Exception Under Approval (exclusive) | Mutually exclusive states — see the note below |
| MTTR (Days) | Mean time to remediate. Closed sources only |
The 'exclusive' metrics exist so a table can total correctly
The plain metrics overlap: a risk-accepted finding can also be past its SLA date, so it appears under both Exception Count and Overdue Count, and a table built from them sums to more than the real total. The exclusive family assigns each finding to exactly one state, so the columns add up. Use the exclusive set whenever a table shows a total; use the plain set when you want each question answered on its own.
Dimensions are the fields to group by: Severity, Module, Asset Type, Vuln Status, Age Band, Age (Days), Age Since Overdue (Days), SLA Status, SLA Status (exclusive), SLA, Tool, Audit Category, Application, Application Name (Linked), App Sub Type (Linked), Assessment Group and Module Bucket — plus every asset property you have defined.
Every source carries its own filters, and they are the difference between a report that answers a question and one that dumps everything:
- Severities and Modules — restrict the population
- Tool — restrict to particular scanners
- Dimension Filters — any dimension or asset property, Include or Exclude, with real values offered from your data rather than typed from memory. This is how a source becomes "servers only" or "everything except the sandbox environment"
- Sort — high to low, or low to high
- Row limit — list mode only
SLA window appears on Open sources and restricts by SLA date: already overdue, expiring today, or expiring soon, where you set how many days ahead counts as soon. Those three windows are exactly the classic SLA-warning emails, now built rather than coded.
Age buckets appear whenever the source groups by age. Enter ascending day counts —
30, 90, 180, 365 produces 0–30, 31–90, 91–180, 181–365 and 365+. Leave it blank for the
standard bands. Matrix sources can also render those labels compactly, which matters when
a table has five age columns and a narrow email body.
Tab 2 — Body
The email body is an ordered list of blocks. Add Block, choose a type, set its width, and move it with the arrows in its header. Widths run from full to two-thirds, half, a third and a quarter, so two half-width blocks sit side by side.
A block reads from a data source, and the source list only offers sources it can actually render — a matrix table will not offer you a list source. If a block's source dropdown is empty, the data source it needs has not been built yet.
| Block | Reads from | What it produces |
|---|---|---|
| Text | — | Free rich text, with the same variables as the subject plus a running total per data source |
| Summary cards | Aggregate | The headline figures as cards |
| Summary table | Aggregate | The simple one-dimension table |
| Metrics table | Metrics | A dimension down the side, several metrics across |
| Matrix table | Matrix | Two dimensions crossed, with totals |
| Grouped matrix table | Matrix with a group dimension | Three dimensions: an outer status grouping, ageing rows and severity columns |
| Nested table | Nested | Parent rows with member sub-rows |
| Data table | List | Actual findings, with the columns and headings you choose |
| Bar chart | Aggregate or matrix | Bars drawn in the email itself — crisp at any zoom, and visible even where images are blocked |
| Chart image | Aggregate, matrix or trend | A rendered chart: column, grouped, line, pie or donut |
| Section repeat | Aggregate or metrics | Repeats a set of blocks once per value of a field |
| Link | — | A labelled link |
Controls worth knowing
Every table lets you rename its headings. First column label, total label, and on data and metrics tables a custom heading per column. An email that says Application where your organisation says Service is one field away from matching how people speak.
Row and column order are yours: type the values in the order you want them, comma separated. Severity columns in Critical, High, Medium, Low, Info rather than alphabetical is a comma-separated list, not a support request.
Zero handling — show zero values or leave the cell blank, and hide rows that are all-zero. A monthly report whose table is nine-tenths empty usually needs one toggle.
Conditional formatting on metrics and nested tables colours a cell when it crosses a threshold — Overdue % at or above 50 → red. Choose the metric, the comparison (including between), the value and the colour. This is what makes a table scannable rather than merely accurate.
Box height appears on charts and data tables. Set the same value on two side-by-side blocks and their boxes align, which is the difference between a tidy email and a ragged one.
Chart options vary by type: value labels and legend on all of them; curve and point markers and a zero-based axis on lines; stacking on grouped columns; count, percentage or one-decimal formatting on pie and donut; sort order and a top-N cut on bars; and a series order you can type when the default order is not the one you mean.
Data tables are a preview, not the full list
A data table's Max Rows caps it at the most severe findings — up to a hundred. The complete list belongs in the attachment. An email carrying thousands of rows inline is one many mail clients will truncate or refuse.
Tab 3 — Attachment
Turn the attachment on and choose XLSX or CSV. Then choose a mode:
- Flat — one row per finding. Pick the columns and give each its own heading.
- Grouped — grouped by a dimension or column, with a severity count per group. Choose which severities become columns.
- Grouped multi — a parent and a member dimension, with severity columns, split across sheets you define. Each sheet bundles a set of tools onto its own tab — one for SAST, one for DAST, one for dependency findings.
The attachment reads a list source, and the columns available include the full finding detail — title, asset, host, port, protocol, CVE, scanner and its identifier, status, first reported, SLA expiry, risk acceptance and its comment, audit, project, client, app code, public-facing flag, duration, plus description, synopsis, diagnosis, impact and solution, and every asset property you have defined.
The builder warns when the attachment cannot reconcile with the email
If the attachment's source is filtered differently from the sources feeding the body — a different tool or module set — a warning appears on this tab. Ignore it and you will ship an email whose table says one number and whose spreadsheet says another, which costs more trust than the report earns. Align the filters.
Tab 4 — Recipients & Dispatch
Recipients are resolved at send time rather than listed, which is what keeps a group-by report correct as ownership changes.
| Resolver | Resolves to |
|---|---|
| Asset owner | The owner named on the asset. Choose which property carries ownership |
| Group owner | The group's owner — a tower lead, for instance |
| Asset access | Everyone with access to this group's assets. Super-admins are excluded unless you switch them in |
| Static emails | Addresses you type, comma or newline separated |
Build To and CC independently, and mix resolvers freely — the owner in To, a static distribution list in CC.
Test mode
Test mode redirects every email to addresses you name. Each message is still generated with its real per-group data and its real resolved recipients, shown in a banner at the top, but delivery goes only to the test addresses.
This is how you validate a group-by report that would otherwise reach a hundred people: turn it on, send, read what each owner would have received, then turn it off.
Test mode with no recipients sends nothing
That is deliberate. A blank list fails safe rather than falling back to the real audience.
Tab 5 — Schedule and branding
Frequency is daily, weekly or monthly. Weekly and monthly ask for a day; all three ask for a time. A monthly report set for day 31 will not fire in a short month — pick 28 or earlier for a report that must arrive every month.
Branding & style applies to the whole email:
- Brand name in the header
- Theme preset — eSec Maroon, Corporate Navy, Slate Professional, Teal & Amber, Indigo & Rose, or Graphite for printing and colourblind readers. A preset fills every colour below in one click and you can then adjust any of them
- Frame colours — primary, primary dark, panel header and border
- Chart series colours — the first three series
- Shell width in pixels, between 480 and 1200
Severity colours stay fixed. Red for the most severe is a convention people read without thinking, and re-colouring it costs more comprehension than any palette gains.
Preview before you save, and again before you activate
Preview renders the email against live data at any point, including on a draft you have not saved. On a group-by template it renders one group, so you see a real recipient's email rather than an abstraction.
The sequence that avoids embarrassment:
- Build it and Preview until the figures look right.
- Turn on Test mode, set it Active, and Send Now. Read the real thing.
- Check the attachment reconciles with the body.
- Turn test mode off and leave it Active on its schedule.
A template can carry settings this screen does not show
If a definition was authored elsewhere and uses options beyond the builder, a banner lists them by name. Those settings are preserved when you save — the screen will not quietly drop them — but changing them means exporting the definition, editing the file and importing it back.
When a report does not arrive
In order of likelihood:
- Status is Draft or Inactive. Only Active definitions are scheduled.
- Test mode is still on, so it went to the test addresses. The list flags this on the template's name.
- The schedule has not come round yet — a daily template sends at its time, not when you finish editing. Use Send Now to confirm the template works.
- No recipient resolved. A group with no owner set produces no address. Preview shows the resolved recipients per group.
- The email was sent but not delivered — check the email log, which records what was queued, to whom, and whether it failed.