System & Health
These screens are for keeping NxSAM itself healthy. They are administrative rather than security-facing, and most organisations look at them only when investigating a problem.
Health Check
Health Check compares what NxSAM holds against what it should hold — reconciling imported data against its source, and flagging discrepancies.
It answers the question that matters most about any consolidation platform: are we confident nothing was lost on the way in? If a scan reported 1,200 findings and NxSAM shows 1,150, health check is where that gap surfaces rather than going unnoticed.
Worth running after any large import, and after changing how findings are matched or classified.
Server Status and Process Manager
Server Status shows whether the platform's components are running. Process Manager shows background work — imports, report generation, synchronisation.
Most long-running work in NxSAM happens in the background: a report is queued rather than produced instantly, and a large import is processed over time. When something "hasn't happened yet", these screens show whether it is queued, running, or failed.
Queued is not failed
A report or import that has not appeared may simply be waiting behind other work. Check whether it is queued before treating it as an error.
Warehouse Sync
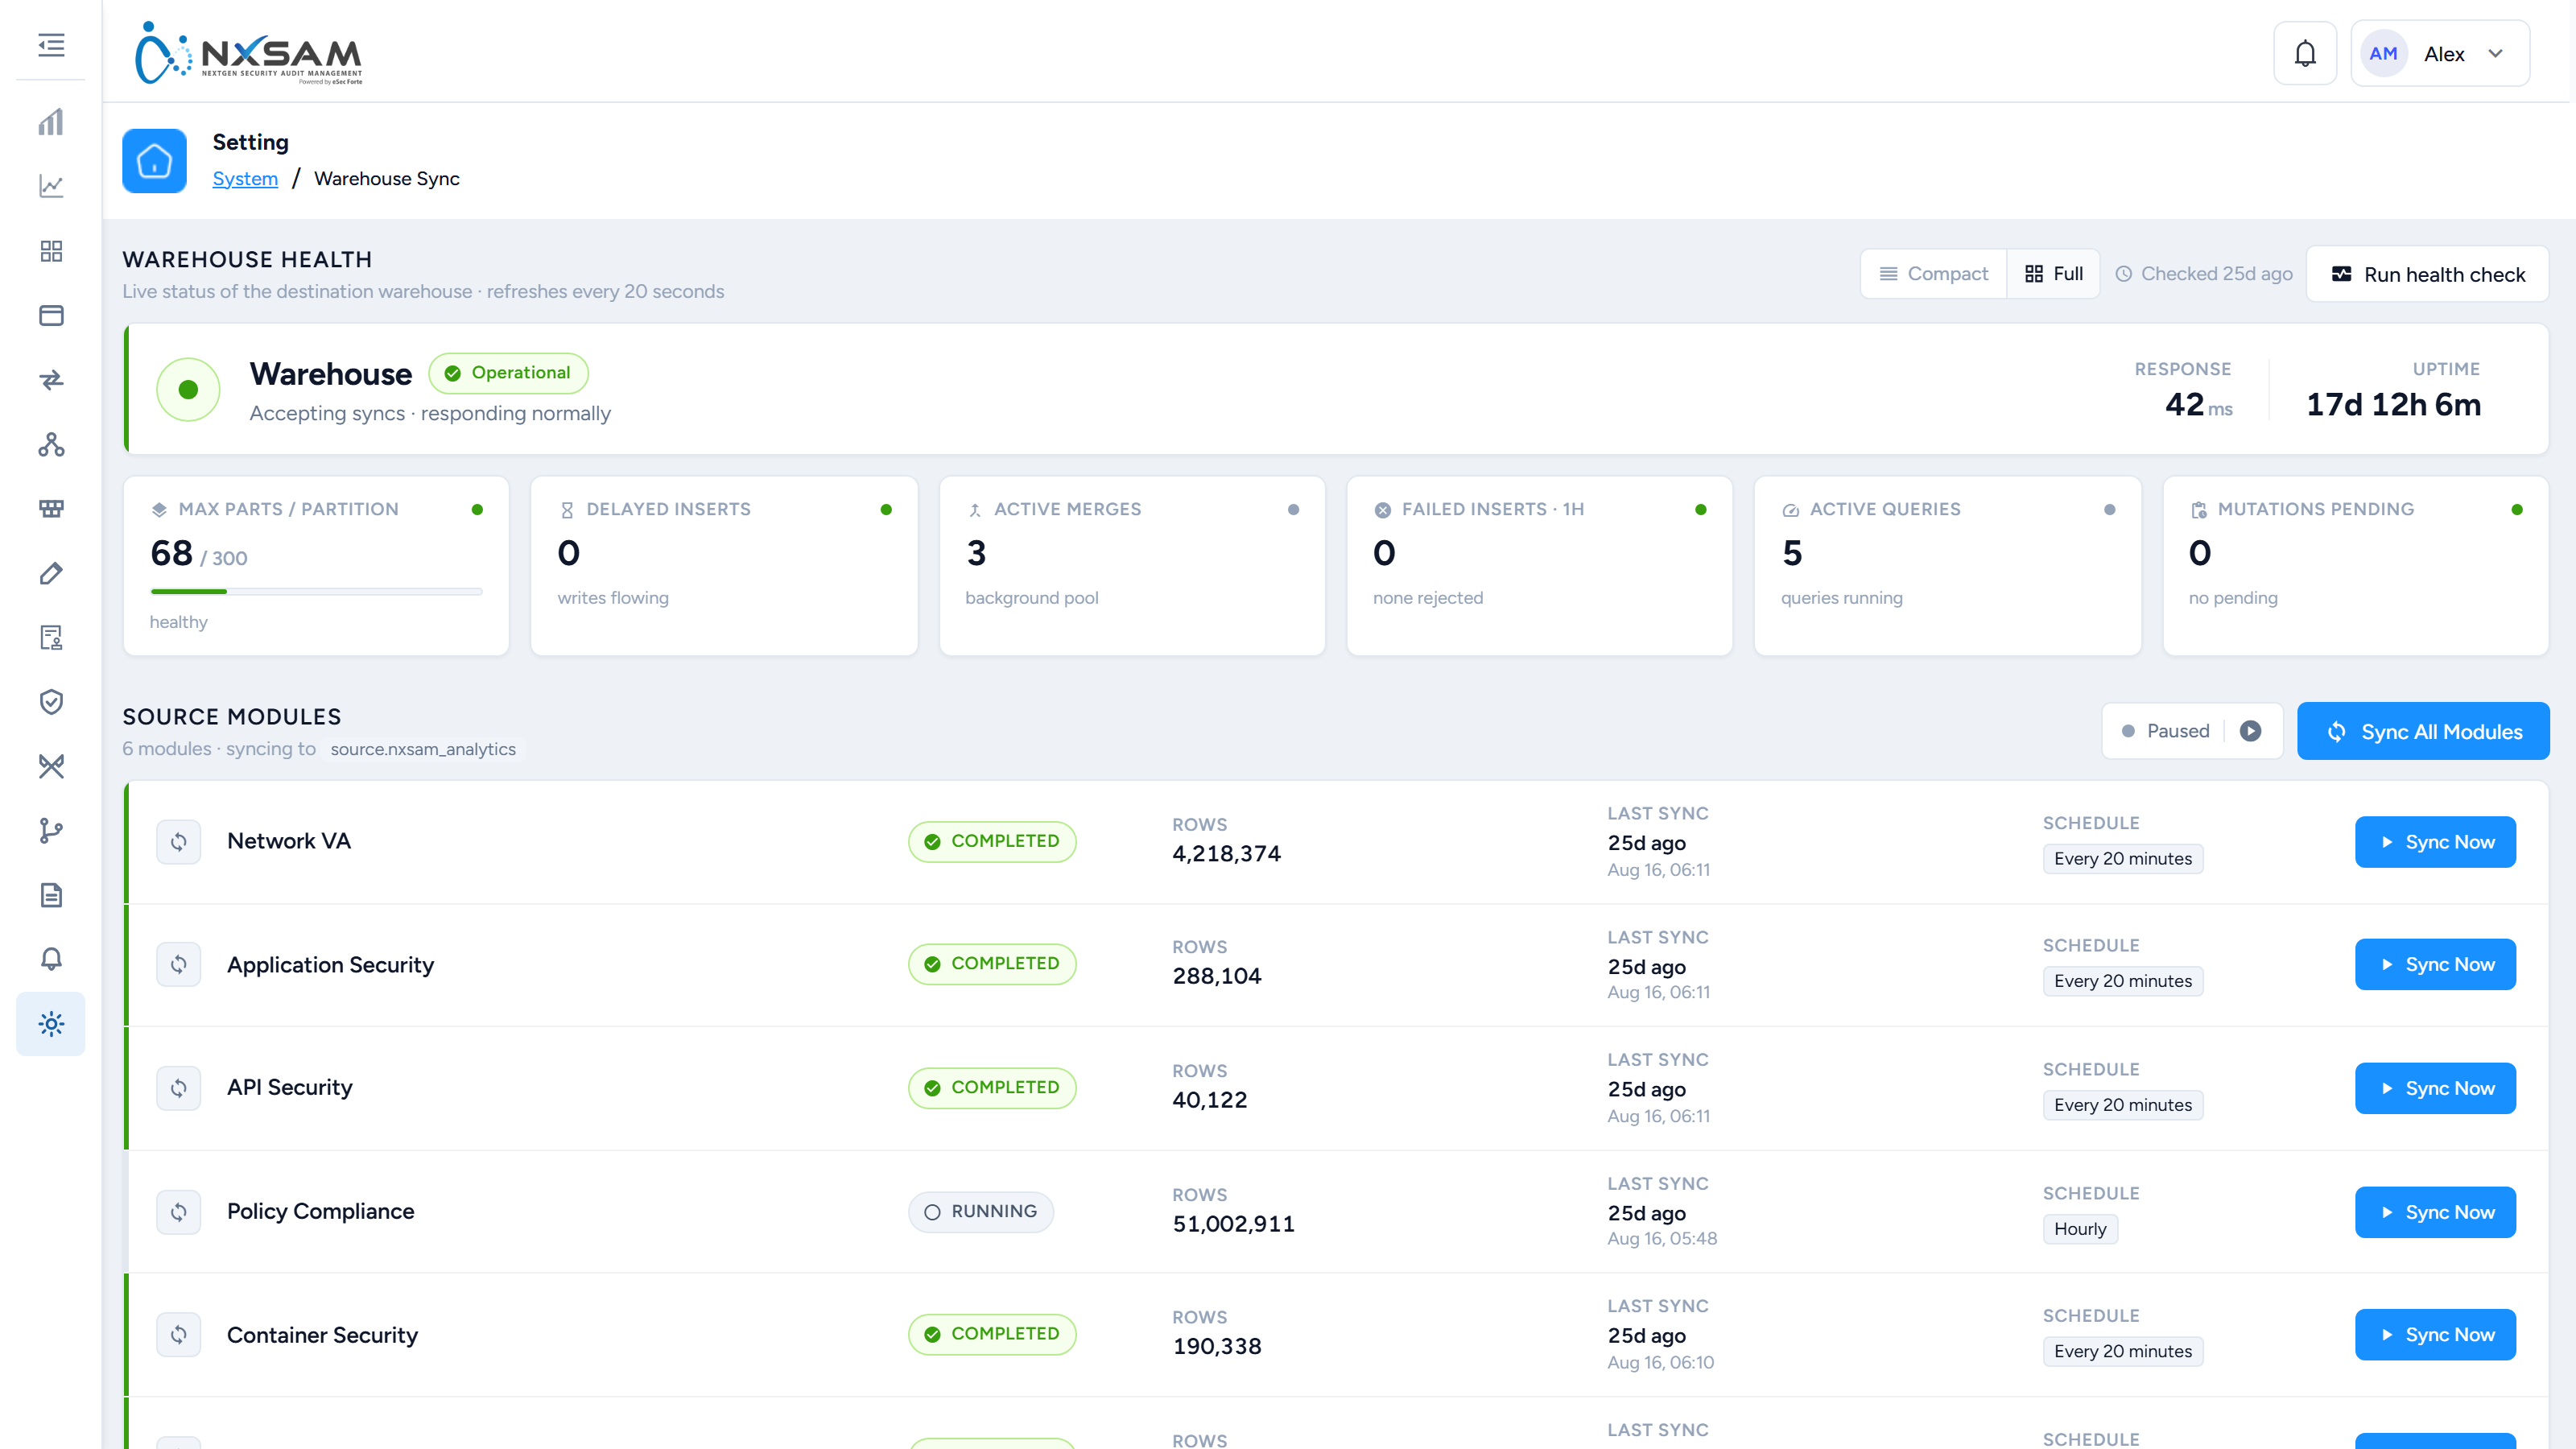
Where analytics are served from a separate reporting store, this screen shows the synchronisation between the live database and that store.
This is the usual explanation for analytics figures lagging the module screens: the module reads live data, analytics reads the synchronised copy. A gap between them is a sync timing question, not a data integrity one.
Licence
Shows your licence and its limits. Worth checking before a large onboarding — asset limits are enforced, and discovering the ceiling midway through a bulk import is avoidable.
AI configuration
Where an administrator connects the platform's AI service and decides what it may be used for. Today that is one thing: reading the evidence uploaded against a compliance or third-party control and suggesting a finding to the auditor, with a confidence score.
The screen holds the provider and credential, the model, how often analysis runs, a spending cap per audit, and which modules it is switched on for. A second screen, AI Queue Details, lists the analysis runs and lets one be re-run.
Two points worth knowing before switching it on:
- Nothing is written by it. The auditor still answers every control. The evaluation appears beside the evidence as a suggestion and is not counted anywhere.
- The cap is a hard stop. Analysis pauses for an audit once its spend reaches the cap, and the remaining controls stay pending until the cap is raised. A cap set low to be safe therefore looks, from the assessment, like analysis that never finishes.
When to look here
| Symptom | Screen |
|---|---|
| An import seems incomplete | Health Check |
| A report never arrived | Process Manager |
| Analytics disagree with a module | Warehouse Sync |
| Something is broadly not working | Server Status |
| Cannot add more assets | Licence |