Work with Live Data
Live Data is the row-level list behind every dashboard widget — one line per finding, across every module at once. Clicking through from a chart lands you here with that chart's slice already applied.
Like the dashboard, almost none of it is fixed: you choose the columns and their order, build filters the product does not ship, save the arrangement onto a profile, and export exactly the columns you need under headings you choose.
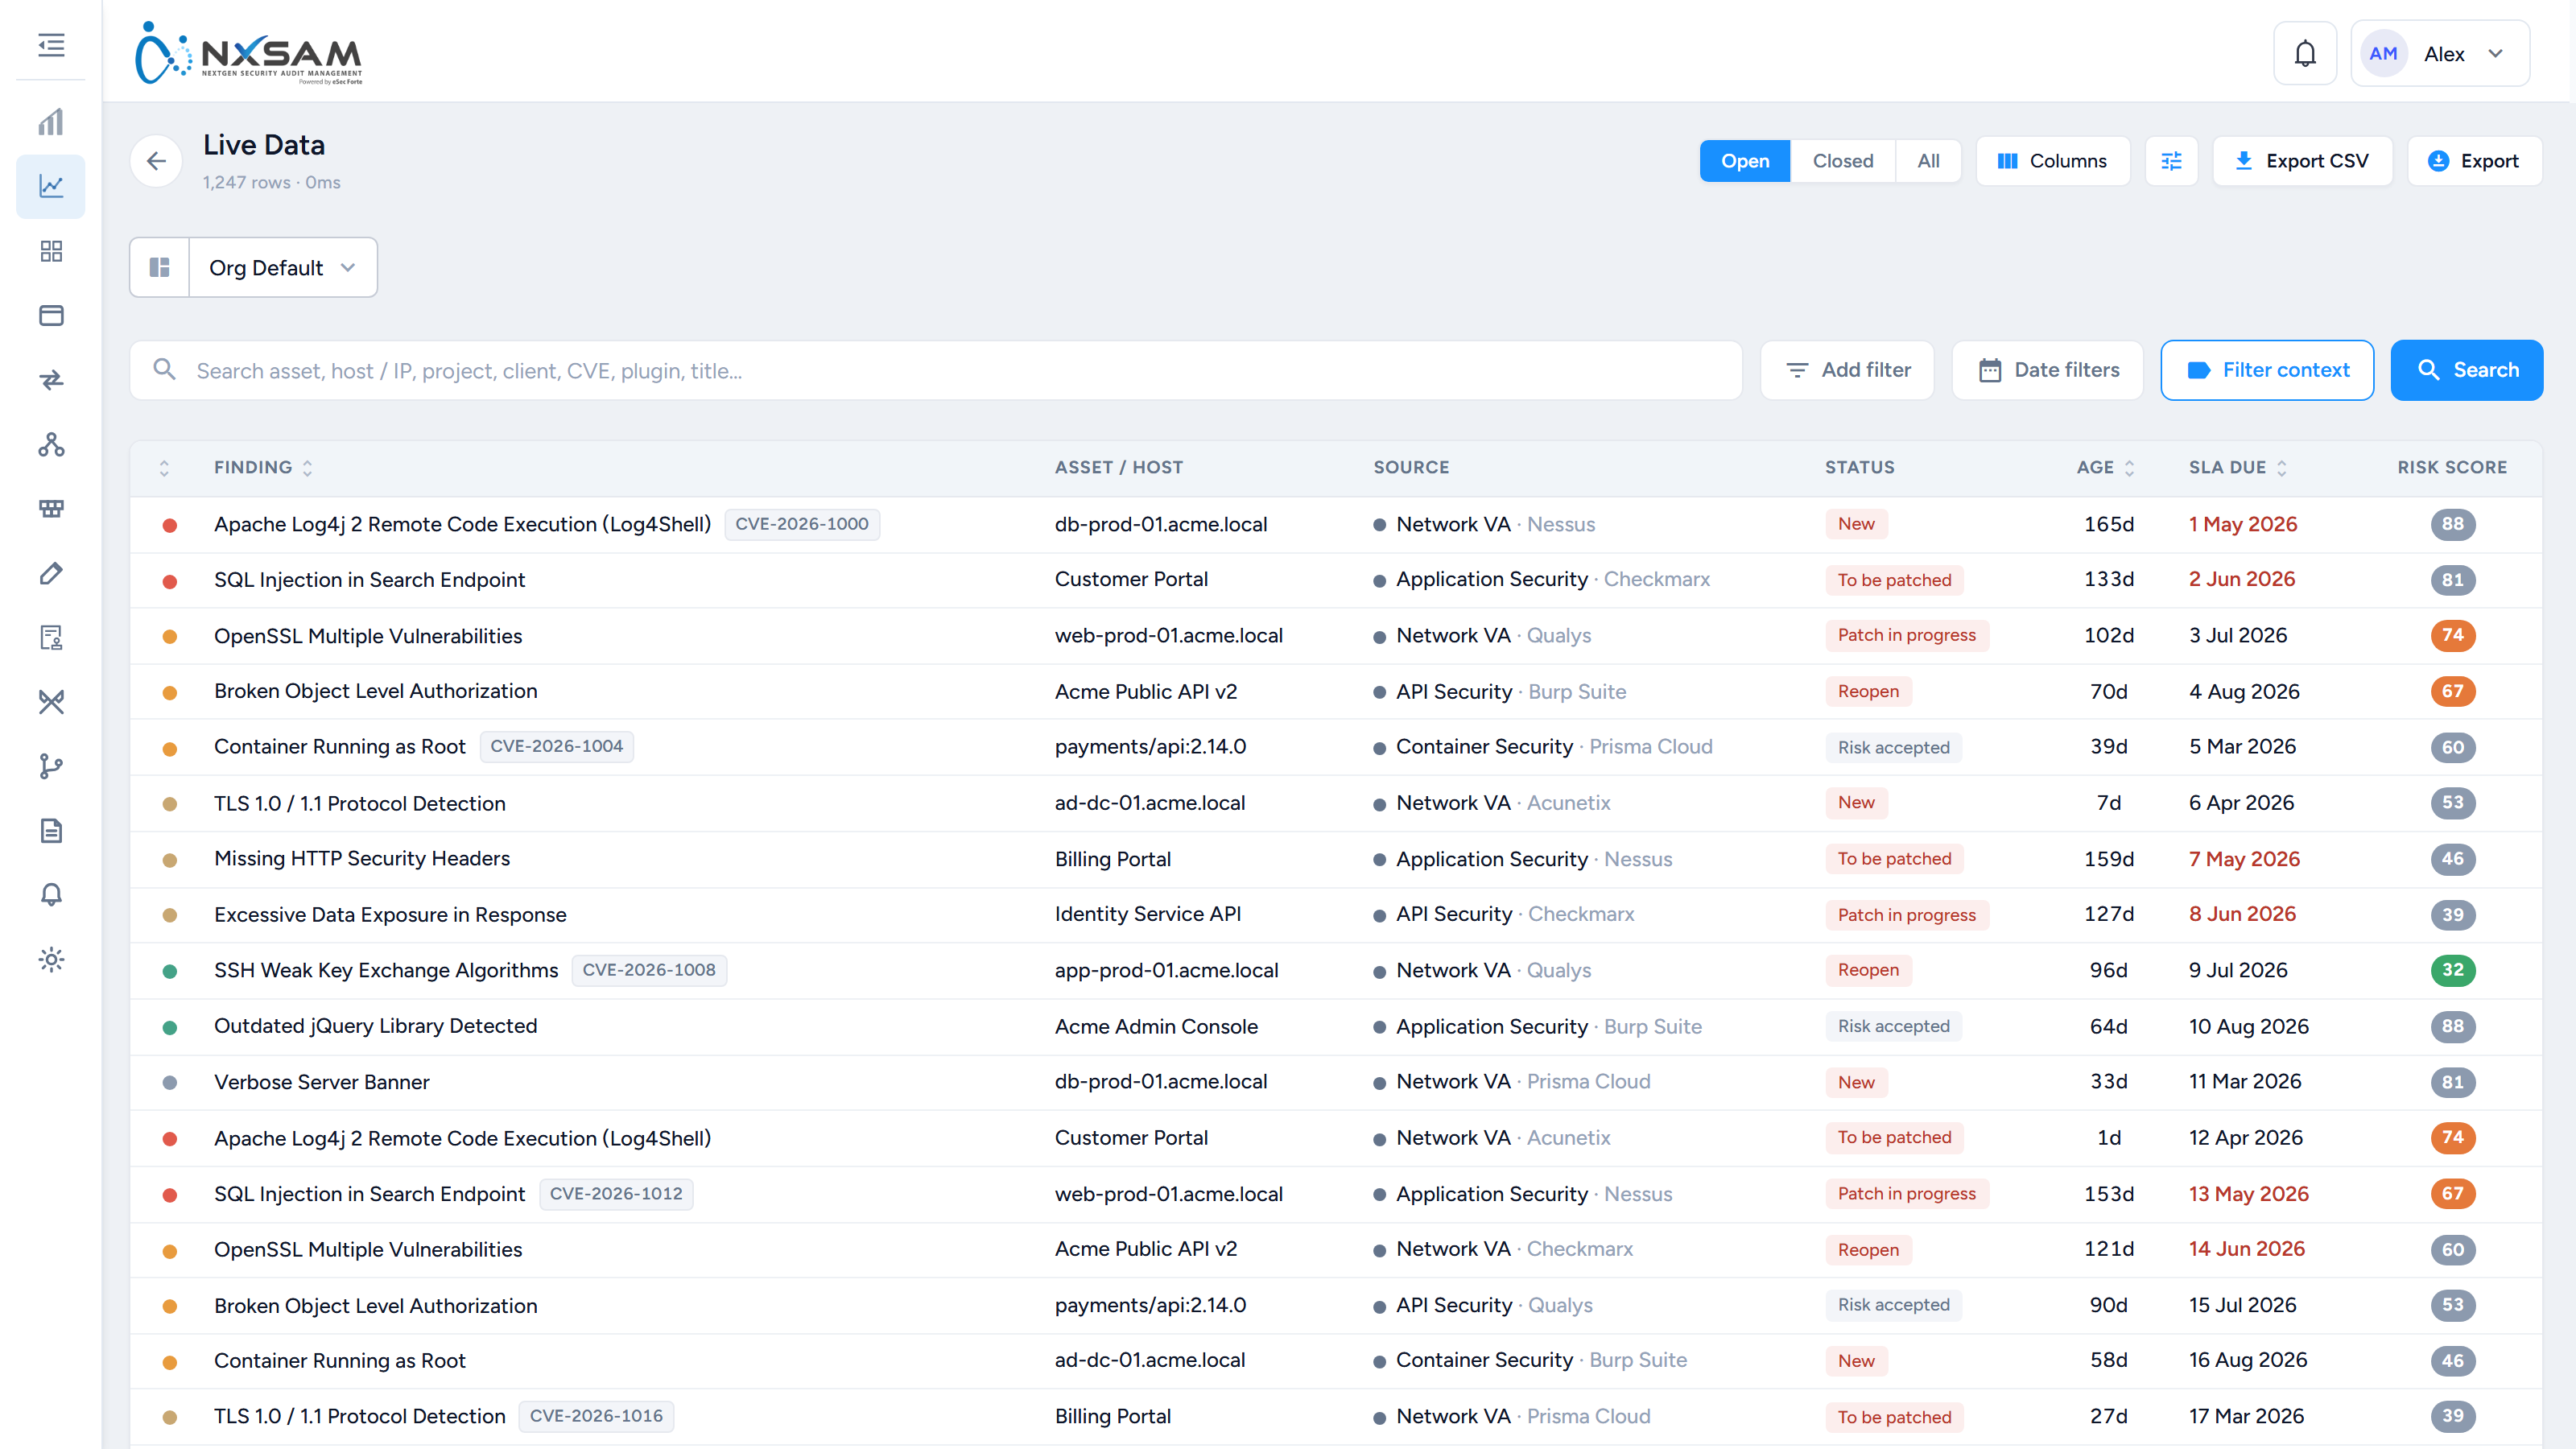
Reading the header
The subtitle under the title reports how many rows matched and how long the query took. Both are worth a glance: a row count that did not change after you applied a filter usually means the filter matched everything, and a query time climbing into seconds is the signal to narrow the range before exporting.
Open · Closed · All is the first decision and the widest one. Open is the default. It is a genuine change of population, not a filter on top of one — closed findings have no SLA state, so the SLA column and the overdue colouring are meaningful only on Open.
Choosing the columns
Columns opens a two-panel picker. The left panel is what you have selected, in the order they will appear; the right is everything available, grouped.
- Reorder with the up and down arrows beside each selected column. The number to the left is its position.
- Remove with the cross; add by clicking a chip on the right.
- Reset to default returns the standard eight.
The picker groups what you can add into Standard — the product's own catalog — and Asset properties. The standard catalog, arranged here by what each column tells you:
| Columns | |
|---|---|
| Identity | Vuln ID, Plugin / Master ID, CVE |
| Where it lives | Client, Project, Asset Type, Asset URL, Bifurcation Type, Port, Protocol, Technology, Instance |
| Where it came from | Module, Tool, Network Type, Audit Type, Audit, Audit Category, Auditor, Audit Completed |
| Risk and rating | Risk (legacy), Risk Rating, Policy, Posture |
| Lifecycle | Open/Closed, Discovered, Risk Accepted On, Exception Expires, Synced At |
The default set is Severity, Finding, Asset / Host, Source, Status, Age, SLA Due and Risk Score, which is why those eight do not appear above.
Asset properties is the group worth knowing about. Any property your organisation has defined — data classification, hosting region, business criticality, owning team — becomes a column here under its own name, with no development and no request to us.
Not every column can be sorted
A sortable heading carries a sort control. The rest are display-only, because sorting them would mean ordering the whole result set rather than the page you can see. Sort is available on severity, finding title, age, SLA due date, discovery date, legacy risk score, client, project, tool and vulnerability ID.
Filtering: four different mechanisms
They stack, and knowing which is which saves a lot of confusion about why a list is not what you expected.
| Mechanism | Where | Lives how long |
|---|---|---|
| Search | The search box | Until you clear it |
| Pinned quick filters | The chips above the search box | Saved on your profile |
| Ad-hoc conditions | Add filter | This session only — deliberately not saved |
| Date ranges | Date filters | Until cleared |
Search
One box across asset, host or IP, project, client, CVE, plugin and finding title. Press Enter or use Search.
Pinned quick filters
Two kinds of chip sit on the filter rail, and they behave differently:
- A property pin opens a value list when clicked — pick values, choose Include or Exclude, Apply. Use it for a field you filter on constantly but with different values each time.
- A value pin is a single click that applies one exact condition — "Severity: Critical", "Module ≠ Container". Use it for a filter you apply the same way every time.
Every value list shows how many findings carry each value beside it, so you can see whether a filter is worth applying before you apply it.
Include and Exclude are available everywhere. Exclude is the one people miss, and it is usually the shorter route: "everything except Informational" is one condition, where the include-form is four.
Applied filters appear as bubbles under the rail, each removable on its own, with Clear filters to drop them all.
Ad-hoc conditions
Add filter opens a builder for conditions you need once. Add as many rows as you like; each is a field, an Include/Exclude choice, and either values ticked from a list or text to match.
The field's type decides which you get. Enumerable fields — severity, module, status, owner — give a searchable checkbox list with counts. Free-text fields give a contains box, where a comma separates several alternatives.
These are explicitly not saved. The dialog says so. If a condition proves useful enough to want again, pin it on the rail instead.
Date filters
Two ranges, each with a from and a to: Discovered (when the finding first arrived) and SLA Due. They answer different questions — "what appeared last quarter" versus "what falls due next month" — and combine freely.
Filter context
Filter context adds a second line under each row listing the fields you filtered on, with this row's values. It exists for the case where you filtered on something that is not one of your columns — asset owner, say — and want to see the matched value per row without adding a column. Fields already visible as a column are skipped, so the line never repeats what you can already read.
Drilling in from a widget
Arriving from a chart, the slice you clicked appears as chips above the table — Severity: Critical, Module: Network VA. Each has its own cross, and Clear all removes the set, which is how you widen from one bar to its whole chart without going back.
Click any row to open the detail drawer: the full finding grouped into Classification, Source & Audit, Location, Lifecycle, Risk and Asset properties, plus a Matched filters section at the top showing exactly why this row is in your list.
Profiles
The profile selector sits at the left of the filter rail and shows which profile you are on. The menu lists yours, marks the default, and tags each as Private, Shared or Public.
A profile carries your pinned filters, their default values, your column choices and your export configuration. Load Org Default returns to the organisation's standard arrangement, discarding your session's tweaks.
Ad-hoc changes are not saved automatically — the switcher says so. Column choices are the exception, and only on request: both column pickers offer Save as the default for this profile, which is offered only on a profile you own. A profile shared with you stays as its author arranged it.
Exporting
Export is a separate configuration from what is on screen, which is deliberate — the columns that make a readable screen and the columns that make a useful spreadsheet are rarely the same set.
The tune icon beside Columns opens the export picker. It works identically — select, order, reset — with one addition: each column has a free-text heading. Whatever you type becomes the heading in the CSV. Leave it blank to use the product's own label. This is how an export lands in a colleague's inbox already using their vocabulary rather than ours.
Export CSV then runs against your current filters, status choice and export columns.
Exports run in the background, and one at a time
An export does not hold the page. It is queued, and the Export panel beside the button reports its state — running, completed with a file size, or failed with the reason. Download from there. While one is running the button is disabled: a second export of a large result set would compete with the first for the same resources.
When the page says the warehouse is not available
Live Data reads from the analytics warehouse rather than the operational database, which is what lets it page through millions of findings. Two messages tell you it is not there:
- "Warehouse isn't connected" — no connection is configured. Administrators see a Configure Warehouse button; everyone else should raise it with their administrator.
- "Warehouse is unreachable" — configured, but the server did not answer. This is an infrastructure matter, not a settings one, and the only offered action is to return to the dashboard.
The rest of the platform is unaffected in both cases — the module screens read the operational database directly.