Build your own dashboard
The Analytics Dashboard ships with a set of widgets, and almost none of what you see is fixed. You can rearrange it, hide what you do not use, build charts the product does not supply, save the result as a named profile and share that profile with colleagues.
This page covers all of it, in the order you would actually do it.
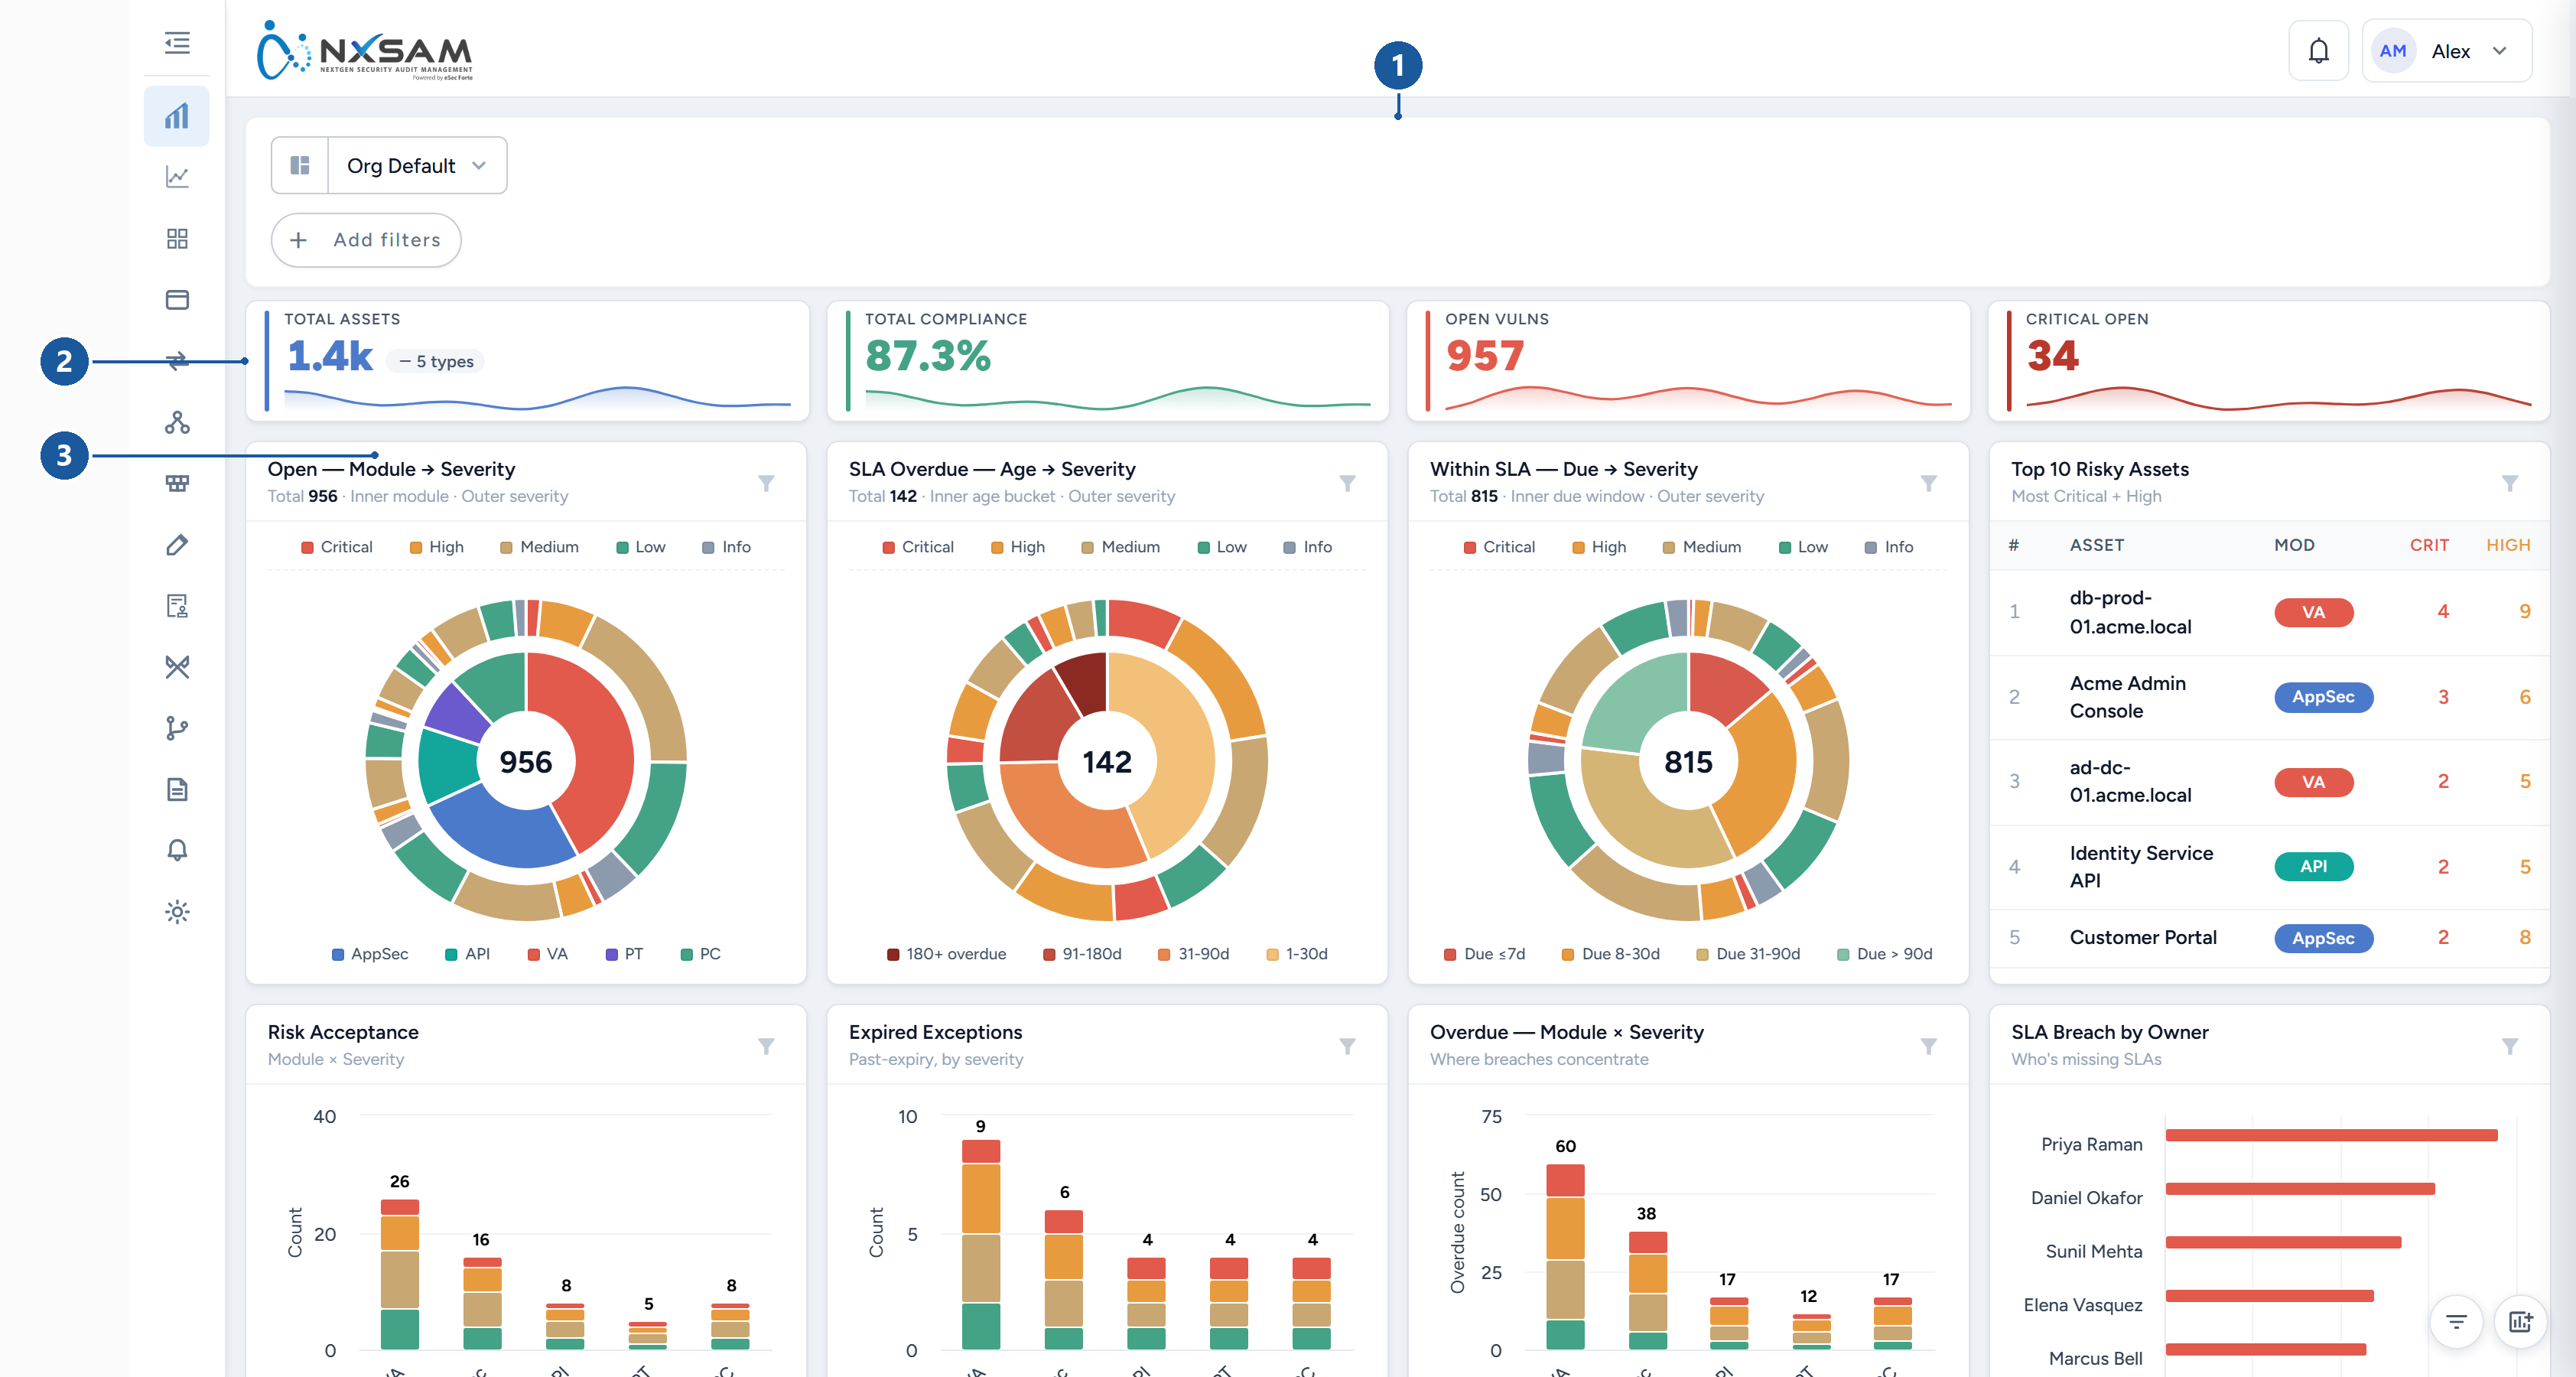
1 The profile selector and the global filter bar · 2 Headline figures · 3 One widget, with its own filter control
The four things you can change, and who they affect
They are separate, and confusing them is the usual cause of "my dashboard looks different from yours":
| What | Scope | Where |
|---|---|---|
| Global filters | This session, until cleared or saved into a profile | The filter bar |
| Layout — position, size, which widgets show | Your profile | Edit dashboard layout |
| Per-widget filters | The widget, within your profile | The funnel icon on a widget |
| Excluded severities | Every widget at once, for you | Dashboard settings |
A profile carries the first three together. Sharing a profile shares all of them.
Rearranging the layout
Open Edit dashboard layout (the toolbar at the bottom right of the dashboard). The grid appears and the widgets become movable — outside edit mode they are deliberately fixed, so you cannot nudge a widget out of place by accident while reading.
While in edit mode:
- Move a widget by dragging its header. Dragging the chart itself does nothing — that is reserved for interacting with the chart.
- Resize from any edge or corner.
- Widgets swap rather than push: drag one onto another and they exchange places. Nothing below shuffles unexpectedly.
- The grid is 24 columns wide with a fixed row height, so widget sizes are consistent rather than arbitrary — a half-width widget is exactly half-width on every screen.
The edit toolbar runs across the top of the grid:
| Button | What it does |
|---|---|
| Add chart | Opens the custom chart builder, described below |
| Widgets | The full widget list with a switch each — hide what you do not use rather than working around it |
| Compact | Pulls every widget upward to close empty rows left by hiding or resizing |
| Reset to defaults | Back to the factory arrangement, discarding your changes |
| Discard | Leaves edit mode and restores what was there when you entered it |
| Save & Exit | Keeps the arrangement and returns to the normal dashboard |
Nothing is saved until you press Save & Exit, so experimenting is safe.
Edit is only offered on a profile you own
A profile shared with you is read-only. To rearrange it, save your own copy first (Save as new profile…) — you then own the copy and can edit freely.
Building a custom chart
Add custom chart opens the builder. A chart is three decisions — what to measure, how to group it, and how to draw it — and the preview updates as you make them.
1. Choose a chart type
The type decides how many groupings you must supply, so pick it first.
| Type | Groupings | Notes |
|---|---|---|
| KPI / single value | none | One number. The only type that can show PC compliance % |
| Bar, Pie, Donut | exactly 1 | The straightforward comparisons |
| Stacked bar, Grouped bar | exactly 2 | Stacked answers "of this total, how much is X"; grouped compares side by side |
| Line, Area | 1 or 2 | The two types that accept a time grouping — use these for trends |
| Matrix, Heatmap | exactly 2 | Where two dimensions cross; heatmap shades by value |
| Table | up to 2 | When the numbers matter more than the shape. Returns far more rows than a chart |
2. Choose what to measure
| Metric | Available on | Notes |
|---|---|---|
| Issue count | Open and closed | The default |
| Affected assets | Open and closed | Counts assets, not findings — a host with nine findings counts once |
| Avg vuln score, Total vuln score | Open and closed | Weighted views, for when a count treats a critical and an informational alike |
| Overdue count, Overdue % | Open only | Past its SLA date. A closed finding has no SLA state, which is why these are open-only |
| No-SLA count | Open only | Findings with no SLA date at all — usually the more urgent gap |
| Within-SLA count | Open only | The complement of overdue |
| MTTR (days) | Closed only | Mean time to remediate. Groupable by severity or module only, and cannot be shown over time |
| PC compliance % | Open only | KPI type only |
Data scope — open or closed issues — is a separate choice, and it constrains the metric list: pick closed and the SLA metrics disappear, because they do not exist for a closed finding.
3. Choose the groupings
Dimensions are the fields the chart groups by: severity, module, status, asset, owner, project, business unit, source tool, and your own asset properties — anything you have defined as a property is groupable here, which is what makes a data-classification or hosting-region breakdown possible without any development.
For a time-based chart (line, area, table) you also choose:
- Time field — Reported date (when the finding arrived) or Closure date (when it was resolved). A trend of closures is a different question from a trend of discoveries.
- Bucket — day, week or month.
4. Presentation
| Control | Effect |
|---|---|
| Title | The widget's heading |
| Sort, Limit | Order and how many groups to keep — a "top 10" is a limit of 10 |
| Stacking | Normal or percentage, on the stacked types |
| Orientation | Vertical or horizontal bars. Horizontal reads better with long labels |
| Show legend, Legend position | |
| Show value labels, Label format, Label placement | Numbers printed on the marks themselves |
| Donut hole | The size of the hole, on donut charts |
| Color palette | Default, cool, warm, vivid or mono. Spelled the American way on screen, so it is spelled that way here |
Widget filters on the same dialog restrict this chart alone, independently of the dashboard's global filters — a chart showing only Critical findings while the rest of the dashboard shows everything.
The Preview is live. If it says Select a dimension to see a preview, the chart type you chose needs more groupings than you have supplied.
Saved charts appear as widgets on your dashboard, and can be moved and resized like any other. Each carries Edit, Refresh and Delete on its card.
Profiles: saving and sharing a dashboard
A profile is the whole dashboard as you arranged it — layout, hidden widgets, custom charts, per-widget filters and the global filter selection.
All three live in the profile menu, opened from the profile name at the top left:
| Menu item | What it does |
|---|---|
| Save as new profile… | Creates a named profile from what is on screen now — filter pins, values and widget layout. Your other profiles are not affected |
| Manage profiles… | Rename, set one as your default, or delete |
| Share current profile… | Makes the profile available to others. Offered only on a profile you own |
Sharing offers three levels:
- Private — only you. The default.
- Specific people — chosen by name; you can see who currently has access.
- Anyone in the organisation — everyone who can sign in.
A profile you receive is view-only. You can use it, filter within it, and save your own copy, but you cannot alter the original — so a shared executive view stays as its author intended.
Custom charts travel with the profile
Sharing a profile shares the custom charts on it. Recipients see them as read-only widgets. If a chart matters to a team, sharing the profile is how it reaches them.
Settings that apply to every widget
Dashboard settings holds options that cut across the whole dashboard rather than one widget. The significant one is Severity exclusions: severities excluded here are removed from every widget at once.
This is how a team that treats Informational findings as noise gets a dashboard that matches how they work. It is also worth knowing before you compare totals with someone else — an excluded severity is not shown anywhere, including in the headline figures, so two dashboards can legitimately disagree.
When you and a colleague see different numbers
In order of likelihood:
- A pinned global filter on one of you. The commonest by far.
- Different profiles — including the case where one of you is on a shared profile and the other on their own.
- A per-widget filter on the widget being compared, which the global filter bar does not show.
- Different severity exclusions in dashboard settings.
- A stale widget — press Refresh on the card before assuming the data is wrong.