

NxSAM Support Handbook
End-to-end workflows, limitations, checks and error scenarios for the NxSAM support team
| Product release | NxSAM 2026.09 |
| Verified against code on | 2026-09-10 |
| Document revision | b441b08-dirty |
| Audience | Support / internal |
| Document owner | eSec Forte Technologies — Product Documentation |
| Code baseline | backend 57568045de (2026-09-10) · frontend 9d9ba5c1e4 (2026-09-09) |
Screenshots are taken from a demonstration data set. Figures are illustrative.
INTERNAL USE ONLY — NOT FOR CUSTOMER DISTRIBUTION
eSec Forte Technologies
NxSAM
NxSAM is an enterprise security vulnerability management platform. It consolidates findings from your scanners into one inventory, tracks each finding through its lifecycle against an SLA, and reports on the result.
This manual is organised by module. Start with Getting Started.
Getting Started
Getting Started
NxSAM brings security findings from many tools into one place, tracks each one until it is fixed and verified, and reports on the result. This page gets you oriented; the rest of the manual covers each area in detail.
Signing in
Sign in with the username and password issued by your administrator.
Depending on how your organisation has configured NxSAM, you may also be asked for:
- a verification code shown on screen, to confirm you are not an automated client, and
- a one-time passcode, sent to you when you sign in.
If your organisation uses corporate sign-on, your existing directory credentials are used and NxSAM does not hold a separate password for you.
Finding your way around
The left sidebar is the main navigation. It lists the security modules your role can reach — you will not see every module in this manual, only the ones you have access to.
The top bar carries notifications and your own account menu, where you change your password and sign out.
Most module screens follow the same pattern:
- Filters at the top, narrowing what is listed below.
- A list or table of records.
- Actions on each row, and sometimes in bulk.
Once you have learned one module's list screen, the others will feel familiar.
What you will see first
Where you land depends on your role and configuration — commonly a dashboard summarising current posture. If you would rather start somewhere else, your administrator can change the landing page.
If something is missing
The most common surprise for new users is not seeing something a colleague can see. This is almost always intentional:
- Modules are shown by role. If a module is absent from your sidebar, your role does not include it.
- Assets and findings are shown by ownership. You see the assets you are responsible for.
Neither is a fault, and neither is fixed by refreshing. Both are resolved by an administrator adjusting your role or asset ownership.
Changing your password
Use the account menu in the top bar. If your organisation uses corporate sign-on, change your password there instead — NxSAM will not hold one for you.
Notifications
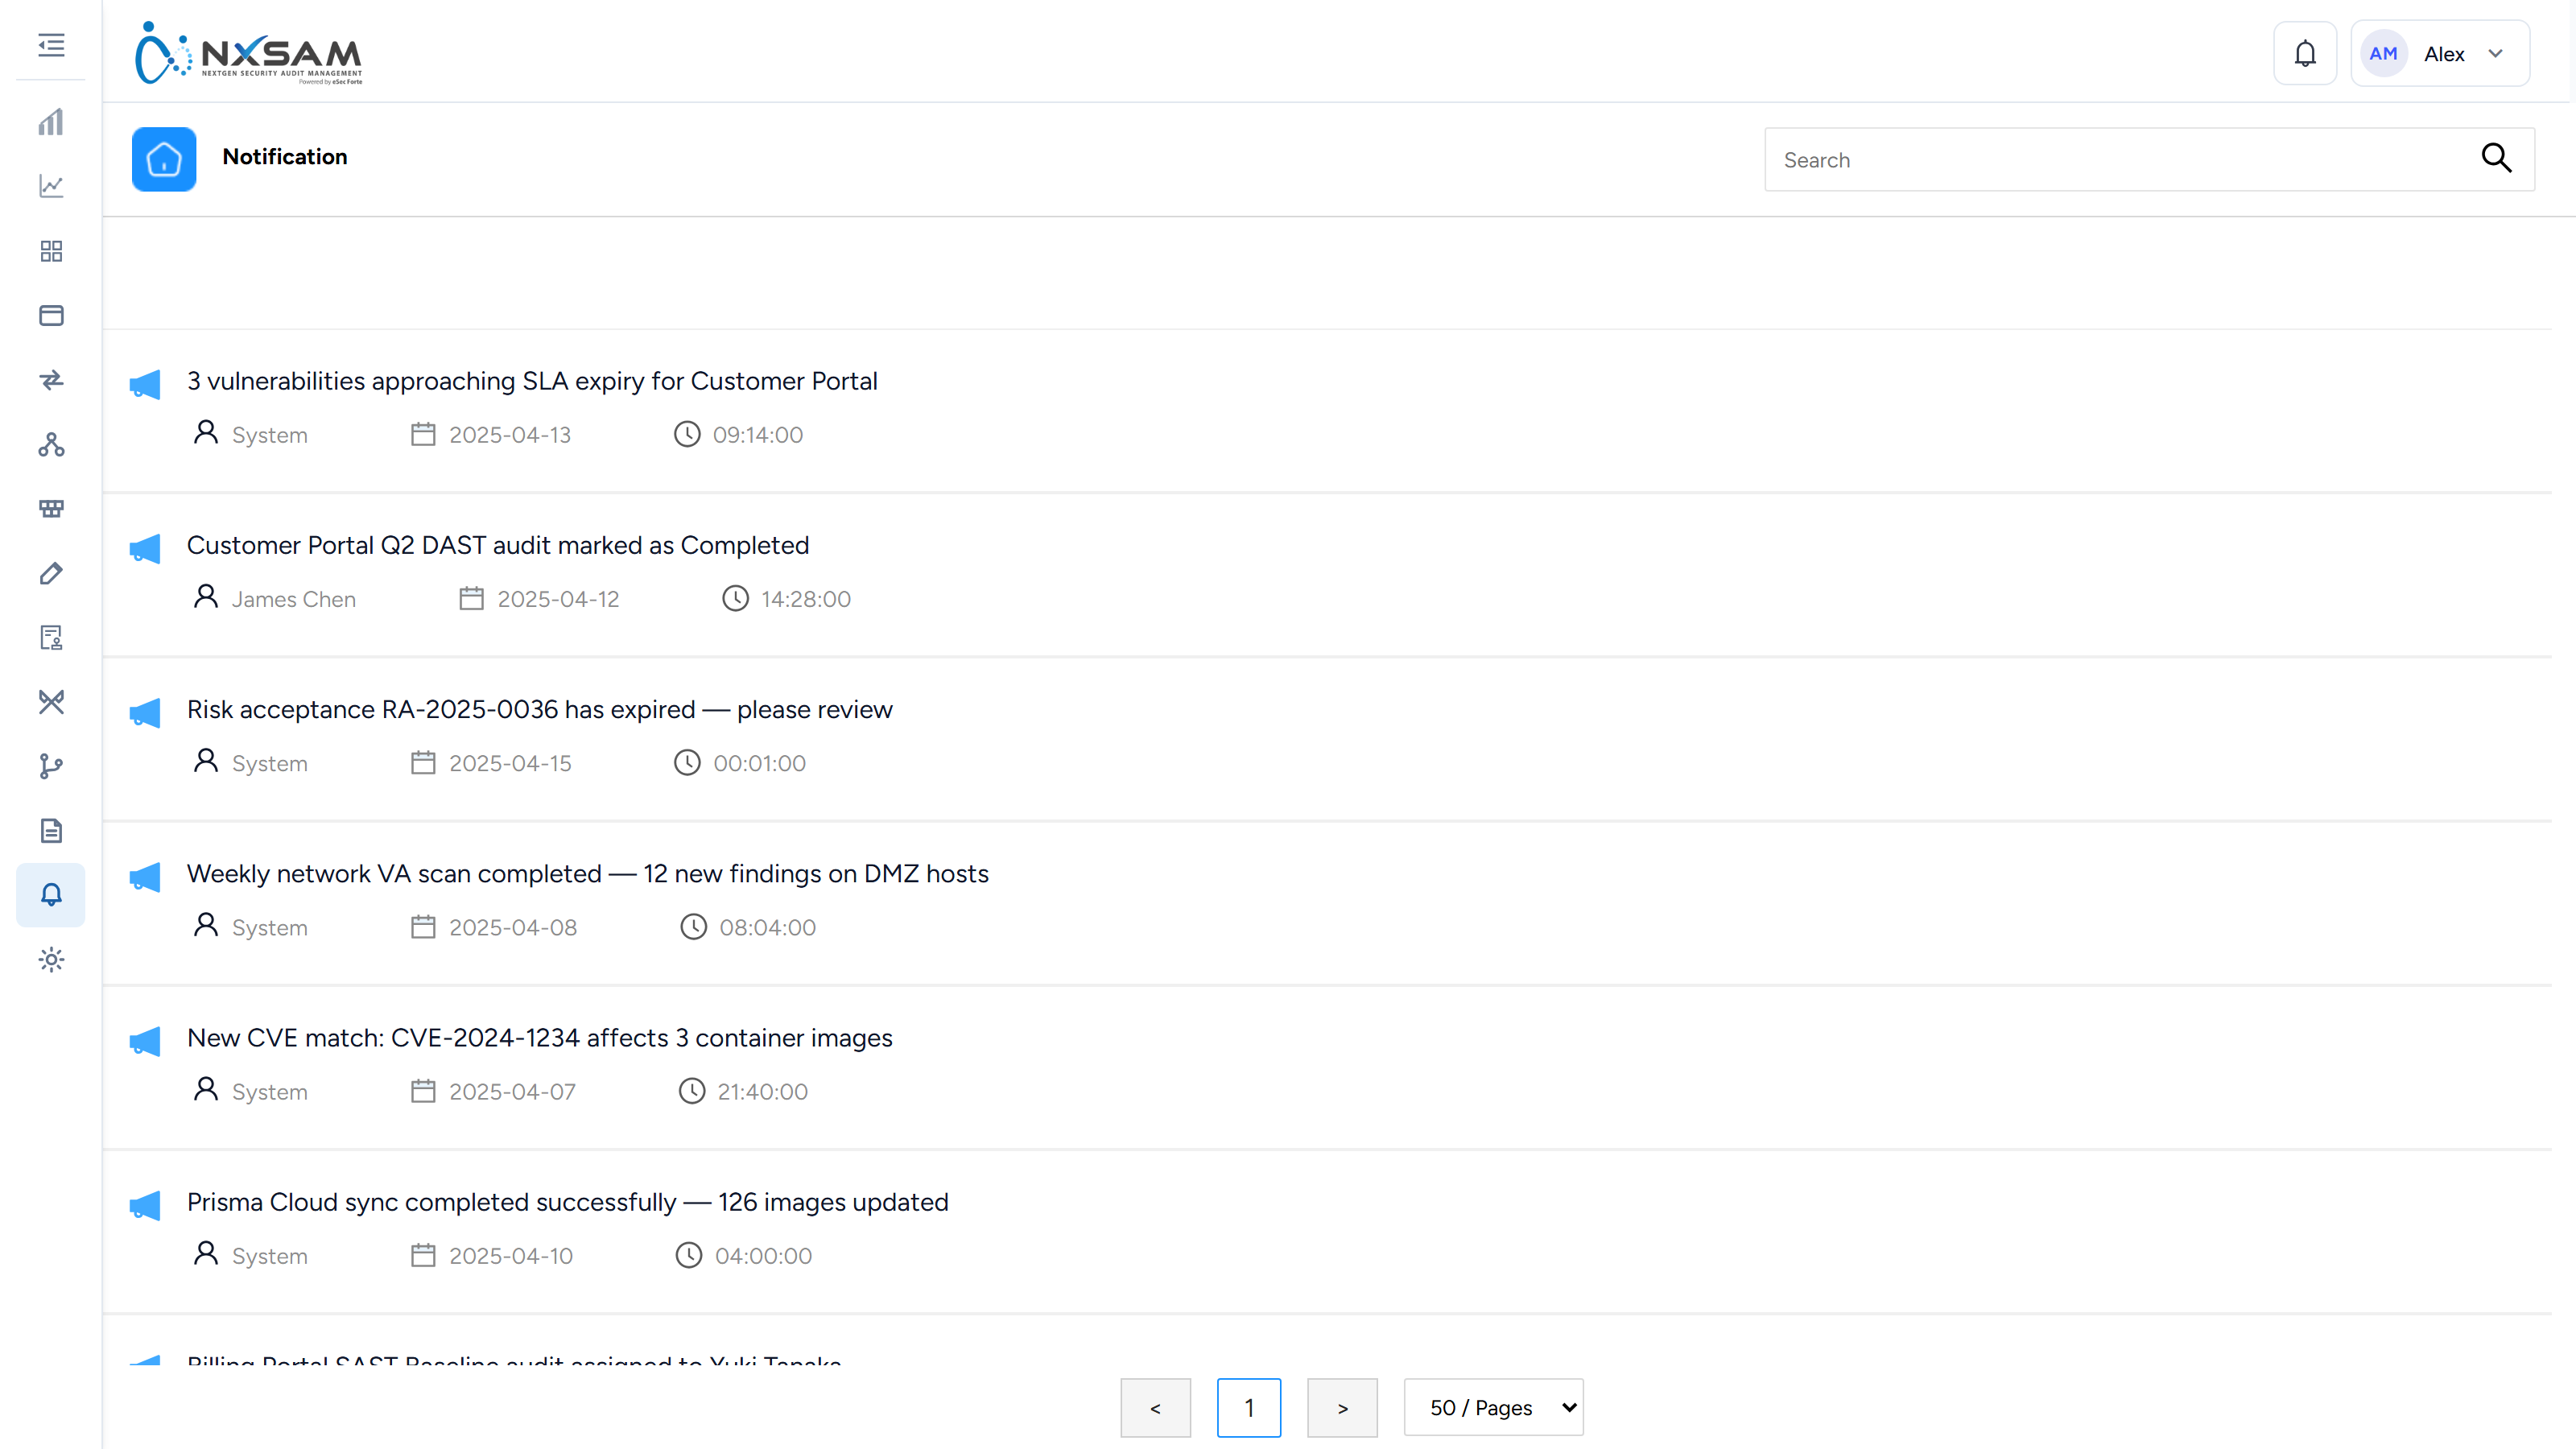
The bell in the top bar collects things that need your attention — findings assigned to you, approaching SLA dates, and requests awaiting your approval. Depending on configuration you may also receive some of these by email.
Where to go next
Read How NxSAM Works before diving into a specific module. It explains assets, audits, vulnerabilities and SLAs — the four ideas everything else is built from, and understanding them once saves confusion in every module.
Sign in to NxSAM
- Open the NxSAM address your administrator gave you.
- Enter your username and password.
- Choose your Directory, if the field is shown.
- Complete any additional verification your organisation has enabled.
The screen adapts to how your organisation authenticates, so what you see depends on your deployment.
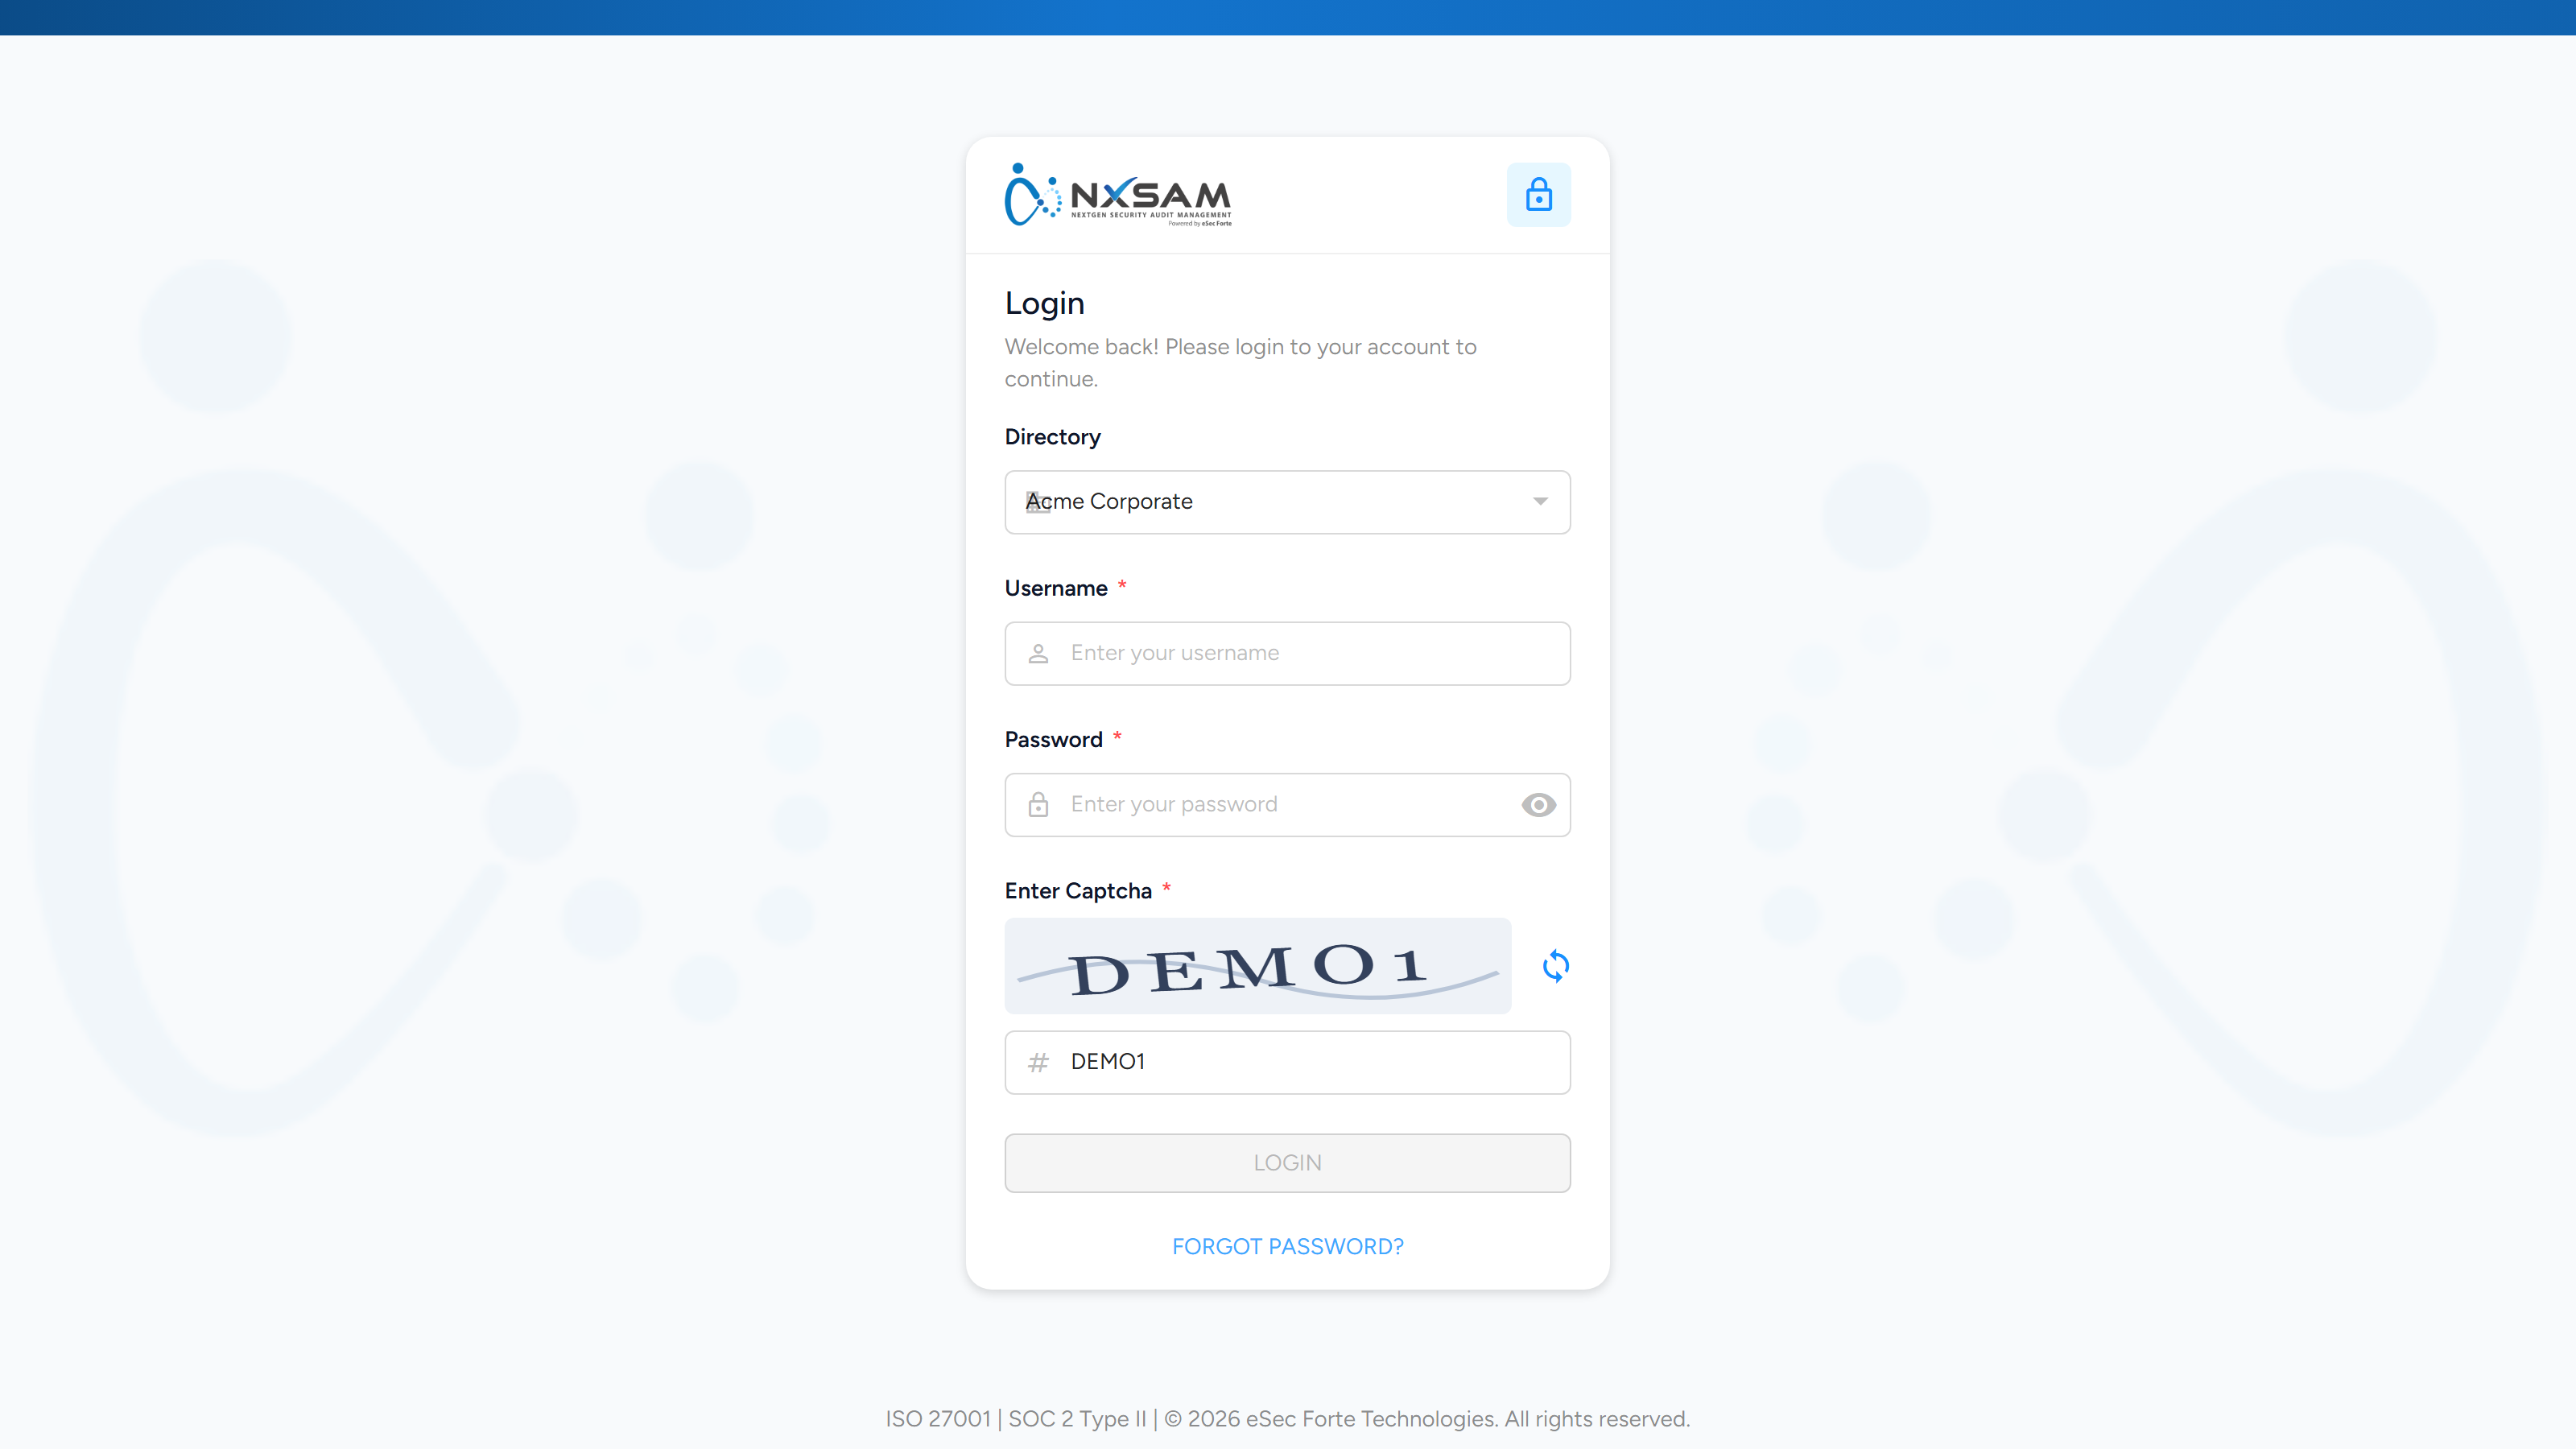
The fields
| Field | When it appears |
|---|---|
| Username | Always |
| Password | Always |
| Directory | Only when more than one Active Directory is configured |
| Captcha | When enabled for the deployment |
| OTP | When two-factor sign-in is enabled for your account |
Choosing a directory
If your organisation authenticates against more than one Active Directory — separate domains for staff and contractors, or one per acquired entity — a Directory list appears above the password field. Pick the one your account belongs to.
The list is absent when only one directory is configured, because there is nothing to choose. It is also absent for accounts that sign in with an NxSAM password rather than a directory.
Signing in against the wrong directory looks like a wrong password
The credentials are checked against the directory you selected. A valid username and password fail if they belong to a different directory, and the message is the same one you get for a genuinely wrong password.
If you are certain the password is right, check the Directory selection before asking for a reset.
When sign-in fails
| What you see | Usual cause |
|---|---|
| Invalid credentials, and you are sure they are right | The wrong Directory is selected |
| Account locked | Too many failed attempts — an administrator clears it with Unlock User |
| Signed in, then immediately returned to sign-in | The session was ended elsewhere, or your account was deactivated |
| No OTP arrives | Check the mobile or email on your account with an administrator |
An administrator can see whether the platform accepted or rejected the attempt, and — for directory accounts — what the directory replied. Ask them to check the sign-in and directory logs rather than retrying repeatedly, which can lock the account.
How NxSAM Works
How NxSAM Works
NxSAM collects security findings from many different tools, keeps them in one place, and tracks each one until it is fixed and verified. Everything else in this manual is a variation on that idea, so it is worth understanding once.
The four things NxSAM keeps track of
| What it is | |
|---|---|
| Asset | Something that can have a weakness — a web application, a mobile app, an API, a server, a container image. |
| Audit | One assessment of one or more assets. A scan you imported, or a manual test your team performed. |
| Vulnerability | A single weakness found by an audit, on a specific asset. |
| Deviation | A formal, time-limited decision to accept a vulnerability rather than fix it now. |
An audit belongs to an asset. A vulnerability belongs to an audit. That chain is why the same finding appears in several places in the interface — you are looking at the same record from different directions.
The life of a vulnerability
- Discovered. A scan is imported, or a tester records a finding by hand.
- Approved. Someone reviews the finding and accepts it into the audit. Until this happens, it is not counted in dashboards.
- Assigned an SLA. Based on its severity, the vulnerability is given a date by which it should be resolved. More severe findings get less time.
- Worked on. The owner investigates and fixes it, moving it through statuses such as Patch in progress and Patched.
- Validated. Someone confirms the fix actually worked. This is the step that closes it. A finding marked as patched but not yet validated is still open.
- Or reopened. If a later scan finds the same weakness again, it comes back as Reopen and continues to age.
Patched is not closed
The most common misunderstanding in NxSAM. Marking something Patched records that work was done; marking it Validated records that the fix was verified. Only the second one closes the finding and stops the SLA clock.
Severity and SLA
Every vulnerability carries a severity — Critical, High, Medium, Low or Informational. Severity drives two things: how it is ranked for attention, and how long you have to fix it before it is overdue.
The exact number of days per severity is configured per organisation, so check your own SLA configuration rather than assuming. What is universal is the shape: the more severe the finding, the shorter the window.
A vulnerability is overdue when today's date has passed its SLA date and it has not been closed. This is worked out fresh each time you look, which is why something can become overdue overnight without anyone changing it.
Deviations: accepting risk on purpose
Sometimes a finding cannot be fixed in the time available — the fix needs a vendor release, or a change freeze is in effect. A deviation records that decision formally: who asked, who approved, why, and until when.
Deviations expire. When one does, the vulnerability returns to normal tracking. The point is that risk acceptance is a dated, reviewable decision rather than a finding quietly disappearing.
Who sees what
NxSAM shows people only the assets they are responsible for. An asset owner sees their own applications; a security analyst sees the whole estate. If a colleague cannot see something you can, that is access control working, not a fault — the fix is a permission change, not a data change.
Where to go next
- To find your way around the interface, see Navigating NxSAM.
- Each security module — application, API, network, container, cloud — follows the same audit-and-vulnerability pattern described here, with its own specifics.
Find a specific vulnerability
Three ways, depending on what you already know.
If you know the asset
The quickest route when you are asking "what is wrong with this system".
- Go to the module the asset belongs to — Application Security, Network Security, and so on.
- Open the asset, then its audits.
- Open the audit to list its findings.
If you know the vulnerability
When you are asking "where do we have this problem" — after a CVE is announced, for instance.
- Open Analytics Dashboard → Live Data.
- Filter by the vulnerability name or identifier.
- The result lists every asset affected.
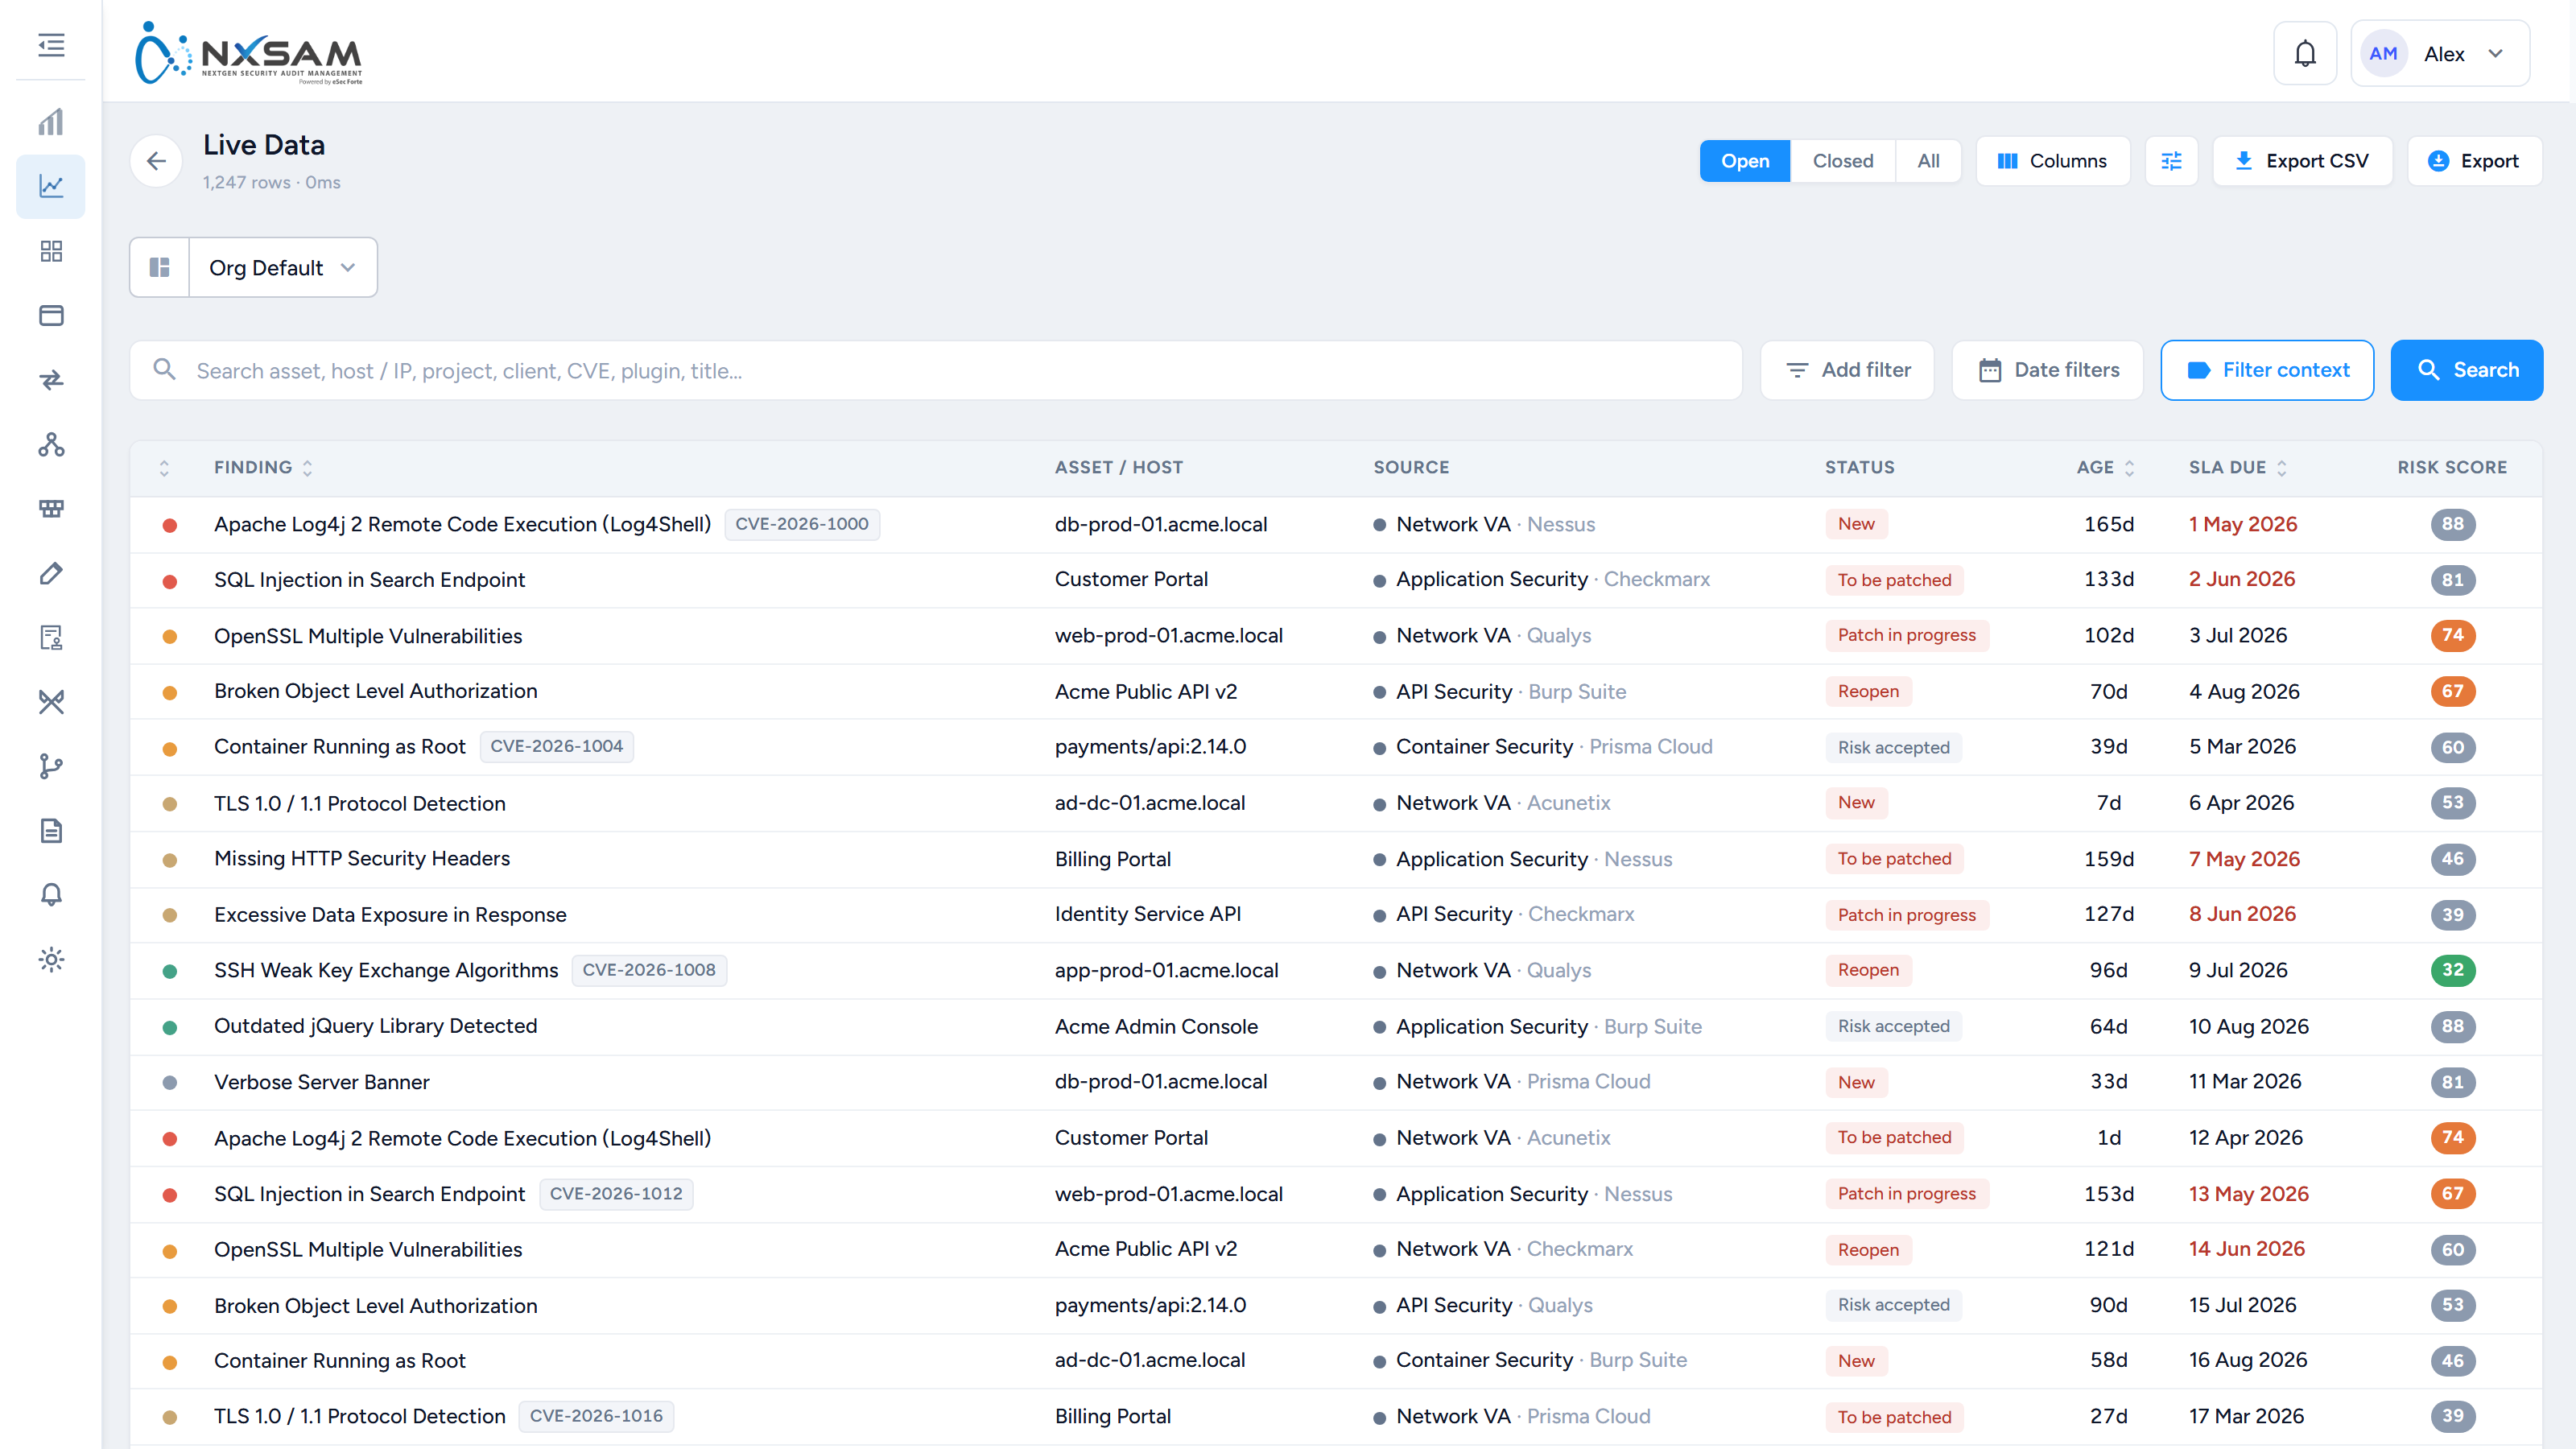
This is the view to use for "are we exposed to X", because it crosses all modules at once rather than making you check each in turn.
If you only know roughly what you are after
Use the filters on any module's vulnerability list. They combine, so you can narrow by several at once:
- Severity — Critical through Informational
- Status — open, in progress, closed
- SLA state — overdue, approaching
- Asset, owner, project, business unit
If the list looks empty, check the filters first
Filters persist. A filter set earlier — especially a pinned one on the Analytics Dashboard — remains applied, and an unexpectedly empty list is much more often a filter than an absence of data.
Reading the result
Each finding shows:
| Severity | How serious the weakness is |
| Status | Where it is in its lifecycle |
| SLA date | When it should be resolved by |
| Discovered | When it was first seen — not when it was imported |
| Asset | What it affects |
Open the finding for the full description, evidence, and history of what has happened to it.
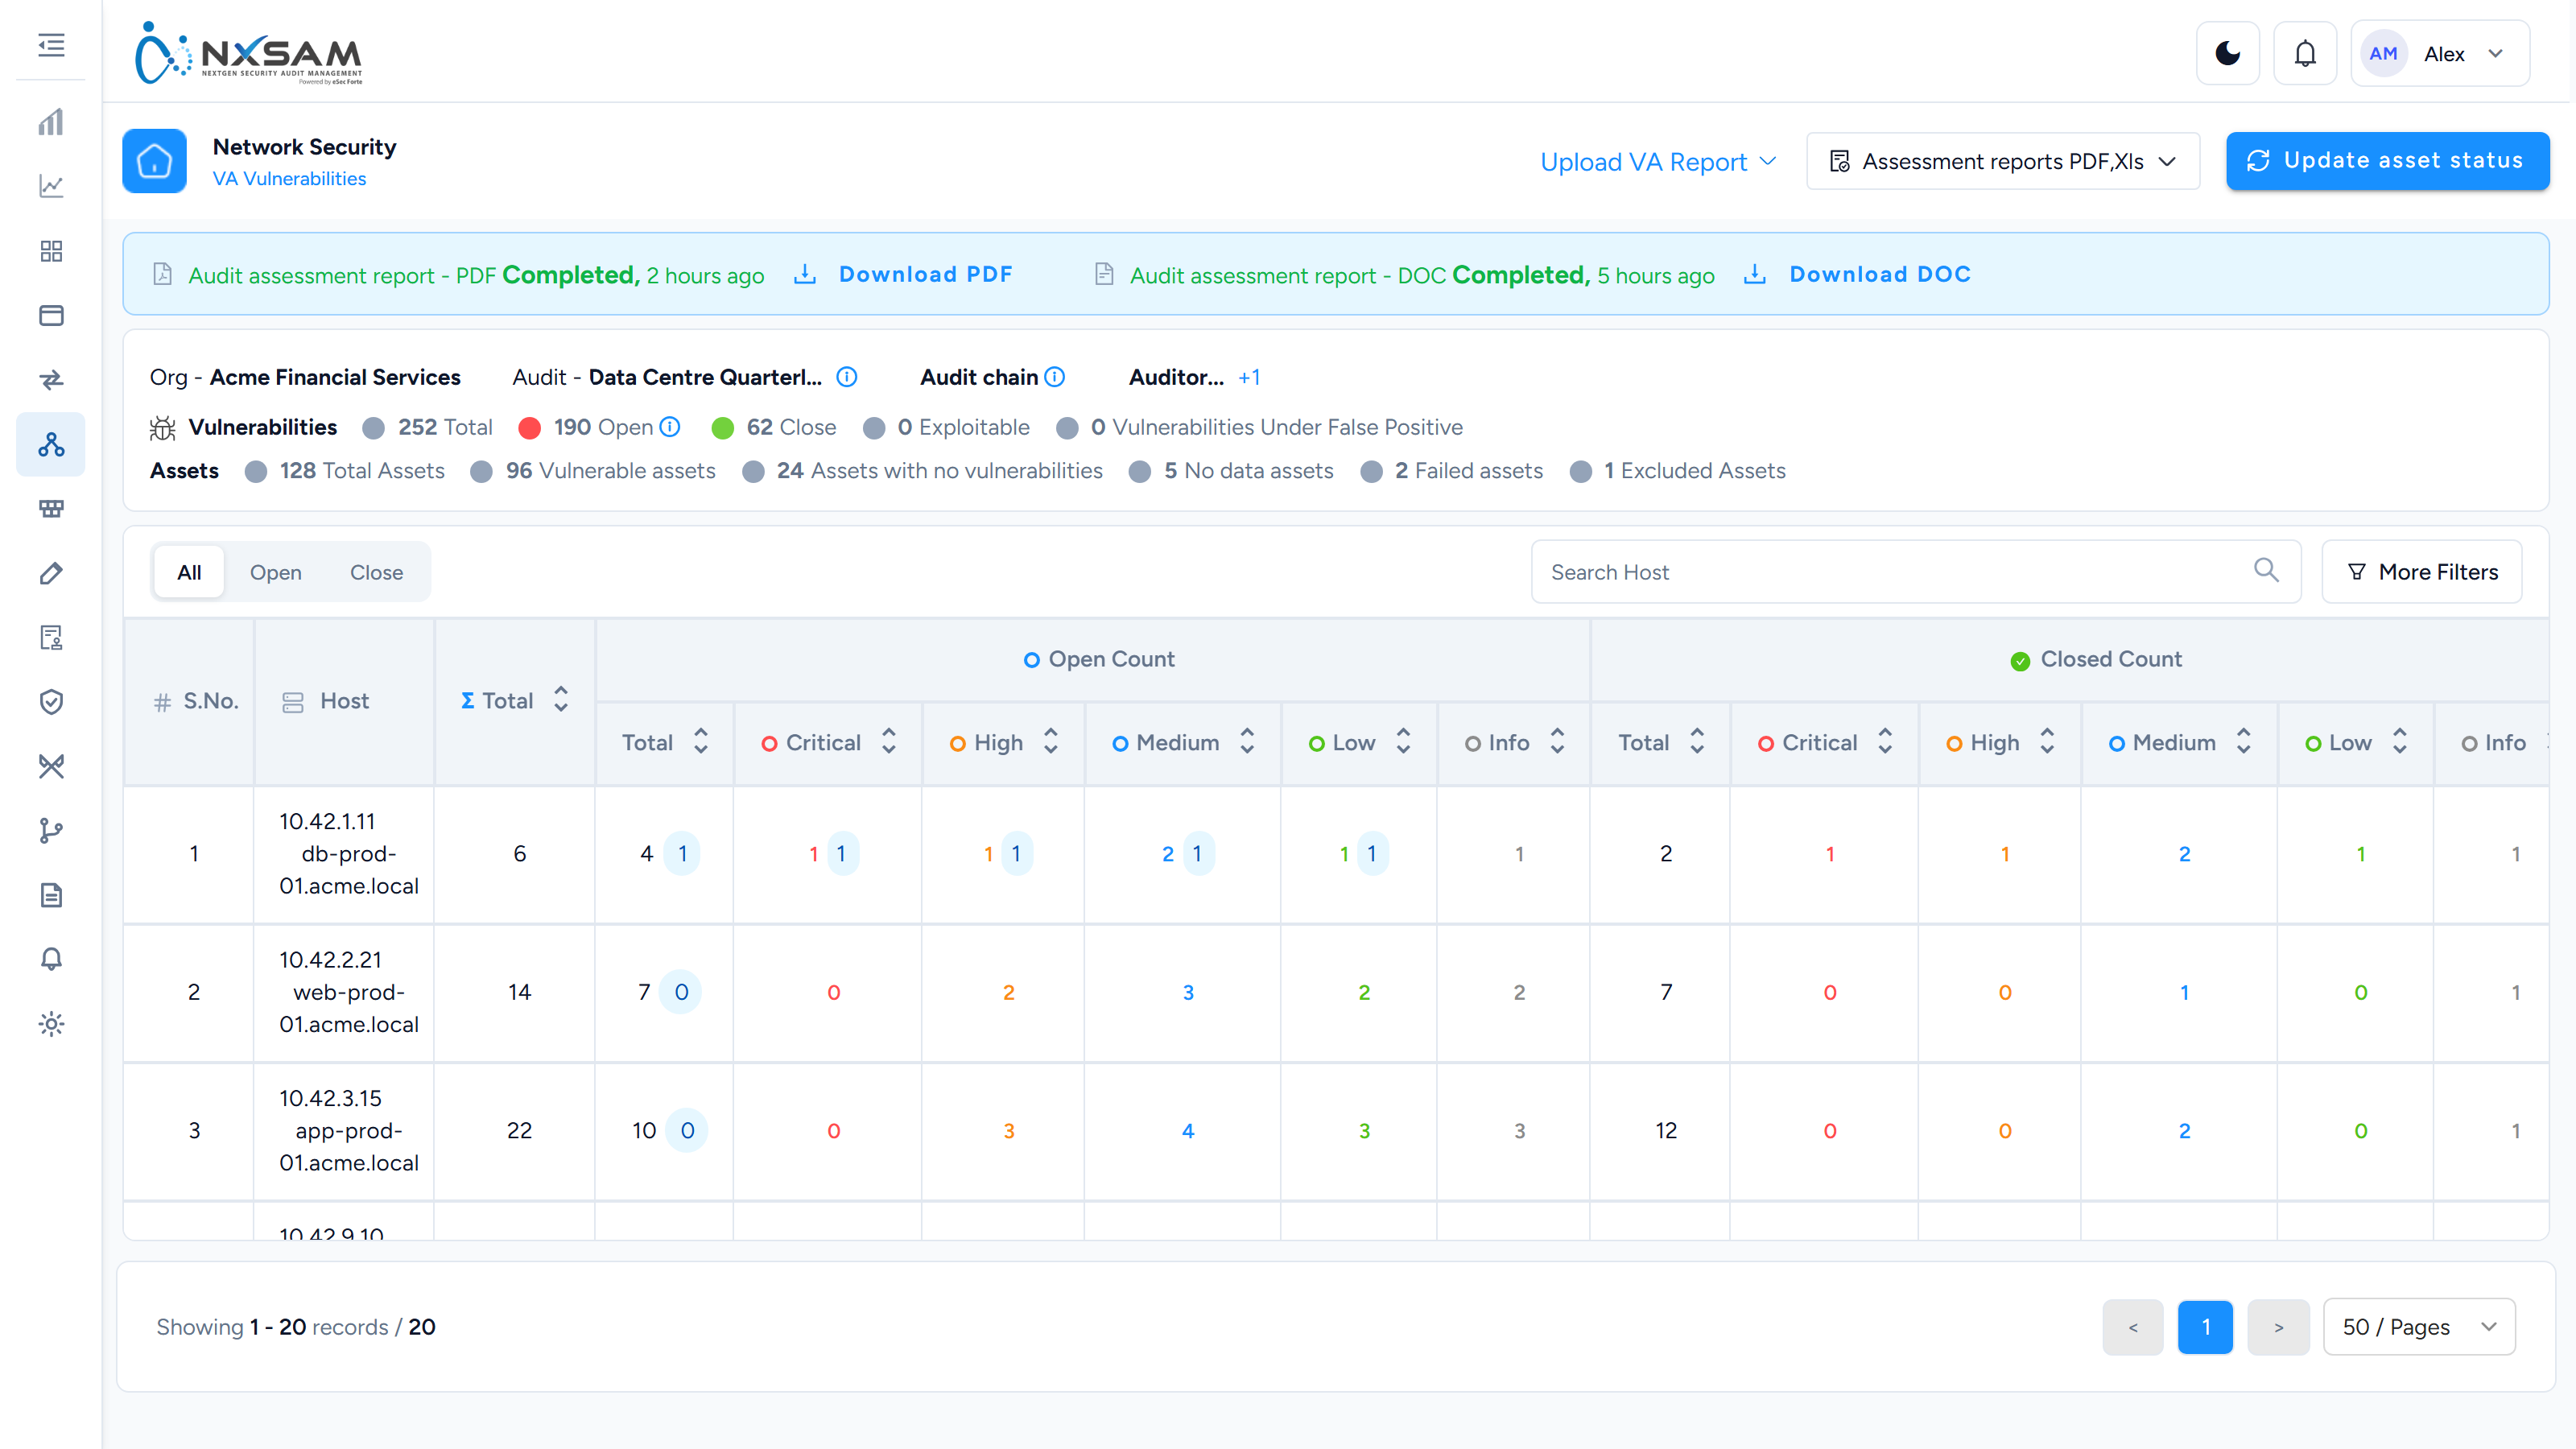
Discovered is not imported
A finding your scanner first saw months ago arrives already that old, and may already be past its SLA on the day it appears. That is correct — the weakness has genuinely existed that long.
The two status fields, and why findings disappear
More tickets come from this one design point than from anything else in the product, because two different fields are both called "status" in conversation and they answer different questions.
They are not the same field
Every finding carries two independent statuses:
| Question it answers | Owned by | |
|---|---|---|
| Validation status | Is this finding genuine and agreed? | The security team |
| Client status | What is being done about it? | The asset owner |
A finding has both at all times. Neither is derived from the other, and changing one does not change the other.
Validation status moves through Saved → Submitted → Approved, with Closed and
False Positive as terminal outcomes. Those five are the whole set. A finding is not
visible outside its audit until it is approved.
Client status covers remediation and has fourteen values: New, To be patched,
Patch in progress, Patched, Not Patched, On hold, Reopen, Validated,
Not Applicable, Risk accepted, Risk acceptance, Duplicate, Exception Handled,
Expired.
Only Validated and Exception Handled are flagged as closed in the product. Everything
else — Patched included — is still counted as an open finding, which surprises people
who have just marked a batch as patched and seen no movement in the totals.
The consequence people hit
A finding that exists is not necessarily counted
Dashboards, SLA clocks and posture counts consider approved findings. A finding
that has been imported and is visible inside its audit but is still Submitted will
not appear in any of them.
So "the dashboard is missing findings I can see in the audit" is almost always approval status — not a data loss, a caching problem, or a filter.
This is deliberate. It stops an unreviewed scanner export from moving the numbers a board sees. But it is invisible from the dashboard end, which is why it generates tickets.
The three questions that resolve most of these
- Is the finding approved? If not, it is working as designed. The remedy is review, not a bug report.
- Is the audit considered? An audit can be excluded from counting entirely. Its findings then exist, are approved, and still do not appear in aggregate figures.
- Is the client status one that counts as open?
Risk AcceptedandNot Applicablefindings are not closed — they are open findings deliberately not being fixed, and different screens treat them differently.
Work through them in that order. The first two account for most cases.
Re-opening, and what it does to the SLA
A finding closed and then seen again by a later scan is re-opened rather than created fresh. It keeps its identity and its history, which is what you want for audit purposes.
The corner case worth knowing: re-opening sets a new discovery date but does not always reset the SLA expiry. A finding can therefore show as discovered today and overdue at the same time — an apparent contradiction that is really two fields updated on different schedules. Treat the discovery date as "last seen", not "first seen", and read the SLA from the expiry date rather than inferring it from the age.
Why a count differs between two screens
When a module screen and the analytics dashboard disagree, it is one of four things, in descending order of likelihood:
- Approval. The module screen shows unapproved findings; aggregate views do not.
- Considered. An excluded audit is visible in its module and absent from totals.
- Timing. Analytics is served from a synchronised copy of the data. A gap between the two is a sync interval, not a discrepancy — the Warehouse Sync screen shows when the copy was last refreshed.
- Scope. The two screens are filtered differently. Asset-owner accounts see only their own assets, so the same screen shows different totals to different people, both correct.
Checking them in that order is faster than comparing row by row.
Workflow: a vulnerability from discovery to closure
The end-to-end journey, with the decision points where things actually go wrong. This cuts across every security module — the specifics differ, the shape does not.
Stage 1 — Discovery
A finding enters NxSAM by scanner integration, by report upload, or by hand.
What is decided here: its identity. The platform must determine whether this is something it has seen before or something new. For network VA this is the vulnerability key; for application findings it is the tool's identifier plus asset context.
Where it goes wrong:
| Symptom | Cause |
|---|---|
| Counts double after an import | Identity changed, so nothing matched the previous data |
| Findings reopen unexpectedly | Same cause, seen from the other side |
| Two distinct findings merged into one | Key parts coerced to the same value (blank port becomes 0) |
| Findings attached to the wrong asset | Asset identifier in the file differs from the one held |
Detail in the integrations reference.
Stage 2 — Approval
A discovered finding is not yet counted. Someone reviews it and approves it into the audit.
Why it exists: scanners report things that are not real. Approval is where a human accepts the finding as genuine before it starts consuming anyone's attention.
The support consequence: unapproved findings are visible inside the audit but absent from dashboards and posture counts. "The dashboard is missing findings I can see in the audit" is this stage, essentially every time.
At import, some findings may be auto-classified as false positives and never enter the open population at all. That is configuration, not data loss.
Stage 3 — SLA assignment
On approval the finding is given an SLA date derived from its severity.
What to know:
- The date is stored; the overdue state is computed live against today's date.
- Changing SLA configuration does not re-date existing findings.
- Shortening an SLA can push a large number of findings overdue immediately, because the comparison is against today.
- A finding with no SLA date is never overdue — and never compliant either. It is simply outside SLA reporting.
Stage 4 — Ownership and remediation
The finding becomes visible to whoever owns the asset, and moves through working statuses: New, Patch in progress, Patched.
The critical misunderstanding lives here. Patched does not close a finding. It records that work was done. The finding remains open, keeps ageing, and keeps counting.
Where it goes wrong:
| Symptom | Cause |
|---|---|
| "We fixed it but it still shows open" | Marked Patched, not Validated |
| "The owner cannot see it" | Asset ownership, not role |
| "It is assigned to someone who left" | Ownership follows the asset, not the person |
Stage 5 — Validation and closure
Someone confirms the fix actually worked and sets the finding to Validated. Only this — or Exception Handled — stops the clock.
Statuses that look like closure and are not: Risk accepted, Not Applicable, Duplicate, Expired. All four continue to count as open. See the counting rules.
Stage 6 — Reopening
A validated finding seen again by a later scan returns as Reopen.
What it means: the weakness is present again. Usually a rolled-back patch, a host rebuilt from an old image, or configuration drift.
What to check when it looks wrong: whether identity changed. If the vulnerability key was reconfigured, findings can appear to reopen en masse when nothing on the systems changed at all. A sudden reopen spike with no corresponding infrastructure event is an identity question, not a security one.
The alternative path: accepting the risk
At any point after approval, a deviation may be raised to accept the risk for a fixed period. It is a dated decision with an approver, not a way of removing the finding.
The finding stays open throughout. When the deviation expires the finding continues exactly as before — it was never closed. See the deviations reference.
Diagnostic summary
Given a symptom, the stage to examine first:
| Reported symptom | Stage |
|---|---|
| Counts jumped or doubled | 1 — identity |
| Findings visible in audit, missing from dashboard | 2 — approval |
| Overdue figures changed with no data edit | 3 — SLA computed live |
| "We fixed it but it is still open" | 4/5 — Patched is not Validated |
| Sudden mass reopen | 6, then back to 1 — identity changed |
| Accepted risk still counting as open | Alternative path — by design |
Counting rules, limitations and checks
Most escalations that reach the support team are not faults. They are one of the rules on this page working exactly as designed, in a way the screen does not explain.
Everything here was read out of the application code and the status master tables, not inferred from the interface. Where a rule is configurable, the setting is named.
The single most common question
"The dashboard count doesn't match the number of rows in the table."
This is almost always one of the first two rules below. Check them before treating it as a defect.
1. Only two statuses actually close a vulnerability
A vulnerability counts as open unless its status is flagged as a closed type. Of the fourteen statuses shipped in the status master, only two carry that flag:
| Status | Counts as closed? |
|---|---|
| Validated | Yes |
| Exception Handled | Yes |
| New · Patched · Patch in progress · Not Patched · To be patched · On hold · Reopen | No |
| Risk accepted | No |
| Not Applicable | No |
| Duplicate | No |
| Expired | No |
The four in bold are the ones that surprise people. Marking a finding Risk accepted, Not Applicable or Duplicate does not remove it from open counts, SLA ageing, or overdue reporting. It stays open until someone sets it to Validated (or Exception Handled).
Check before escalating
Filter the list by status and compare. If the "missing" rows are Risk accepted, Duplicate, Not Applicable or Expired, the count is correct and the expectation is what needs adjusting.
Why it is built this way. Accepting a risk is a decision about treatment, not a statement that the weakness is gone. It remains a live exposure and continues to be reported as one. Closure is reserved for evidence-backed validation.
This mapping is configuration, not a fixed rule. Which statuses count as closed is set per deployment on the status master (Configurations → System). If a customer's counts behave differently from this table, check their configured statuses before anything else.
2. A finding must be approved before it counts
Open is not simply "not closed". A vulnerability is counted as open only when both are true:
- its issue status is Approved, and
- its client status is not a closed type (rule 1).
Findings still sitting at Saved or Submitted — uploaded or drafted, but not yet approved into the audit — appear in working lists but are absent from posture counts and dashboards.
What this looks like in practice: an analyst uploads a scan, sees 400 findings in the audit, and reports that the dashboard "lost" 60 of them. Those 60 are almost always awaiting approval.
3. SLA overdue is calculated live, never stored
Overdue status is evaluated at query time by comparing today's date against the vulnerability's SLA expiry date. Nothing is written to the record when an item breaches.
Three consequences worth knowing:
- Items become overdue with no data change. A report run yesterday and the same report run today can differ with nobody touching anything. This is correct behaviour, and a frequent "the report changed by itself" ticket.
- Overdue counts cannot be back-dated. Asking "how many were overdue last month" is not answerable from the live flag; it needs the historical tables.
- A record with no SLA expiry date is never overdue. It is not counted as compliant either — it is simply outside SLA reporting. If a set of findings never appears in overdue figures, check whether they have an expiry date at all.
4. The "considered" gate can hide whole audits from posture
Each audit carries a considered on date. Findings from an audit that has not been stamped as considered can be excluded from posture reporting even though the audit and its findings are perfectly visible in their own module.
The stamp is applied only when both conditions hold:
- Consider Only Final State Audits As Active (AppSec / API) is switched on (Configurations → System → System Settings). It is off by default, and
- the audit is moved into a status marked as a final state.
So on a default deployment this gate is inactive and every audit contributes. On a deployment where it has been switched on, an audit sitting in Work in progress or Review Requested contributes nothing to posture until it reaches a final state.
Check this before investigating missing data
If a customer reports that a whole audit's findings are absent from dashboards while visible in the module, check this setting first. It is a one-line answer that otherwise costs hours.
5. Audit status closure is separate from vulnerability closure
Audit statuses carry their own closed type flag, set on the audit status master, and it is independent of vulnerability status. As shipped, Completed and Aborted are closed audit states; Not started, Work in progress, Hold, Review Requested, Changes Requested, Reverted, PMO Verified, Report Published, Requested and Approved are not.
Two independent notions of "closed" exist, and they do not imply one another:
- Closing an audit does not close its vulnerabilities.
- Closing every vulnerability does not close the audit.
Note in particular that Report Published and PMO Verified are not closed audit states. An audit whose report has been issued is still open as far as the platform is concerned.
6. Deleted records are hidden, not removed
Deleting a record marks it deleted and hides it from the lists rather than removing it. Anything still holding a reference to a deleted record continues to resolve it.
The practical consequence: a deleted asset, project or user can still be named on historical findings, in audit history, and in older reports. This is intended — deleting a record must not rewrite the past — but it does mean "I deleted it, why is it still showing" is expected behaviour on historical views.
Quick triage order
When counts do not reconcile, work down this list:
- Are the "missing" rows Risk accepted / Duplicate / Not Applicable / Expired? → rule 1
- Are they awaiting approval? → rule 2
- Did the figure change with no data edit? → rule 3
- Is a whole audit missing from posture? → rule 4
- Is the customer conflating audit closure with vulnerability closure? → rule 5
- Does a deleted record still appear on history? → rule 6
Error scenarios and what they actually mean
Messages a user is likely to report, what causes each, and what to check. Message text is taken from the application code; wording may differ slightly by version.
Upload and import
"A scan is scheduled, so cannot initiate new scan / upload."
Cause. A scan is already queued or running for this audit. The platform refuses a second concurrent upload rather than interleaving two result sets, which would corrupt matching.
Check. Look at the scan or upload queue for that audit. Either it is genuinely running, or a previous run failed without clearing its state.
Resolution. Wait for the running job, or clear the stalled one. Do not work around it by creating a second audit — that splits the finding history for the same asset.
"Audit Document can not be uploaded for the current audit status"
Cause. The audit is in a status that does not accept documents. Uploads are gated by audit status by design, so evidence cannot be added to an audit that has been completed or aborted.
Check. The audit's current status.
Resolution. Move the audit to a status that accepts uploads, or attach the evidence to the correct audit. If the audit was closed prematurely, reopening it is the honest fix — attaching evidence elsewhere makes the record misleading.
Missing mandatory columns
Cause. The import validates that required headers are present before processing, and
rejects the file outright if any are missing. For Qualys imports the plugin identifier
(qid) is one of them.
Check. Open the file and compare its header row against the expected columns. The usual causes are an export template change, a different export format from the same tool, or a file edited in a spreadsheet that dropped or renamed a column.
Resolution. Re-export using the correct template. Do not hand-add a missing column with invented values — see the vulnerability-key behaviour in the integrations reference; a fabricated key part silently changes what matches what.
Unmapped assets in an upload
Cause. The file references hosts or applications that do not exist in NxSAM, or that exist under a different identifier.
Check. Whether the assets exist at all, and whether the identifier in the file matches the identifier NxSAM holds — an IP against a hostname, a URL with a trailing slash, a different case.
Resolution. Create or correct the assets first, then re-upload. Findings for unmapped assets are not silently discarded, but they cannot be filed correctly until the asset exists.
"Duplicate severities" / "Duplicate control name in file"
Cause. The uploaded file contains the same key twice. The import refuses rather than guessing which row wins.
Check. The file itself, not NxSAM. Duplicates usually arrive from concatenating exports or from a spreadsheet copy.
Resolution. De-duplicate the file. Which duplicate is correct is a judgement the platform should not make on the customer's behalf.
Reports and background work
"Unable to connect with Queue server"
Cause. The message broker is unreachable. Report generation, imports and several status transitions publish to a queue; without it they cannot be accepted.
Check. Whether the broker is running, and whether the application server can reach it.
Resolution. Restart or restore the broker. Note that anything submitted while it was down was refused rather than queued — those requests need resubmitting; they will not drain automatically.
This error is not about the report
Users report it as "my report failed". Nothing is wrong with the report or the data — the request could not be accepted. Regenerating once the broker is healthy is all that is required.
A report never arrives
Cause. Usually queued behind other work rather than failed.
Check. Process Manager, to see whether the job is queued, running, or errored.
Resolution. If queued, wait. If errored, the error is on the job. If absent entirely, the submission never reached the queue — see the broker error above.
Integrations
"Unable to connect to "
Cause. The endpoint is unreachable, credentials are rejected, or a proxy is required and not configured.
Check, in this order:
- Can the NxSAM server reach the endpoint at all? Network before credentials.
- Are the credentials valid, and is the account API-enabled rather than interactive-only?
- Does this deployment need a proxy for outbound traffic?
Connects successfully, imports nothing
Not an error message, and the most commonly misdiagnosed condition. The connection is fine and the account simply cannot see anything in scope.
Check. What the service account can see in the source tool, signing in as that account. Almost always the account exists and authenticates but was never granted access to the target scope.
Access and permissions
"Permission denied" / a module missing from the sidebar
Cause. Two different mechanisms, and they need distinguishing before anything is changed:
| Symptom | Mechanism | Fix |
|---|---|---|
| Module absent from the sidebar | Role does not include it | Role change |
| Module present but empty | No assets owned or assigned | Ownership or mapping change |
Check. Whether the user can reach the screen at all. That single question separates the two.
Permissions are resolved at sign-in
A permission change may not take effect until the user signs out and back in. Before escalating "the permission change did not work", have them re-authenticate.
"Invalid credentials" at sign-in
Cause. Wrong password, a locked account, or — where corporate sign-on is configured — a directory problem rather than an NxSAM one.
Check. Whether the deployment uses directory authentication. If it does, NxSAM does not hold the password at all and the investigation belongs with the directory.
Deviations
"Invalid deviation request" / "Invalid number of approver levels"
Cause. The request does not satisfy the configured approval workflow — commonly a required field is absent, or the approval configuration expects a number of levels that the request does not provide.
Check. The approval configuration for the severity in question, and whether it was changed after the request was raised. Routing is fixed at request time, so a request raised under an older configuration can conflict with a newer one.
A general principle
Most NxSAM errors are refusals rather than faults: the platform declines an operation that would produce inconsistent data. Before treating a message as a defect, establish what it was protecting against. "Cannot upload while a scan is running" is not a limitation to be worked around — it is preventing two result sets from being interleaved.
How NxSAM Works: find the right screen
Every screen in this module, what each one is for, and where it lives. Use it to find the right screen quickly, and to confirm you are on the one a colleague means — several screens in this product have similar names and different jobs.
Screenshots come from a demonstration data set, so the figures are illustrative. Click any screenshot to open it at full resolution.
Change Password
Where a signed-in user changes their own password.
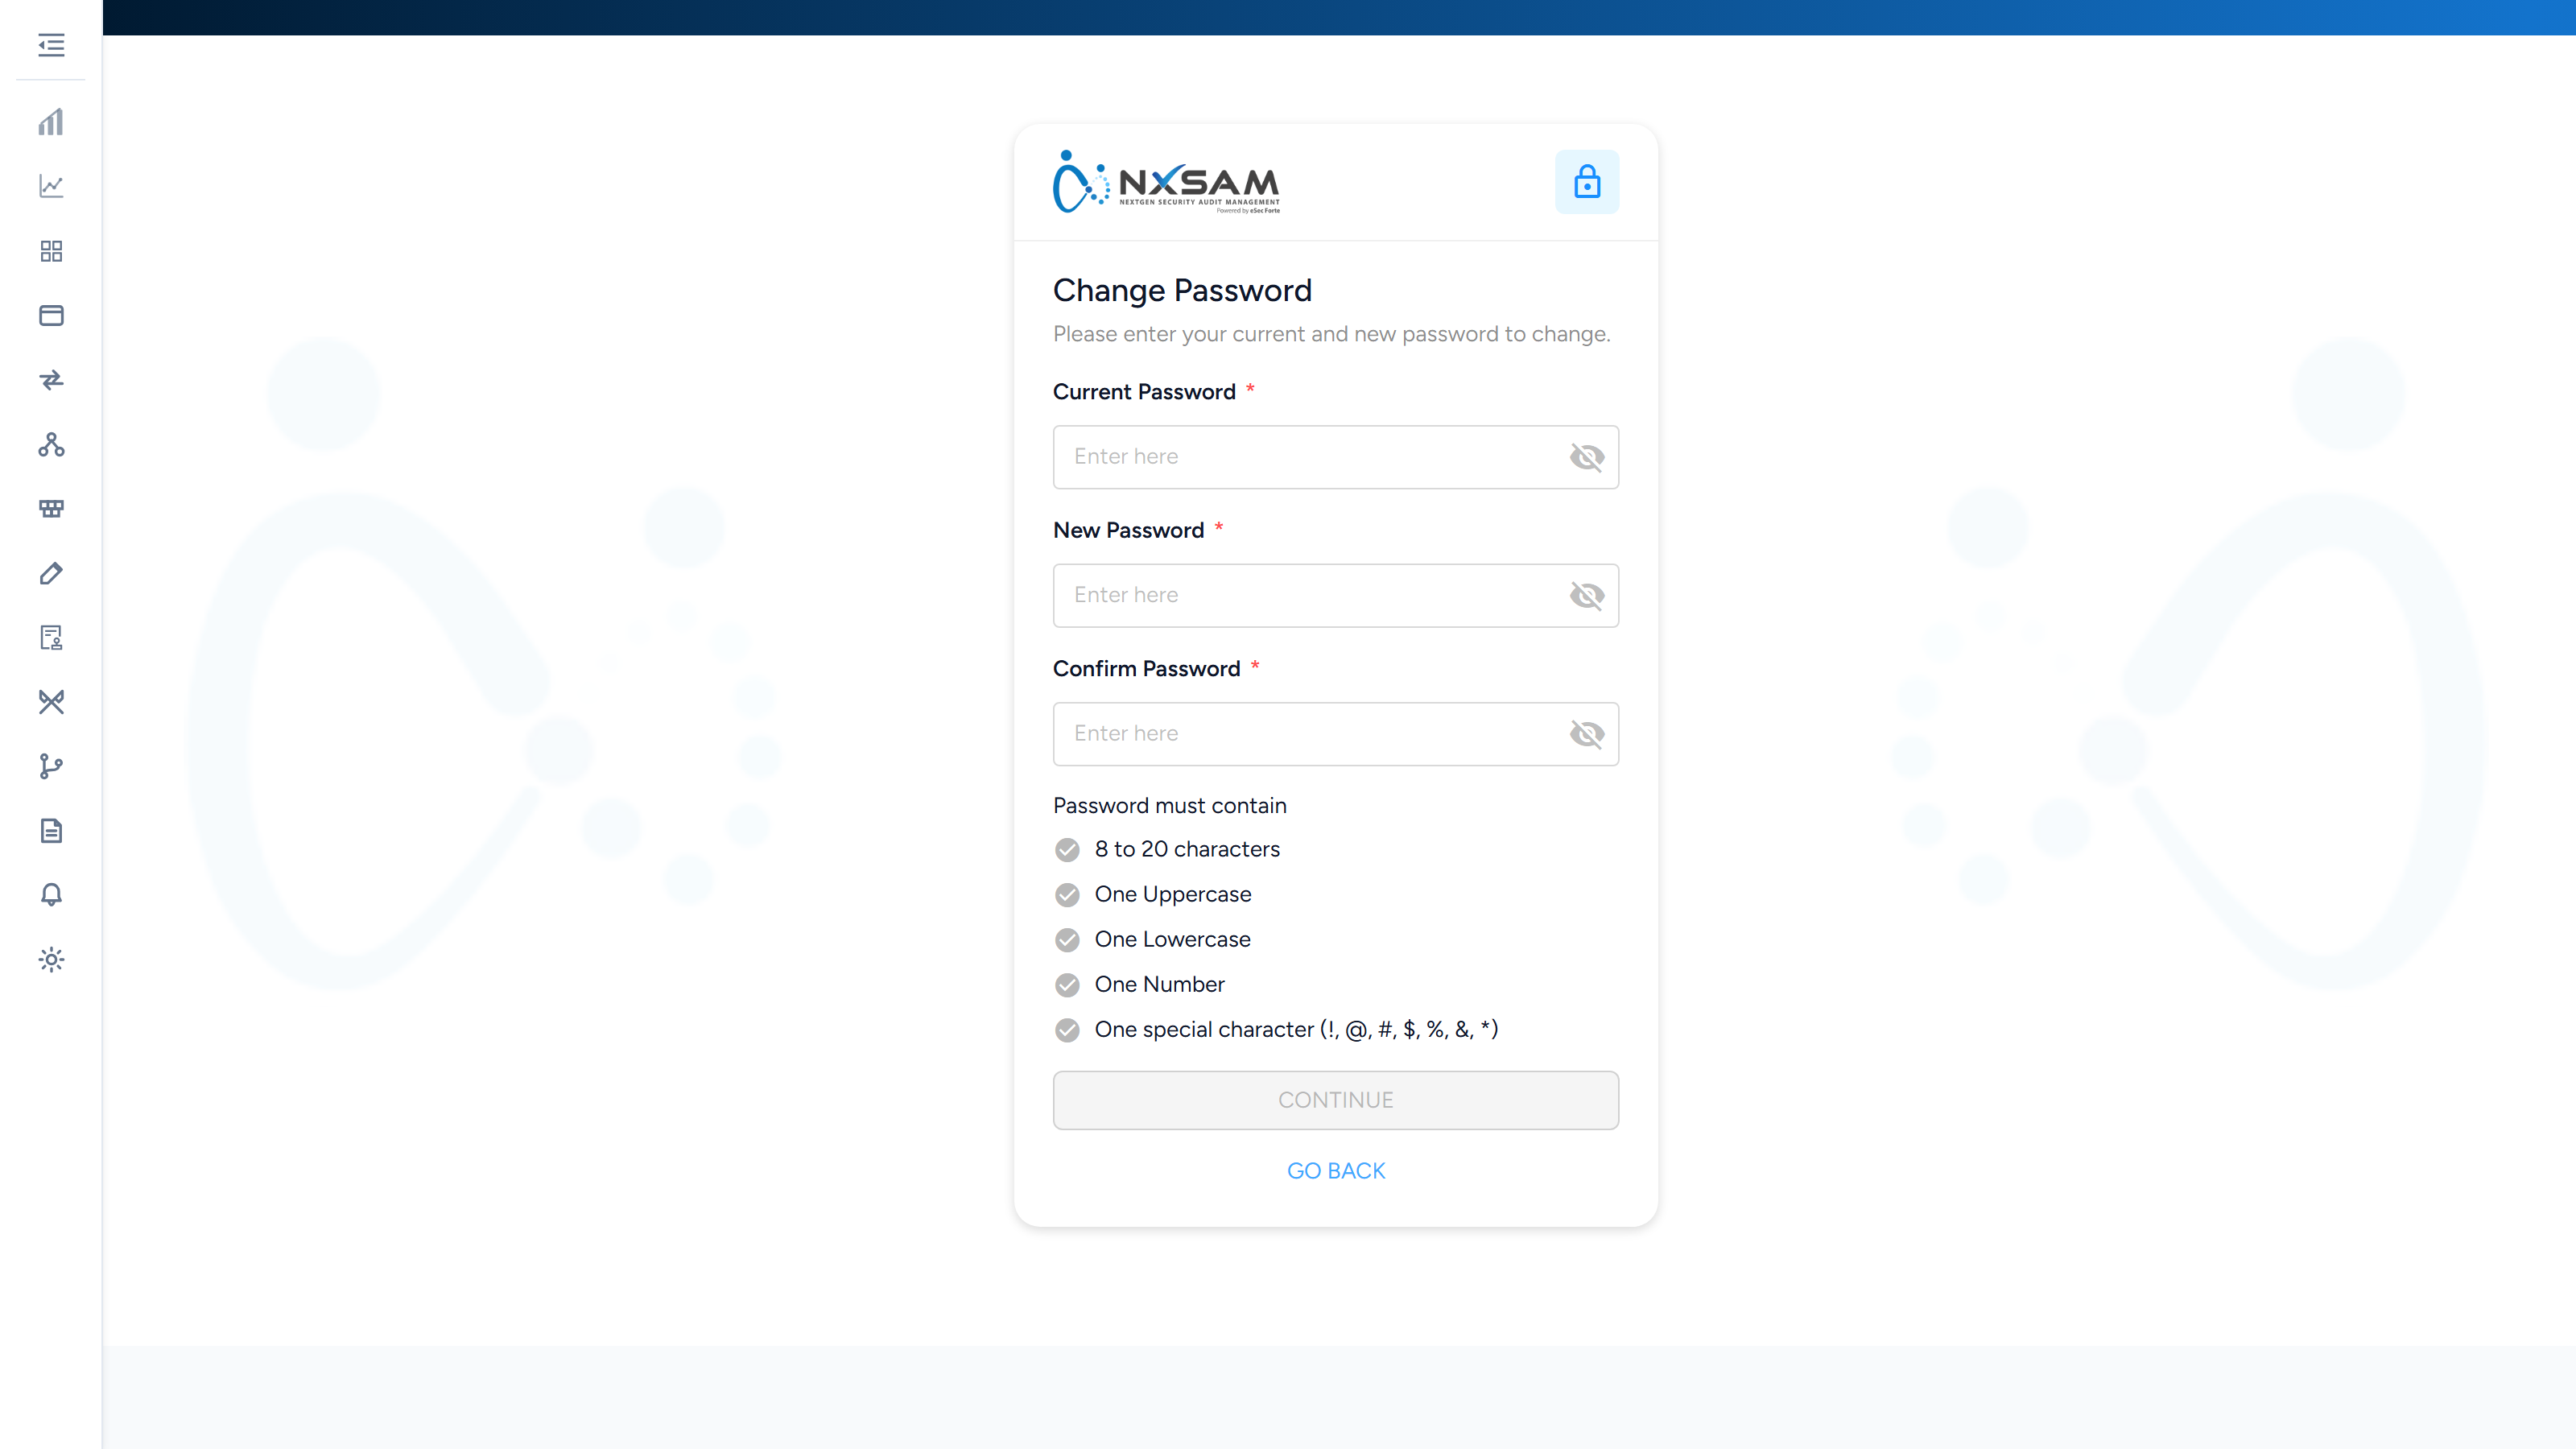
Notifications
In-platform alerts — SLA warnings, completed audits, finished imports.
Analytics Dashboard
Analytics Dashboard
The Analytics Dashboard is the cross-module view of your security posture. Where each security module shows you its own findings, this shows everything at once — and lets you slice it.
The two halves
| Dashboard | Charts and figures. Built for understanding the shape of your posture. |
| Live Data | The underlying records as a table, filterable and exportable. Built for working with specifics. |
They share the same filters, so a shape you notice in a chart can be taken straight through to the rows behind it.
Reading the dashboard
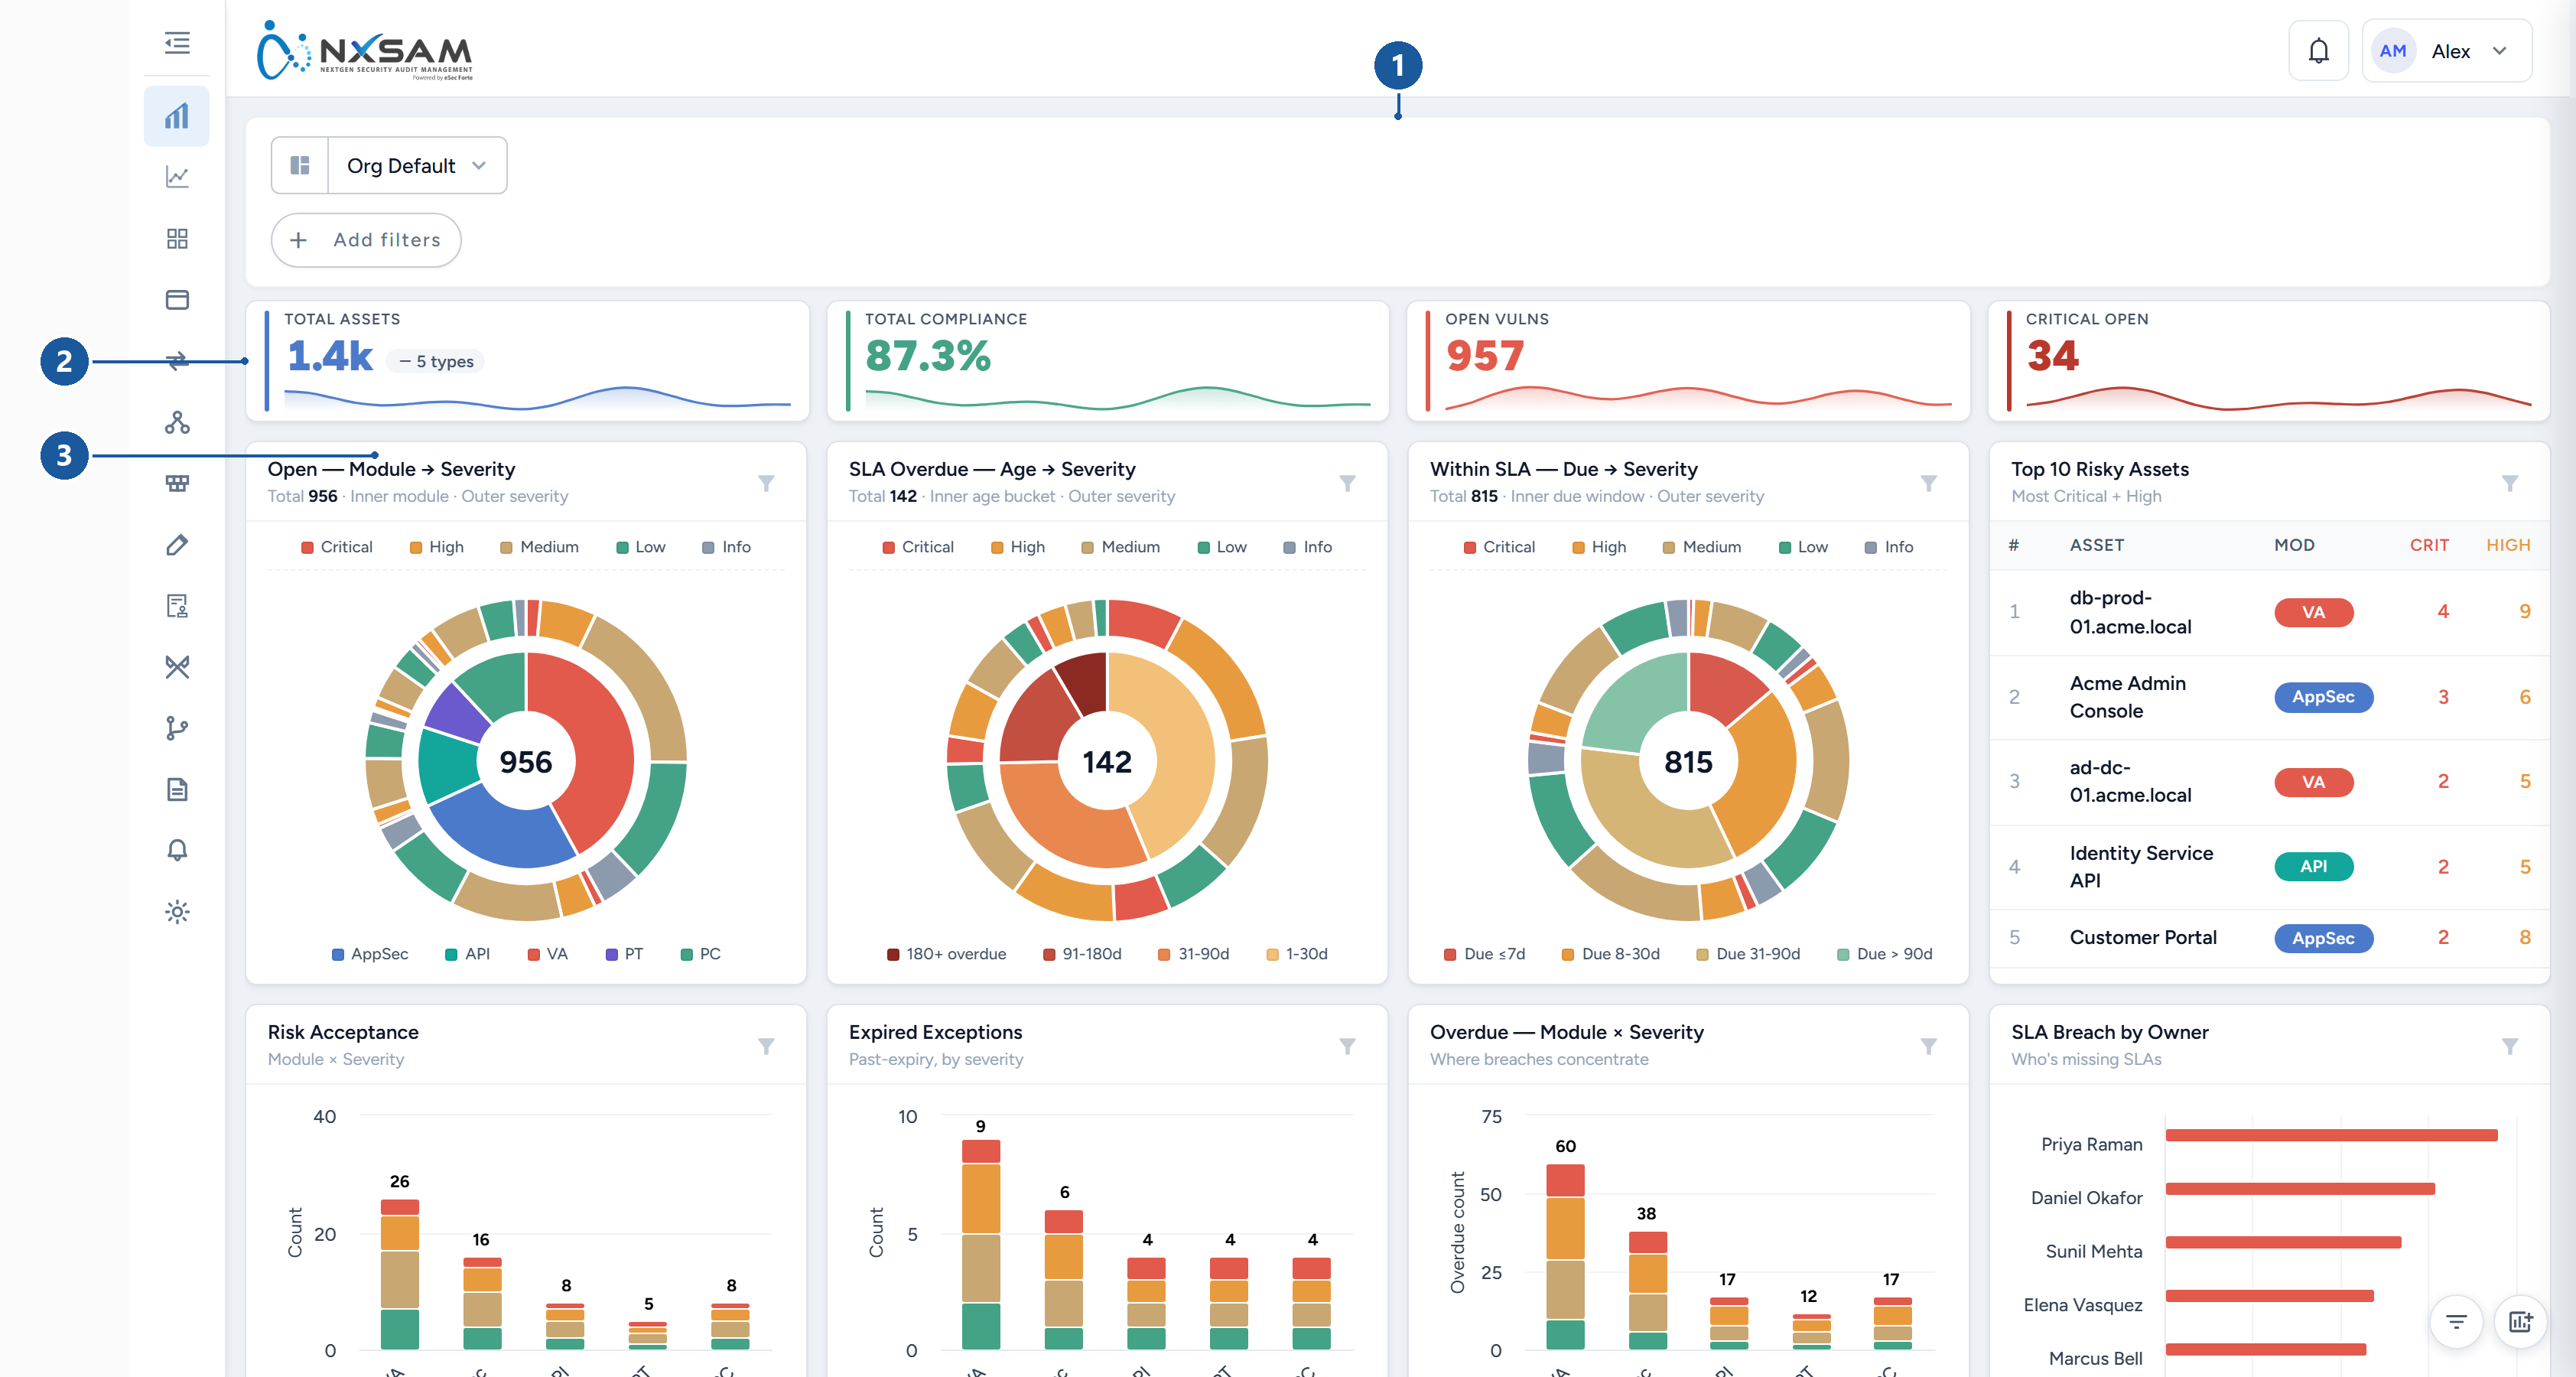
1 global filters · 2 headline figures · 3 one widget, with its own filter
The top row carries headline figures — total assets, open vulnerabilities, critical open, overall compliance. These are the numbers to quote.
Below them, widgets break the same population down by different dimensions: severity, module, age, SLA state, trend over time. Each widget answers a different question:
- Severity breakdowns — how bad is what we have?
- Age and SLA widgets — how long have we had it, and are we late?
- Trend widgets — are we getting better or worse?
- Top-N widgets — where should attention go first?
A dashboard figure and a module count can differ legitimately
The dashboard applies its own filters and counting rules. Before treating a discrepancy as an error, check the filters at the top — a pinned filter from an earlier session is the usual explanation.
Filtering
Filters sit along the top and apply to everything below. They combine, so narrowing by module and severity together shows only findings matching both.
Filters can be pinned, which keeps them applied. This is convenient and also the most common cause of "the numbers look wrong" — a pinned filter persists and is easy to forget. If a figure looks unexpectedly small, check the filter bar first.
Customising the layout
Almost nothing on this dashboard is fixed. You can rearrange and resize widgets, hide the ones you do not use, build charts the product does not supply, exclude severities across every widget at once, and save the result as a named profile to reuse or share.
Layouts are personal: changing yours does not change what anyone else sees, so two people comparing "the dashboard" may be looking at different arrangements of the same data — or at different profiles entirely.
Build your own dashboard covers all of it: edit mode and the grid, the widget list, the chart builder's types, metrics and groupings, profiles and sharing, and the settings that apply everywhere.
Live Data
Live Data shows the records behind the charts. It is where to go when you need to know which findings rather than how many.
- Columns can be chosen, so the table shows the fields you care about.
- Findings can be viewed as open, closed, or all.
- The result can be exported.
Large exports are prepared in the background
A large export is not produced instantly. It is queued, prepared, and made available when ready — so a moment's wait on a big export is expected rather than a failure.
When figures move without anyone changing anything
Two legitimate causes, worth knowing before investigating:
- SLA states change as dates pass. Something within SLA yesterday can be overdue today with no edit at all.
- Ageing moves findings between age bands for the same reason.
Both are the calendar, not the data.
Custom charts
Beyond the supplied widgets you can build your own, and each custom chart card carries three actions:
| Action | What it does |
|---|---|
| Edit | Change what the chart measures and how it is drawn |
| Refresh | Re-runs that chart's query alone |
| Delete | Removes the chart from the dashboard |
Refresh is the useful diagnostic. If one chart looks stale while the rest of the dashboard is current, refreshing it separates a problem with that chart's own query from a problem with the warehouse sync feeding everything.
Build your own dashboard
The Analytics Dashboard ships with a set of widgets, and almost none of what you see is fixed. You can rearrange it, hide what you do not use, build charts the product does not supply, save the result as a named profile and share that profile with colleagues.
This page covers all of it, in the order you would actually do it.
1 The profile selector and the global filter bar · 2 Headline figures · 3 One widget, with its own filter control
The four things you can change, and who they affect
They are separate, and confusing them is the usual cause of "my dashboard looks different from yours":
| What | Scope | Where |
|---|---|---|
| Global filters | This session, until cleared or saved into a profile | The filter bar |
| Layout — position, size, which widgets show | Your profile | Edit dashboard layout |
| Per-widget filters | The widget, within your profile | The funnel icon on a widget |
| Excluded severities | Every widget at once, for you | Dashboard settings |
A profile carries the first three together. Sharing a profile shares all of them.
Rearranging the layout
Open Edit dashboard layout (the toolbar at the bottom right of the dashboard). The grid appears and the widgets become movable — outside edit mode they are deliberately fixed, so you cannot nudge a widget out of place by accident while reading.
While in edit mode:
- Move a widget by dragging its header. Dragging the chart itself does nothing — that is reserved for interacting with the chart.
- Resize from any edge or corner.
- Widgets swap rather than push: drag one onto another and they exchange places. Nothing below shuffles unexpectedly.
- The grid is 24 columns wide with a fixed row height, so widget sizes are consistent rather than arbitrary — a half-width widget is exactly half-width on every screen.
The edit toolbar runs across the top of the grid:
| Button | What it does |
|---|---|
| Add chart | Opens the custom chart builder, described below |
| Widgets | The full widget list with a switch each — hide what you do not use rather than working around it |
| Compact | Pulls every widget upward to close empty rows left by hiding or resizing |
| Reset to defaults | Back to the factory arrangement, discarding your changes |
| Discard | Leaves edit mode and restores what was there when you entered it |
| Save & Exit | Keeps the arrangement and returns to the normal dashboard |
Nothing is saved until you press Save & Exit, so experimenting is safe.
Edit is only offered on a profile you own
A profile shared with you is read-only. To rearrange it, save your own copy first (Save as new profile…) — you then own the copy and can edit freely.
Building a custom chart
Add custom chart opens the builder. A chart is three decisions — what to measure, how to group it, and how to draw it — and the preview updates as you make them.
1. Choose a chart type
The type decides how many groupings you must supply, so pick it first.
| Type | Groupings | Notes |
|---|---|---|
| KPI / single value | none | One number. The only type that can show PC compliance % |
| Bar, Pie, Donut | exactly 1 | The straightforward comparisons |
| Stacked bar, Grouped bar | exactly 2 | Stacked answers "of this total, how much is X"; grouped compares side by side |
| Line, Area | 1 or 2 | The two types that accept a time grouping — use these for trends |
| Matrix, Heatmap | exactly 2 | Where two dimensions cross; heatmap shades by value |
| Table | up to 2 | When the numbers matter more than the shape. Returns far more rows than a chart |
2. Choose what to measure
| Metric | Available on | Notes |
|---|---|---|
| Issue count | Open and closed | The default |
| Affected assets | Open and closed | Counts assets, not findings — a host with nine findings counts once |
| Avg vuln score, Total vuln score | Open and closed | Weighted views, for when a count treats a critical and an informational alike |
| Overdue count, Overdue % | Open only | Past its SLA date. A closed finding has no SLA state, which is why these are open-only |
| No-SLA count | Open only | Findings with no SLA date at all — usually the more urgent gap |
| Within-SLA count | Open only | The complement of overdue |
| MTTR (days) | Closed only | Mean time to remediate. Groupable by severity or module only, and cannot be shown over time |
| PC compliance % | Open only | KPI type only |
Data scope — open or closed issues — is a separate choice, and it constrains the metric list: pick closed and the SLA metrics disappear, because they do not exist for a closed finding.
3. Choose the groupings
Dimensions are the fields the chart groups by: severity, module, status, asset, owner, project, business unit, source tool, and your own asset properties — anything you have defined as a property is groupable here, which is what makes a data-classification or hosting-region breakdown possible without any development.
For a time-based chart (line, area, table) you also choose:
- Time field — Reported date (when the finding arrived) or Closure date (when it was resolved). A trend of closures is a different question from a trend of discoveries.
- Bucket — day, week or month.
4. Presentation
| Control | Effect |
|---|---|
| Title | The widget's heading |
| Sort, Limit | Order and how many groups to keep — a "top 10" is a limit of 10 |
| Stacking | Normal or percentage, on the stacked types |
| Orientation | Vertical or horizontal bars. Horizontal reads better with long labels |
| Show legend, Legend position | |
| Show value labels, Label format, Label placement | Numbers printed on the marks themselves |
| Donut hole | The size of the hole, on donut charts |
| Color palette | Default, cool, warm, vivid or mono. Spelled the American way on screen, so it is spelled that way here |
Widget filters on the same dialog restrict this chart alone, independently of the dashboard's global filters — a chart showing only Critical findings while the rest of the dashboard shows everything.
The Preview is live. If it says Select a dimension to see a preview, the chart type you chose needs more groupings than you have supplied.
Saved charts appear as widgets on your dashboard, and can be moved and resized like any other. Each carries Edit, Refresh and Delete on its card.
Profiles: saving and sharing a dashboard
A profile is the whole dashboard as you arranged it — layout, hidden widgets, custom charts, per-widget filters and the global filter selection.
All three live in the profile menu, opened from the profile name at the top left:
| Menu item | What it does |
|---|---|
| Save as new profile… | Creates a named profile from what is on screen now — filter pins, values and widget layout. Your other profiles are not affected |
| Manage profiles… | Rename, set one as your default, or delete |
| Share current profile… | Makes the profile available to others. Offered only on a profile you own |
Sharing offers three levels:
- Private — only you. The default.
- Specific people — chosen by name; you can see who currently has access.
- Anyone in the organisation — everyone who can sign in.
A profile you receive is view-only. You can use it, filter within it, and save your own copy, but you cannot alter the original — so a shared executive view stays as its author intended.
Custom charts travel with the profile
Sharing a profile shares the custom charts on it. Recipients see them as read-only widgets. If a chart matters to a team, sharing the profile is how it reaches them.
Settings that apply to every widget
Dashboard settings holds options that cut across the whole dashboard rather than one widget. The significant one is Severity exclusions: severities excluded here are removed from every widget at once.
This is how a team that treats Informational findings as noise gets a dashboard that matches how they work. It is also worth knowing before you compare totals with someone else — an excluded severity is not shown anywhere, including in the headline figures, so two dashboards can legitimately disagree.
When you and a colleague see different numbers
In order of likelihood:
- A pinned global filter on one of you. The commonest by far.
- Different profiles — including the case where one of you is on a shared profile and the other on their own.
- A per-widget filter on the widget being compared, which the global filter bar does not show.
- Different severity exclusions in dashboard settings.
- A stale widget — press Refresh on the card before assuming the data is wrong.
Work with Live Data
Live Data is the row-level list behind every dashboard widget — one line per finding, across every module at once. Clicking through from a chart lands you here with that chart's slice already applied.
Like the dashboard, almost none of it is fixed: you choose the columns and their order, build filters the product does not ship, save the arrangement onto a profile, and export exactly the columns you need under headings you choose.
Reading the header
The subtitle under the title reports how many rows matched and how long the query took. Both are worth a glance: a row count that did not change after you applied a filter usually means the filter matched everything, and a query time climbing into seconds is the signal to narrow the range before exporting.
Open · Closed · All is the first decision and the widest one. Open is the default. It is a genuine change of population, not a filter on top of one — closed findings have no SLA state, so the SLA column and the overdue colouring are meaningful only on Open.
Choosing the columns
Columns opens a two-panel picker. The left panel is what you have selected, in the order they will appear; the right is everything available, grouped.
- Reorder with the up and down arrows beside each selected column. The number to the left is its position.
- Remove with the cross; add by clicking a chip on the right.
- Reset to default returns the standard eight.
The picker groups what you can add into Standard — the product's own catalog — and Asset properties. The standard catalog, arranged here by what each column tells you:
| Columns | |
|---|---|
| Identity | Vuln ID, Plugin / Master ID, CVE |
| Where it lives | Client, Project, Asset Type, Asset URL, Bifurcation Type, Port, Protocol, Technology, Instance |
| Where it came from | Module, Tool, Network Type, Audit Type, Audit, Audit Category, Auditor, Audit Completed |
| Risk and rating | Risk (legacy), Risk Rating, Policy, Posture |
| Lifecycle | Open/Closed, Discovered, Risk Accepted On, Exception Expires, Synced At |
The default set is Severity, Finding, Asset / Host, Source, Status, Age, SLA Due and Risk Score, which is why those eight do not appear above.
Asset properties is the group worth knowing about. Any property your organisation has defined — data classification, hosting region, business criticality, owning team — becomes a column here under its own name, with no development and no request to us.
Not every column can be sorted
A sortable heading carries a sort control. The rest are display-only, because sorting them would mean ordering the whole result set rather than the page you can see. Sort is available on severity, finding title, age, SLA due date, discovery date, legacy risk score, client, project, tool and vulnerability ID.
Filtering: four different mechanisms
They stack, and knowing which is which saves a lot of confusion about why a list is not what you expected.
| Mechanism | Where | Lives how long |
|---|---|---|
| Search | The search box | Until you clear it |
| Pinned quick filters | The chips above the search box | Saved on your profile |
| Ad-hoc conditions | Add filter | This session only — deliberately not saved |
| Date ranges | Date filters | Until cleared |
Search
One box across asset, host or IP, project, client, CVE, plugin and finding title. Press Enter or use Search.
Pinned quick filters
Two kinds of chip sit on the filter rail, and they behave differently:
- A property pin opens a value list when clicked — pick values, choose Include or Exclude, Apply. Use it for a field you filter on constantly but with different values each time.
- A value pin is a single click that applies one exact condition — "Severity: Critical", "Module ≠ Container". Use it for a filter you apply the same way every time.
Every value list shows how many findings carry each value beside it, so you can see whether a filter is worth applying before you apply it.
Include and Exclude are available everywhere. Exclude is the one people miss, and it is usually the shorter route: "everything except Informational" is one condition, where the include-form is four.
Applied filters appear as bubbles under the rail, each removable on its own, with Clear filters to drop them all.
Ad-hoc conditions
Add filter opens a builder for conditions you need once. Add as many rows as you like; each is a field, an Include/Exclude choice, and either values ticked from a list or text to match.
The field's type decides which you get. Enumerable fields — severity, module, status, owner — give a searchable checkbox list with counts. Free-text fields give a contains box, where a comma separates several alternatives.
These are explicitly not saved. The dialog says so. If a condition proves useful enough to want again, pin it on the rail instead.
Date filters
Two ranges, each with a from and a to: Discovered (when the finding first arrived) and SLA Due. They answer different questions — "what appeared last quarter" versus "what falls due next month" — and combine freely.
Filter context
Filter context adds a second line under each row listing the fields you filtered on, with this row's values. It exists for the case where you filtered on something that is not one of your columns — asset owner, say — and want to see the matched value per row without adding a column. Fields already visible as a column are skipped, so the line never repeats what you can already read.
Drilling in from a widget
Arriving from a chart, the slice you clicked appears as chips above the table — Severity: Critical, Module: Network VA. Each has its own cross, and Clear all removes the set, which is how you widen from one bar to its whole chart without going back.
Click any row to open the detail drawer: the full finding grouped into Classification, Source & Audit, Location, Lifecycle, Risk and Asset properties, plus a Matched filters section at the top showing exactly why this row is in your list.
Profiles
The profile selector sits at the left of the filter rail and shows which profile you are on. The menu lists yours, marks the default, and tags each as Private, Shared or Public.
A profile carries your pinned filters, their default values, your column choices and your export configuration. Load Org Default returns to the organisation's standard arrangement, discarding your session's tweaks.
Ad-hoc changes are not saved automatically — the switcher says so. Column choices are the exception, and only on request: both column pickers offer Save as the default for this profile, which is offered only on a profile you own. A profile shared with you stays as its author arranged it.
Exporting
Export is a separate configuration from what is on screen, which is deliberate — the columns that make a readable screen and the columns that make a useful spreadsheet are rarely the same set.
The tune icon beside Columns opens the export picker. It works identically — select, order, reset — with one addition: each column has a free-text heading. Whatever you type becomes the heading in the CSV. Leave it blank to use the product's own label. This is how an export lands in a colleague's inbox already using their vocabulary rather than ours.
Export CSV then runs against your current filters, status choice and export columns.
Exports run in the background, and one at a time
An export does not hold the page. It is queued, and the Export panel beside the button reports its state — running, completed with a file size, or failed with the reason. Download from there. While one is running the button is disabled: a second export of a large result set would compete with the first for the same resources.
When the page says the warehouse is not available
Live Data reads from the analytics warehouse rather than the operational database, which is what lets it page through millions of findings. Two messages tell you it is not there:
- "Warehouse isn't connected" — no connection is configured. Administrators see a Configure Warehouse button; everyone else should raise it with their administrator.
- "Warehouse is unreachable" — configured, but the server did not answer. This is an infrastructure matter, not a settings one, and the only offered action is to return to the dashboard.
The rest of the platform is unaffected in both cases — the module screens read the operational database directly.
Analytics Dashboard: find the right screen
Every screen in this module, what each one is for, and where it lives. Use it to find the right screen quickly, and to confirm you are on the one a colleague means — several screens in this product have similar names and different jobs.
Screenshots come from a demonstration data set, so the figures are illustrative. Click any screenshot to open it at full resolution.
Live Data
The row-level data behind the analytics dashboard, filterable and exportable. Choosing columns, pinning filters, saving them onto a profile and configuring the export are all covered in Work with Live Data.
Analytics Dashboard: support reference
Internal. The customer-facing explanation is in the overview and the screen reference.
Analytics reads from a separate warehouse rather than from the modules directly. That single fact explains most of its tickets: the dashboard can be correct and still disagree with a module screen, because the two are looking at data of different ages.
The warehouse is a separate component
If the warehouse is not connected or not licensed, the dashboard shows its unavailable state. That is the accurate display, not a failure.
Where it is connected, figures are as current as the last sync. A module screen reads live data. A dashboard that is "wrong by a few hours" is usually right, and simply older.
Filters are global and they persist
The filter bar applies across every widget, and the selection survives navigation. A dashboard that looks empty or implausibly small is very often filtered from an earlier visit rather than broken.
Individual widgets can carry their own filter on top of the global one, so a single card disagreeing with its neighbours is normal and deliberate.
Shared profiles are read-only to everyone but their owner
A dashboard profile shared with a user shows its custom charts with Refresh only — Edit and Delete appear on charts the viewer owns.
This is deliberate: a shared profile is one definition seen by many people, so an edit would change what every viewer sees and a delete would remove it from all of them.
"I can't edit the chart" from a user looking at someone else's profile is the design. The remedies are to ask the owner, or to take an own copy of the profile.
Refresh is per chart
Refresh re-runs that chart's query alone. If one widget looks stale while the rest of the dashboard is current, that points at the chart's own query rather than at the warehouse sync — which is the distinction the control exists to make.
Live Data is configurable, so two users see different columns
The Live Data grid's columns and their order are a per-user choice. Two people describing "the same screen" can be looking at different columns, and an export follows the exporting user's configuration.
Establish which columns the caller has before comparing exports.
Risk score against risk rating
The engine's risk score (0–100, with a zone) is not the severity rating. A finding can be Critical severity with a moderate risk score, or the reverse, because the score weighs context — exposure, asset properties, likelihood — and the severity does not.
An estate with risk-score properties unconfigured produces a score that is severity with extra steps, and a "top risky assets" list that ranks nothing meaningfully.
What to collect before escalating
- Whether the warehouse is connected, and when it last synced.
- The global filter state — a screenshot of the filter bar, not a description.
- Whether the profile is the caller's own or shared with them.
- For a single wrong widget: whether Refresh on that chart changes it.
- For number disputes: the same figure from the module screen, with the time of each reading.
Assets
Assets
An asset is anything that can carry a weakness. Everything else in NxSAM hangs off the asset inventory: audits are run against assets, findings belong to assets, and reporting is grouped by them. If the inventory is wrong, everything built on it is wrong too.
The six kinds of asset
| Type | What it covers |
|---|---|
| Web Applications | Websites and web-based systems, identified by URL |
| Mobile Applications | iOS and Android apps, identified by package or bundle |
| Thick Clients | Installed desktop software |
| API Assets | Service endpoints assessed separately from the applications using them |
| Network Assets | Hosts, servers and network devices, identified by IP or hostname |
| Container Assets | Container images, identified by repository and tag |
The type determines which security module assesses it and which scanners can contribute findings. It is set when the asset is created and is not something to change casually — existing findings are attached to the asset as it was classified.
What an asset record carries
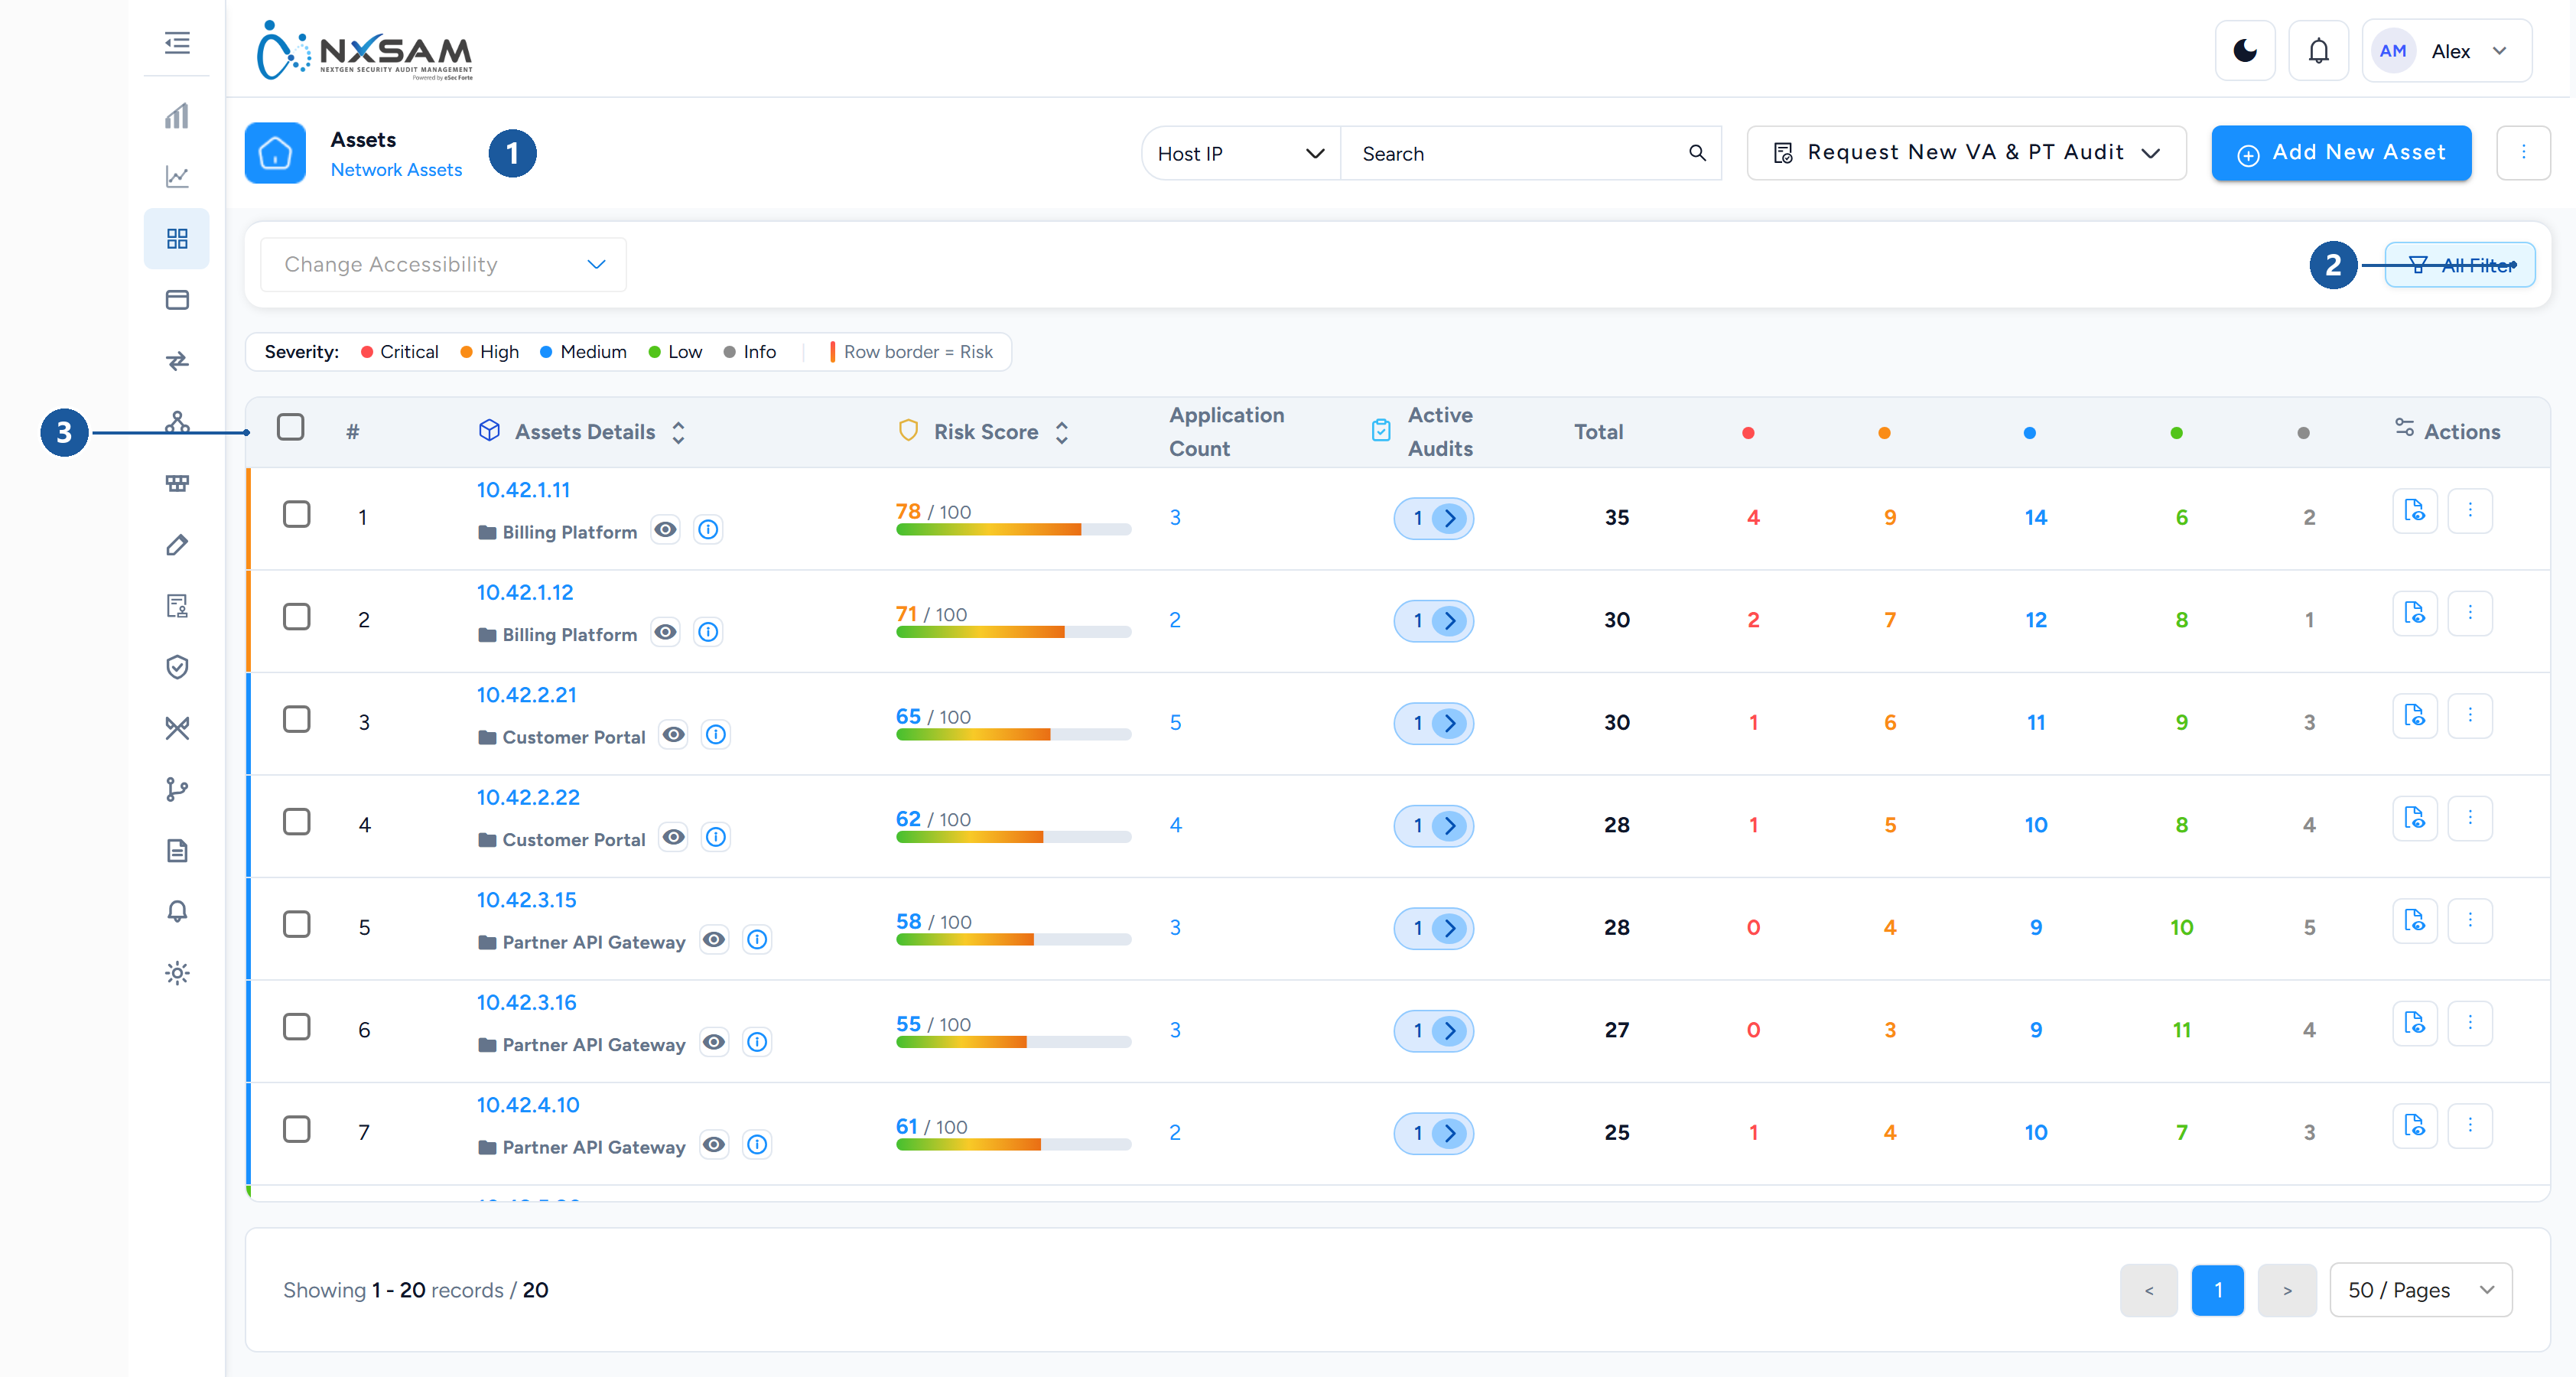
1 module and screen · 2 filters · 3 inventory columns
Beyond its name and identifier:
- Ownership — who is responsible for fixing things found on it. This drives who sees the asset and who is chased when findings age.
- Business context — organisation, business unit, project. Used for grouping and reporting rather than access.
- Environment — production, UAT, staging, development.
- Criticality — how much the business depends on it.
Criticality is not severity
Criticality describes the asset: how much damage its compromise would cause. Severity describes a finding: how serious that particular weakness is.
A Low severity finding on a Critical asset and a Critical finding on a Low asset are very different situations, which is why both are recorded.
Ownership determines visibility
NxSAM shows people the assets they are responsible for. An asset owner sees their own applications and the findings on them; a security analyst sees the estate.
This has a practical consequence worth knowing before raising a ticket: if a colleague cannot see an asset you can, that is ownership and permissions working as designed. The remedy is an ownership or role change, not a data fix.
Keeping the inventory current
Assets reach NxSAM three ways:
- Created directly, one at a time.
- Imported in bulk, from a spreadsheet.
- Synchronised from a source of truth such as a CMDB, where configured.
Where synchronisation is in place, treat the source system as authoritative and make changes there — a local edit will be overwritten on the next sync.
Decommissioning
Assets that no longer exist should be decommissioned rather than deleted. Decommissioning removes the asset from active tracking while preserving its history, so past findings and reports remain intelligible.
Deleting is a soft operation too — the record is hidden, not destroyed — which is why a deleted asset's name can still appear on historical findings and older reports.
Organising the inventory
Everything in NxSAM hangs off the asset inventory, so how it is organised decides how useful every report and dashboard downstream will be. These screens are where that structure is set.
The three levels of grouping
| Level | What it usually maps to |
|---|---|
| Organisation | A legal entity, or a major division |
| Business Unit | A department or function within it |
| Project | A programme of work, or a product |
Every asset sits under a project, which sits under a business unit, which sits under an organisation. Reports and dashboards group by these, and access can be scoped to them.

Set these up before importing assets in bulk
An import that references a project which does not exist yet either creates a placeholder or rejects the row. Creating the structure first avoids both, and avoids a cleanup pass later.
Asset owners
The Asset Owner Master holds the people who can be assigned as responsible for an asset. Ownership determines who sees an asset, and who is chased when findings on it approach their SLA.
An owner has to exist here before they can be assigned. Assigning ownership to someone who has left, and never revisiting it, is the most common cause of remediation reminders going nowhere.

Asset properties
Beyond the built-in fields, you can define asset properties of your own — a data classification, a hosting region, a compliance scope. These become filterable and groupable everywhere the asset appears.
Asset Property Management maps which properties apply to which asset types, so a property that only makes sense for network hosts does not appear on mobile applications.
Properties are worth defining early for the same reason as the grouping levels: they apply going forward, and backfilling them across an existing estate is manual.

Bringing assets in
| Screen | Use |
|---|---|
| Network asset upload | Bulk-create network assets from a file |
| Asset sync configuration | Connect a source of truth such as a CMDB |
| Network asset map | Relate network assets to the applications they host |
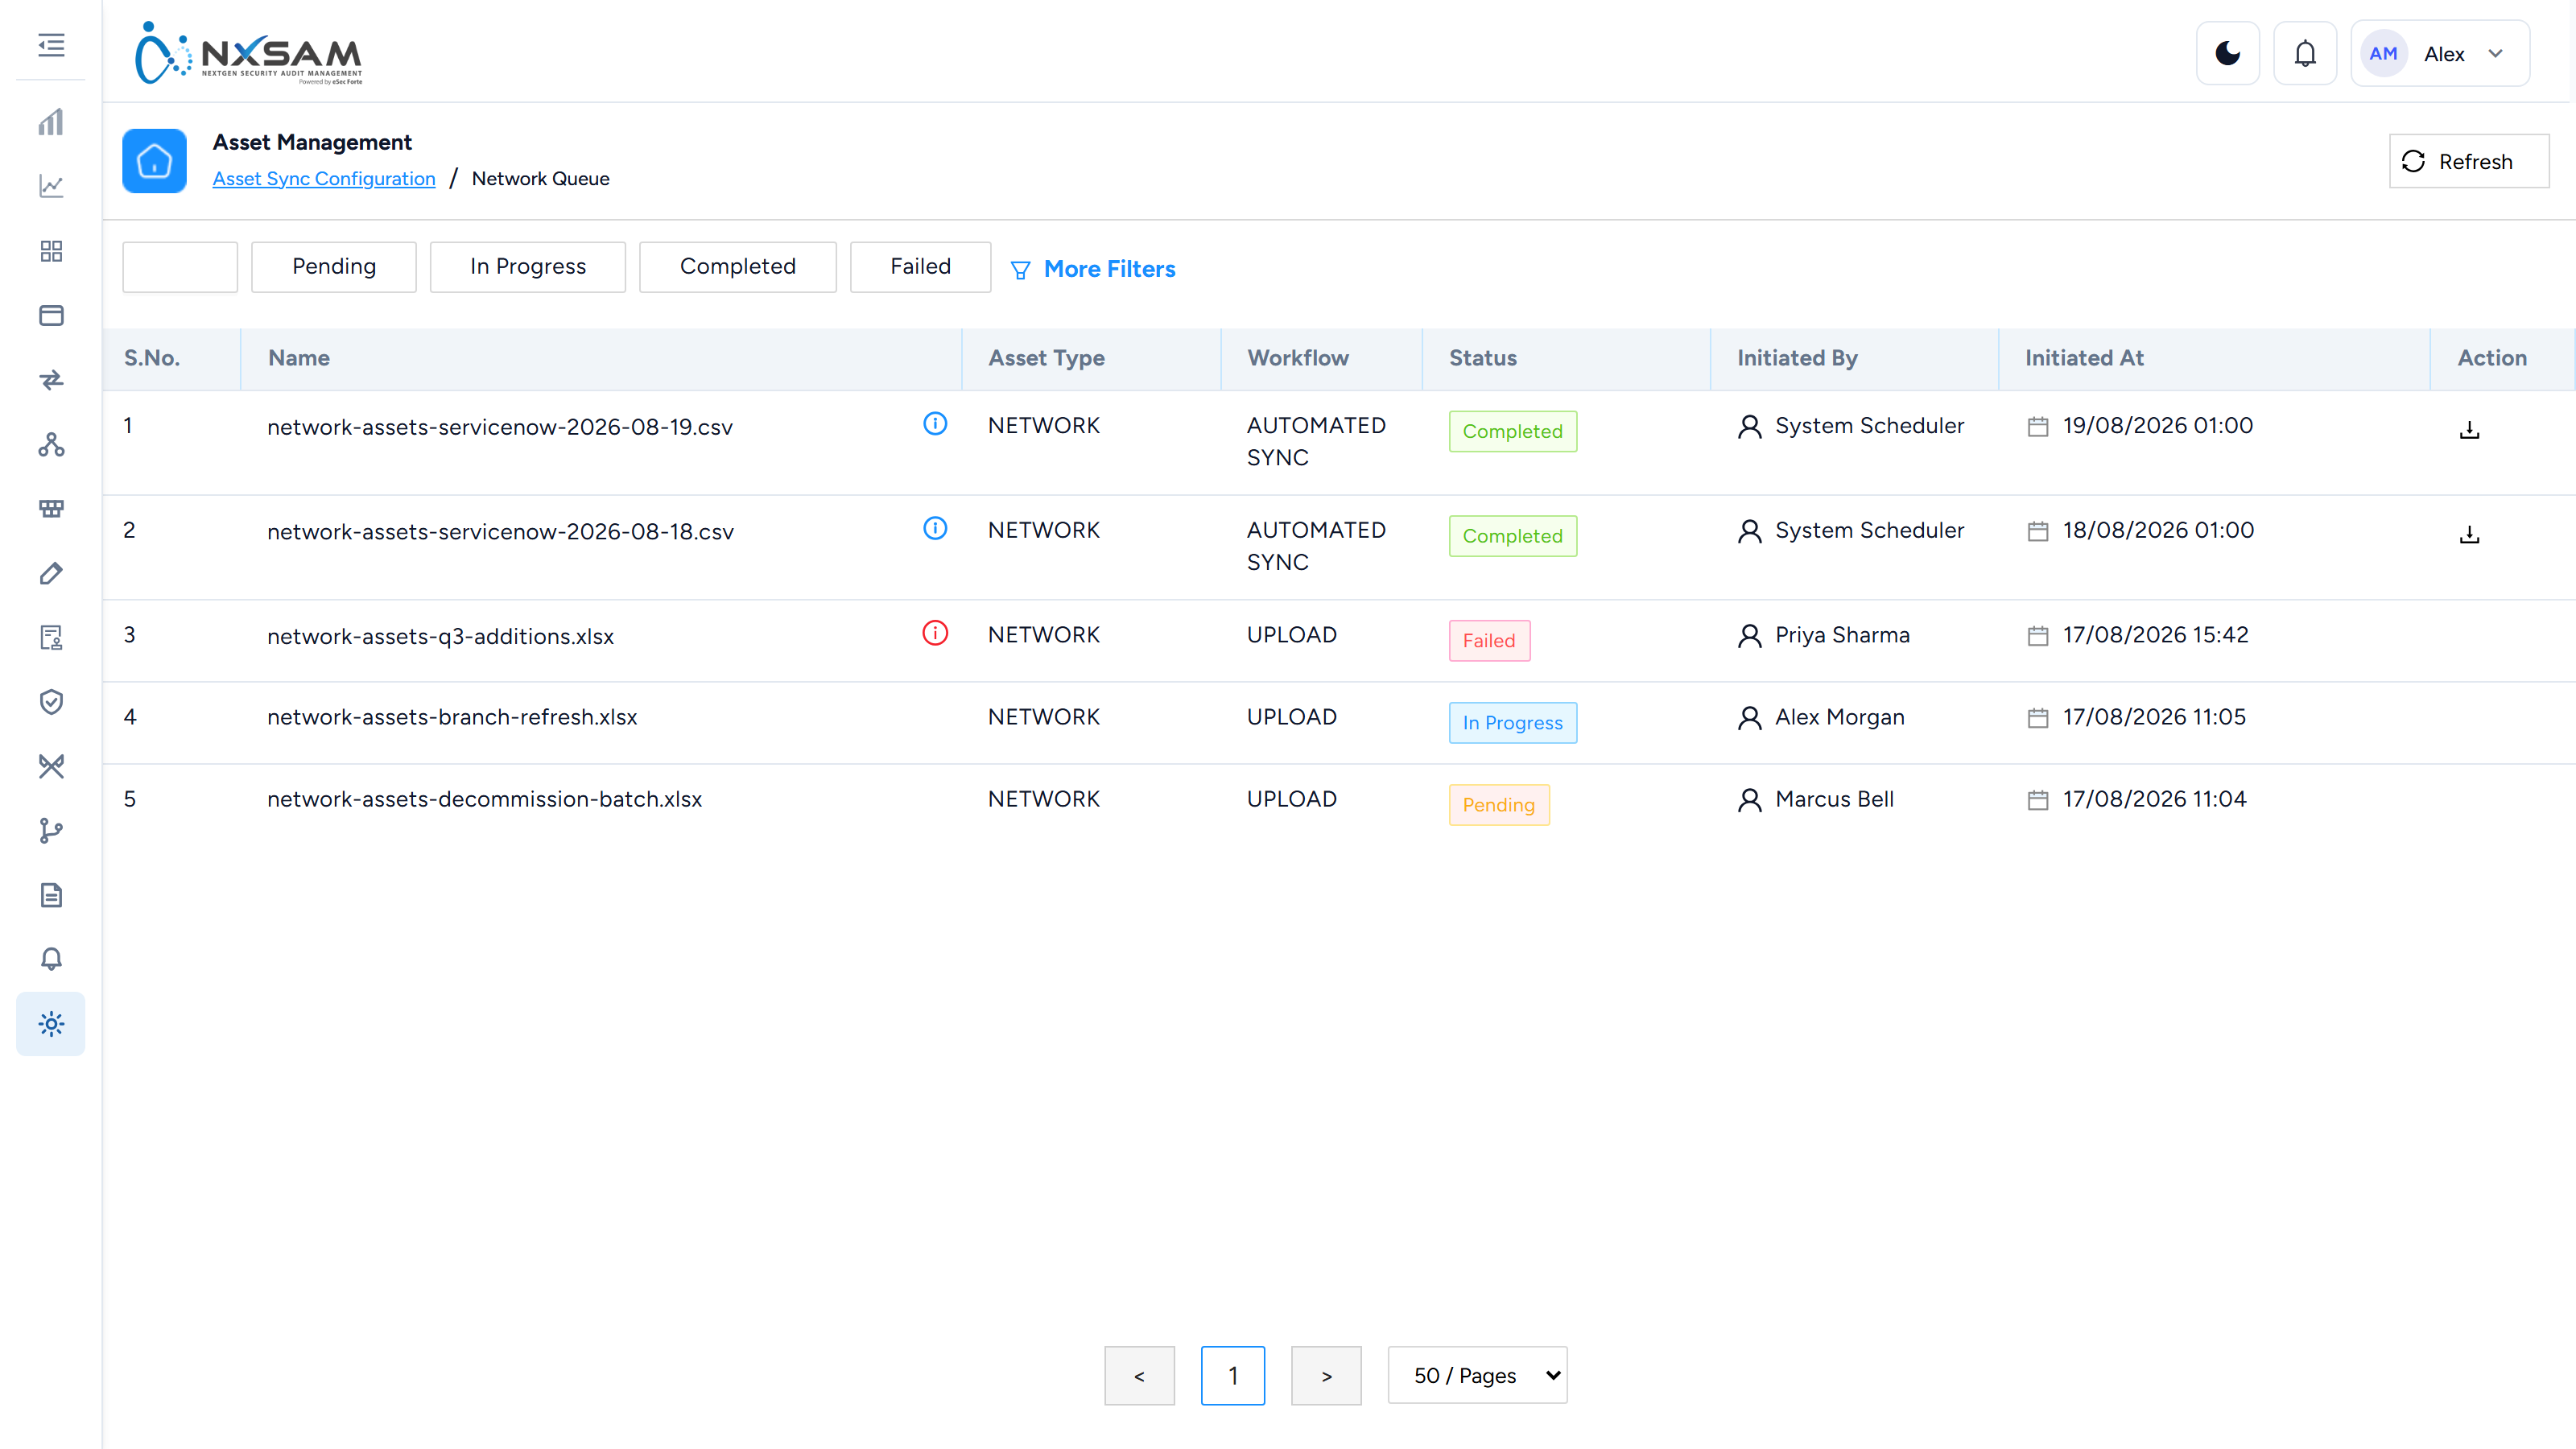
A bulk upload is queued rather than applied on submission, and the queue is where a rejected file explains itself.
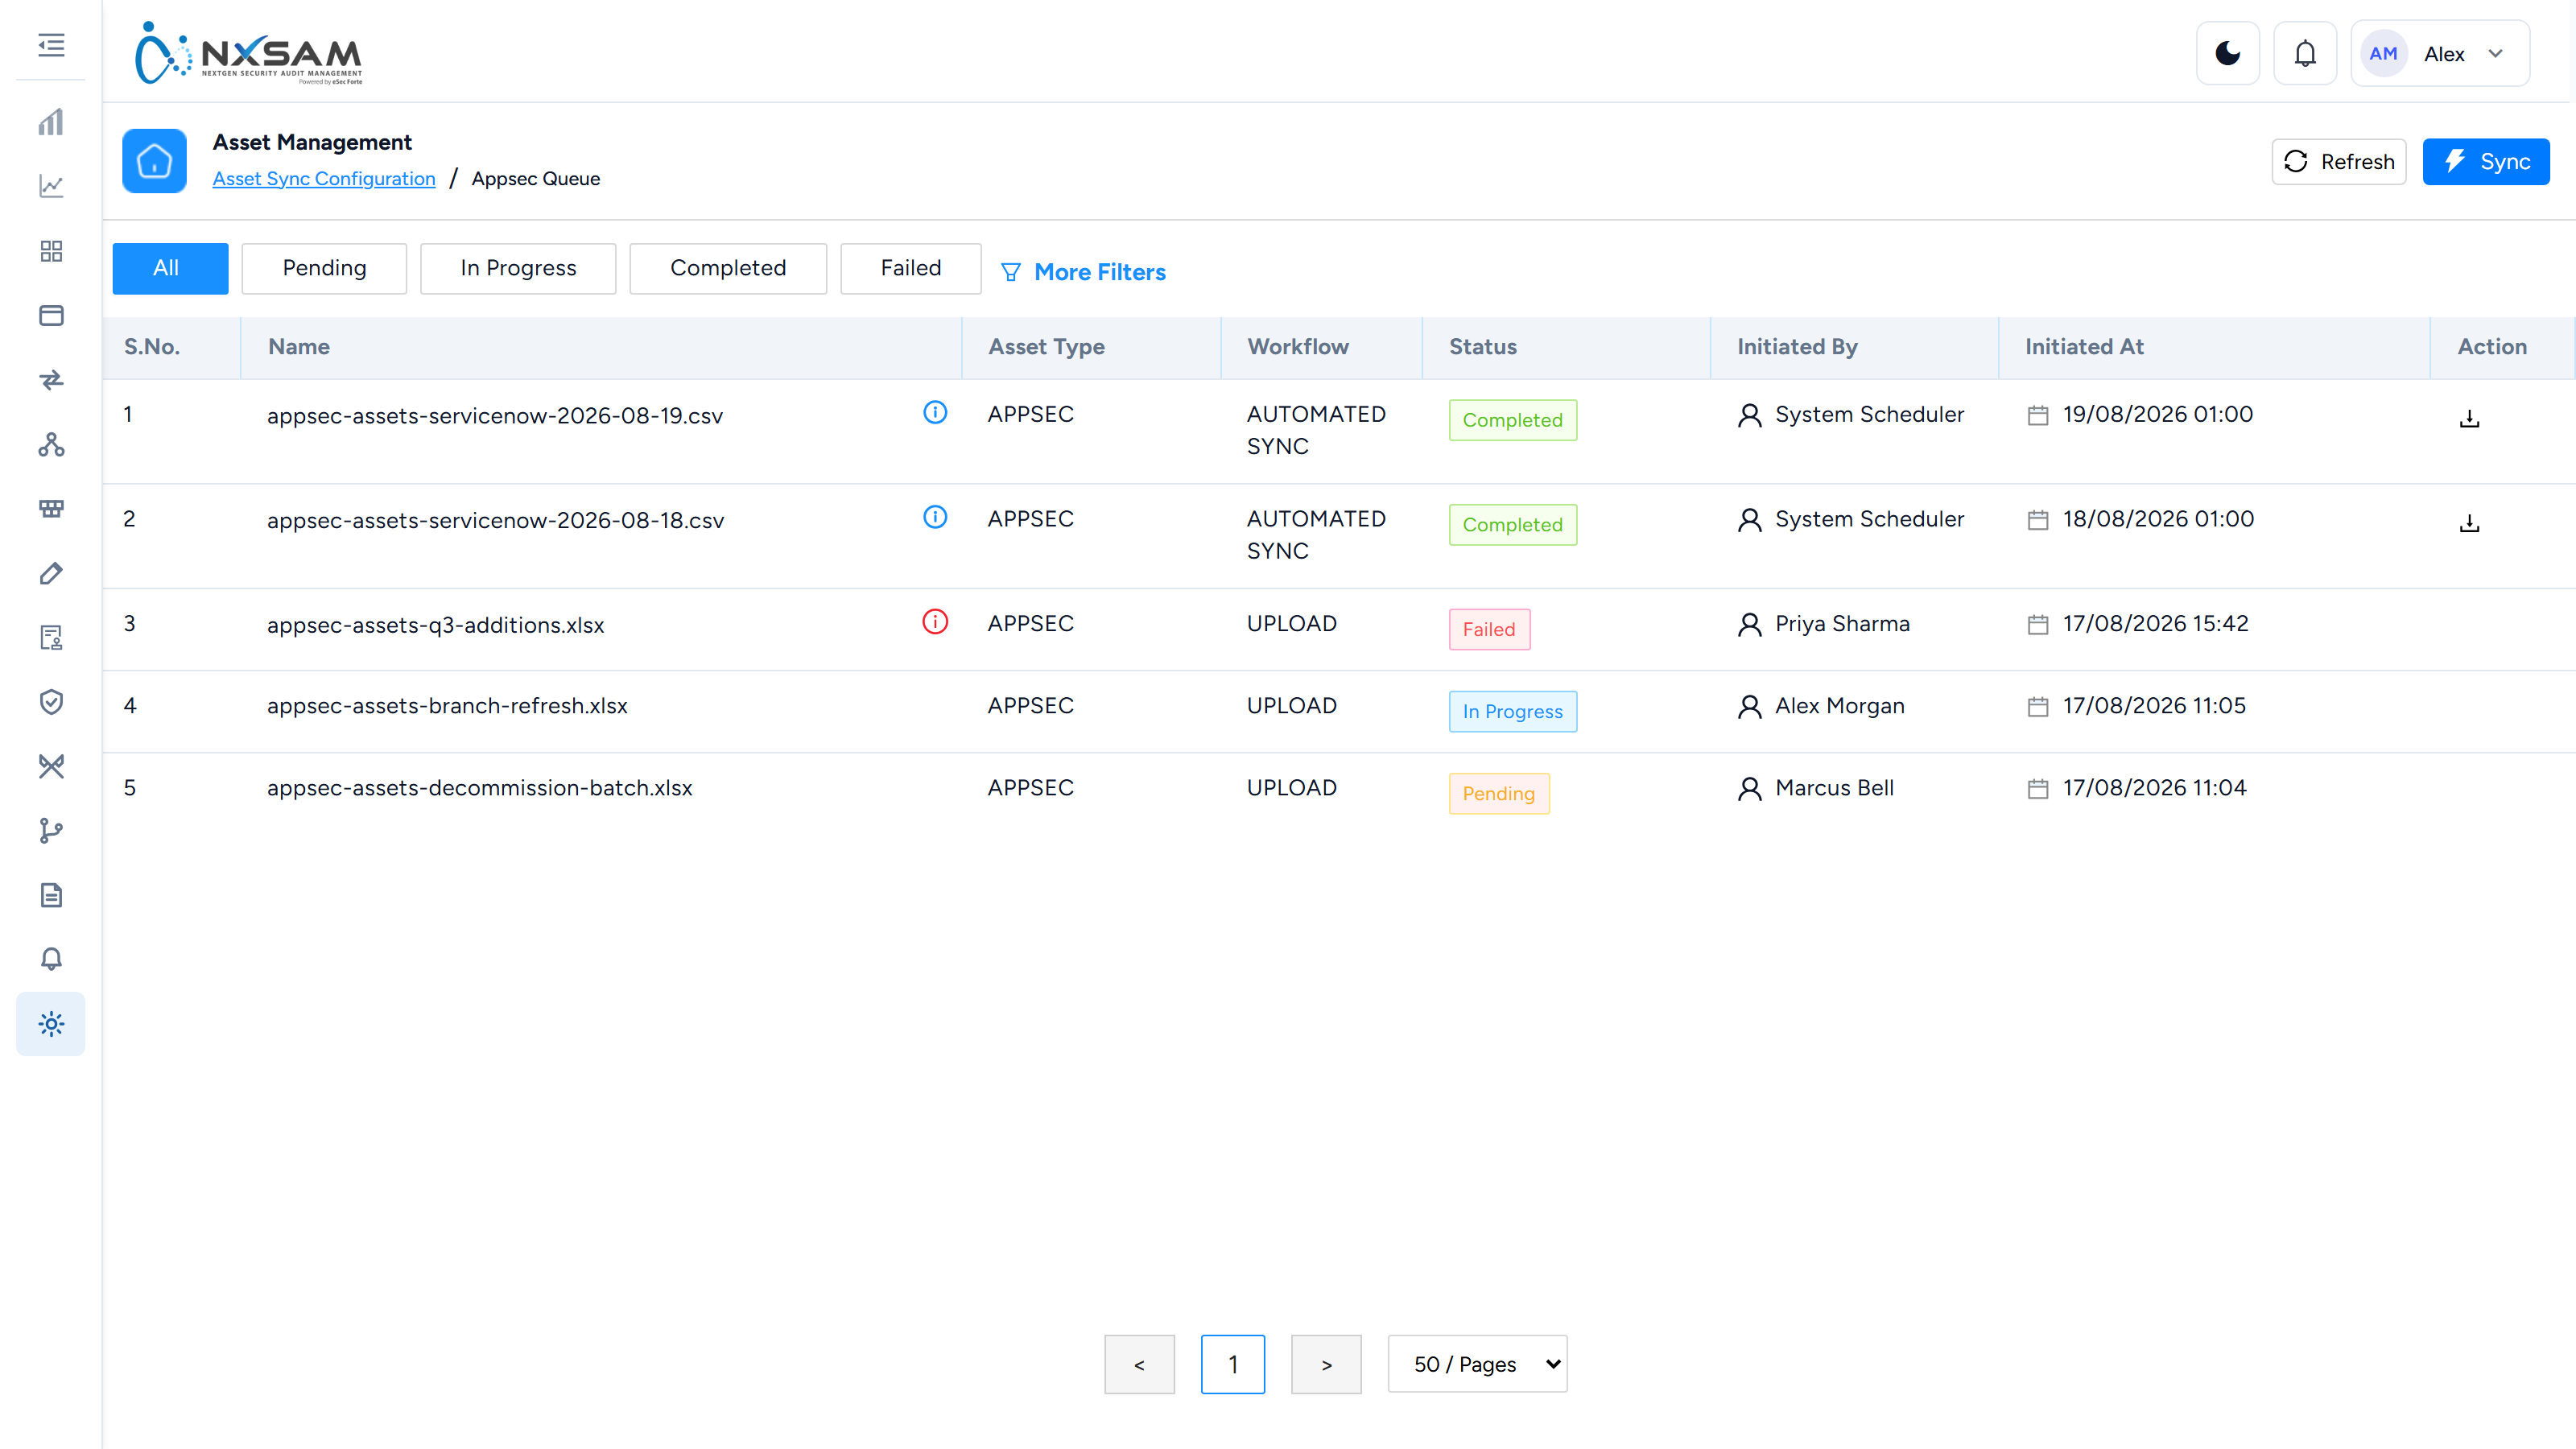
Where a sync is configured, treat the source system as authoritative. A local edit to a synchronised field is overwritten on the next run, which looks like the platform discarding work.
Decommissioning
Assets that no longer exist should be decommissioned rather than deleted. Decommissioning removes an asset from active tracking while preserving its history, so past findings and the reports that mention them remain intelligible.
Deleting is also a soft operation — the record is hidden rather than destroyed — which is why a deleted asset's name can still appear on historical findings and older reports. That is intentional, and it is not a leak of removed data.
Audit calendar planner
Plans assessments across the estate over a period, so coverage is deliberate rather than whatever was requested ad hoc. Most useful where a compliance obligation requires every asset of a given class to be assessed on a defined cycle — the planner is where you can see whether that is actually happening.
Assets: every screen, column and action
The largest module in the product — 116 columns and 52 row actions across the inventories, the management screens and the queues. Everything below is taken from the templates.
The asset inventories
Web, Mobile, Thick Client, Network, API and Container each have their own list. The four application-style inventories share a column set:
| Column | What it holds |
|---|---|
| Application Details / Assets Details | Name, identifier and type |
| Risk Score | The contextual score, not raw severity |
| Project | Which project the asset belongs to |
| Audits / Active Audits | How many assessments exist against it |
| Total | Open findings |
| Critical / High / Medium / Low / Info | The severity split of those findings |
The severity columns are labelled from the severity master, so an organisation that renames or recolours a severity sees the change here without any configuration on this screen.
App Code
Every application-style asset carries an App Code — your organisation's own identifier for the application, as used in your CMDB, your change process or your finance system. It is not generated by NxSAM.
It exists so that a finding can be traced back to the system of record everyone else uses. Asset names drift (a portal gets renamed, an acquisition rebrands); the code usually does not, which is why reports, host selections and exports all carry it.
App Code can be made mandatory, and usually should be
A system setting makes App Code required when onboarding an asset. Left optional, it gets skipped during a bulk import and the gap is invisible until someone tries to reconcile findings against the CMDB months later and finds half the estate unmatched.
Turning it on later does not backfill the assets already created without one.
Network assets replace Project with Application Count — how many applications run on the host — because a host's importance follows from what it carries.
API assets replace the severity columns with API Collections Details and Description, since an API asset is a collection of endpoints rather than one deployable thing.
Container assets show Registry / Repository, Org, Vulnerability, Compliance and Collections — the image coordinates instead of a name.
Row actions on an application asset — ten
| Action | What it does |
|---|---|
| View Web Application / View Mobile Application / View Thick Client | The asset's full record |
| View Overall Details | Findings and audits across the asset's whole history |
| Edit Web Application / Edit Mobile Application / Edit Thick Client | The asset's own fields |
| Edit Ownership | Who is responsible — drives visibility and chasing |
| Edit Tags | Labels used for grouping and reporting |
| Add/Download Document | Attaches or retrieves supporting files |
| Risk Score Overview | How the score was arrived at, factor by factor |
| Download Overall Report | A report covering everything known about the asset |
| Delete Application | Soft delete |
An asset's type is fixed once it is created
The type decides which module assesses the asset and which scanners can contribute findings to it, so it is set at creation and not changed afterwards. If an asset has been classified wrongly, create it under the correct type rather than looking for a way to move it — findings already recorded stay attached to the asset as it was classified.
Use it to correct a mistake made at onboarding, not to reorganise a working estate.
Risk Score Overview is the answer to "why is this asset ranked above that one". The score combines severity with asset context — criticality, exposure, exploitability — and the overview shows the contribution of each. Without it the ranking is unexplainable to the person being asked to act on it.
Network asset actions
Edit Network Asset, Edit Network Asset Owner, Edit Tags, Risk Score Overview, Download Overall Report, Delete Network Asset, and Request VA Audit — which creates a VA audit against the host without leaving the inventory. That last one is the normal path from "this host looks wrong" to "someone is scanning it".
API asset actions
View Overall Details, Edit Asset, Edit Ownership, Edit Tags, Risk Score Overview, Download Overall Report, Delete Asset.
Page-level actions on an inventory
| Action | What it does |
|---|---|
| Import Hosts | Bulk-creates network assets from a file |
| Update Asset Properties | Sets custom properties across selected assets at once |
| Update Application Tags / Update Host Tags / Update Thick Client Tags | Bulk tagging |
| View Queues | The status of bulk operations started from this screen |
| Generate Application Summary | Per-application summary report |
| Generate Detailed Summary | The long form |
| Generate Issue Dashboard Summary | Findings shaped for a dashboard view |
| Generate Wise Summary | Grouped summary across the inventory |
Bulk updates are queued, and View Queues is where they report
Updating properties or tags across a selection does not complete when the dialog closes. It queues, and the result — including rows it could not apply to — appears under View Queues.
A bulk update that "did not work" has usually finished with rejections nobody read.
Asset detail views
Opening an asset shows its audits:
Latest audit details — Audit Details, Start Date, Audit status, Audit testing
methodology, Audit type, Type / Methodology, Audit Considered.
Active audit details — ID, Audit Name, Start Date, Audit status, Audit type,
Audit Cycle.
Audit Considered on the latest-audit view is the field that explains a dashboard disagreement: an asset whose most recent audit is not considered contributes its previous audit's numbers to aggregate views.
Overall details for one asset
Opened from View Overall Details. It gathers everything known about the asset in one place, across every audit it has ever had:
| Section | What it holds |
|---|---|
| AUDITORS | Everyone who has assessed this asset, from auditors |
| Best Practice | Findings raised as recommendations rather than defects |
| Port / Protocol | For network assets, where each finding was observed |
Best Practice findings are the ones people argue about. They are not vulnerabilities — nothing is exploitable — but a hardening recommendation the assessor considered worth recording. They carry no SLA and should not be counted as an open risk, which is why they are separated here rather than mixed into the finding list.
AUDITORS matters on a re-test dispute. When a finding closed by one assessor is re-opened by another, this is where you see that two different people assessed the same asset — which is frequently the explanation.
Ownership
User name and Owner Type, multi-select. An asset can have several owners of different types — a technical owner and a business owner, for instance — and each type is chased differently when findings age.
Ownership is also visibility: an asset owner sees their own assets and the findings on them. A colleague who cannot see an asset you can is an ownership question, not a permissions fault.
The organisational hierarchy
| Screen | Columns |
|---|---|
| Organizations | ID, Organization Details, Network asset uniqueness, API asset uniqueness, Status |
| Business Units | ID, Business Unit, Organisation, Created By, Status |
| Projects | ID, Business Unit, Project Details, Organisation, Status |
Asset uniqueness is set per organisation and is hard to change later
Network asset uniqueness and API asset uniqueness decide whether the same host or endpoint can exist twice within an organisation. Set it to unique and a second import of the same IP updates the existing asset; set it to non-unique and it creates a second one.
Changing it after assets exist does not merge or split what is already there. It only changes what the next import does, which is why two environments with the same data can end up with different asset counts.
Asset properties
| Screen | Columns |
|---|---|
| Asset Properties | Property Name, Property Type, Created By |
| Asset Property Management | Asset Type, Properties — which properties apply to which type |
| Manage Properties (dialog) | Property Name, Property Type, Sequence, Mandatory |
Mandatory and Sequence are set per asset type. A property marked mandatory blocks asset creation until it is filled, which is the usual reason a bulk import starts rejecting rows after someone edits the property configuration.
Asset owner types
ID, Asset Owner Name, Created By, Created On. The catalogue of ownership roles
that can be assigned — technical owner, business owner, and any others your organisation
defines.
Network asset mapping
View mapped network asset — ID, Host, Risk Master, Total, Critical, High,
Medium, Low, Info.
Update network assets — Network Asset ID, Host IP/Host Name.
Mapping relates an application to the hosts it runs on, so an application finding can be traced to infrastructure and a host's risk reflects what it carries.
The import and sync queues
Four tabs, because assets arrive four ways.
| Tab | Columns |
|---|---|
| AppSec | Name, Workflow, Asset Type, Status, Initiated By, Initiated At, plus Properties, Header, Default Value for the column mapping |
| Network | The same set |
| CMDB | Sync Type, Status, Initiated At, Completed At |
| ServiceNow | ServiceNow Table Name, Asset Sync Type, Network Asset Type, Status, then per-module Module, Status, Initiated At, Completed At, Logs |
The ServiceNow tab filters by All, Appsec Assets or Network Assets, because one sync can populate both and they succeed independently.
Mapping a ServiceNow table
A ServiceNow sync is configured per table: which of its records to take, which of its fields feed which NxSAM property, and how to translate values on the way in. The mapping screen has five tools, and most "the sync imported the wrong thing" questions are one of them set wrongly.
| Tool | What it does |
|---|---|
| Header Mapping | Pairs each NxSAM Property with a ServiceNow Field. Click a field cell to pick from the table's own fields; Fetch a sample lists them with a Sample Value each, and marks a SUGGESTED match where the names line up. A Static property takes a fixed Default instead of a field |
| Reference fields | A field marked REF points at another record. The mapping asks which attribute of the linked record to store — its display value, or a specific attribute — rather than the raw reference |
| Fallback fields | A property can read from an ordered list of fields; the first non-empty one wins. Where every field in the list is empty, the property's own default applies |
| Where Condition | Filters which records sync, per property: match ALL or ANY of a set of conditions, each a Match or No match. It can be tested against live data before saving |
| Value Mapping | Translates a field's source values into NxSAM values for choice-type properties, so a value ServiceNow spells one way lands as the option NxSAM recognises. The source side offers the values actually present in the column, and accepts a typed value for ones not yet seen |
Data Preview shows what the mapping would produce — the Resolved values for a page of records, with VISIBLE and HIDDEN columns and a search — and can export it, with the time of the Last export shown. Preview before the first sync, and again after any change to a where condition or value mapping: a sync that imports ten thousand rows is much harder to undo than a preview that shows ten.
A fallback chain is why a field can be populated from a column nobody mapped
When the first field in a chain is empty, the sync reads the second, then the third. An asset whose IP "came from the wrong place" usually has an empty primary field and a populated fallback — which is the chain working as designed. Check the chain before checking the data.
For application assets, the sync can Auto-Create Application records for CIs with no match, Auto-Generate App Code where the source has none, and Auto-Update Empty App Code on records that already exist without one. Each is a switch on the sync setting, off by default, because each one creates or changes records rather than merely reading them.
Header and Default Value in the file-based tabs are the column mapping: which column of the uploaded file feeds which property, and what to use when it is empty. A default value quietly applied to thousands of rows is a common source of "why do all our assets say the same thing".
Decommissioning
| Column | What it holds |
|---|---|
| Decommission Asset ID | The request |
| Initiator | Who raised it |
| Status | Where the request has got to |
| Pending On | Who it is waiting for |
Actions: Edit Decommission, Update Initiator, View Status History, Delete Decommission Request.
Decommissioning is a request with an approval chain rather than a delete, because removing an asset from tracking changes historical reporting. Pending On is what you check when a request has stalled.
The selection screens list Assets, Asset Type, Organisation, Business Unit,
Project so the right assets are chosen before the request is raised.
Audit Calendar Planner
Plans assessments across the estate so coverage is deliberate.
| Column | What it holds |
|---|---|
| Planner Details / Description | The plan |
| Created By / Updated On | Provenance |
| Selected Assets & Audit Type | What is planned against what |
| Assets | How many are in the plan |
| Progress | How much of the plan has been executed |
| Status | Plan state |
Actions include Choose Audit type to assets, View All Selected Assets, Sync and Delete Audit, with the audit type chosen from VA, PT, Black Box, Grey Box and White Box.
Sync is what turns the plan into real audits. Until it runs the planner is an intention; after it runs the audits exist and appear in their modules.
The supporting tables list Assets, Organisations, BUs, Projects when adding, and
Asset Details, Audit Type, Organisation, Project, Bu, Status when reviewing
what was selected.
Dashboard views
Manage Dashboard Views — Name, Created By, Created On. Each view is a saved
profile deciding which sections and widgets the Assets dashboard shows, and which filter
it opens with.
Creating one is three decisions:
| Decision | What it controls |
|---|---|
| Asset types | Which of Web, Mobile, Thick Client, API, Network and Container the dashboard covers. At least one is required |
| Sections | The panels shown — Overall, Network VA, Network PT, Policy Config and the per-asset-type sections. Each section can be expanded to pick its sub-sections individually |
| Filters | Organisation, business unit and project the view opens with, plus anything under More Filters |
A view is Private unless you make it otherwise, so building one is safe: it changes nothing for anyone else until you share it.
Each row carries up to five actions, and which of them appear tells you what kind of view it is:
| Action | Available on |
|---|---|
| Preview Dashboard | Every view, including the system one — the safe way to see what a view shows before adopting it |
| Edit Dashboard | Views you may change: your own private views, or any view if you hold the update permission. Never the system view |
| Make Public | A private view you may change. It publishes the view to everyone |
| Make Default | Any view, with the permission. Greyed out on the view that is already your default |
| Delete Dashboard | Any view but the system one, with the permission |
Publishing is one-way on this screen
There is a Make Public action and no matching action to make a view private again. If one was published prematurely, deleting it and rebuilding is the route back — so preview it and check its filters before publishing rather than after.
The system view is the platform's own default. It cannot be edited, published or deleted, which is deliberate: it is the arrangement everyone falls back to, and it stays recognisable.
Two things are worth knowing before you build one. The dashboard renders a heading for every enabled section, so a view with everything enabled produces a long page where most sections are empty — enabling only what a team looks at is what makes the view useful rather than complete. And the saved filter is part of the view: a view scoped to one business unit will always open scoped to it, which is the point, but it also explains a colleague's "the totals are too low" when they are using someone else's view.
Both dashboards export via Download as PDF / Download as PNG, and the asset dashboard through PDF / PNG.
Change accessibility
Asset ID, Asset — bulk-sets whether assets are externally or internally reachable.
Accessibility drives prioritisation in Network PT, where an external Medium usually
outranks an internal High.
Assets: find the right screen
Every screen in this module, what each one is for, and where it lives. Use it to find the right screen quickly, and to confirm you are on the one a colleague means — several screens in this product have similar names and different jobs.
Screenshots come from a demonstration data set, so the figures are illustrative. Click any screenshot to open it at full resolution.
API Assets
Service endpoints assessed separately from the applications that consume them.
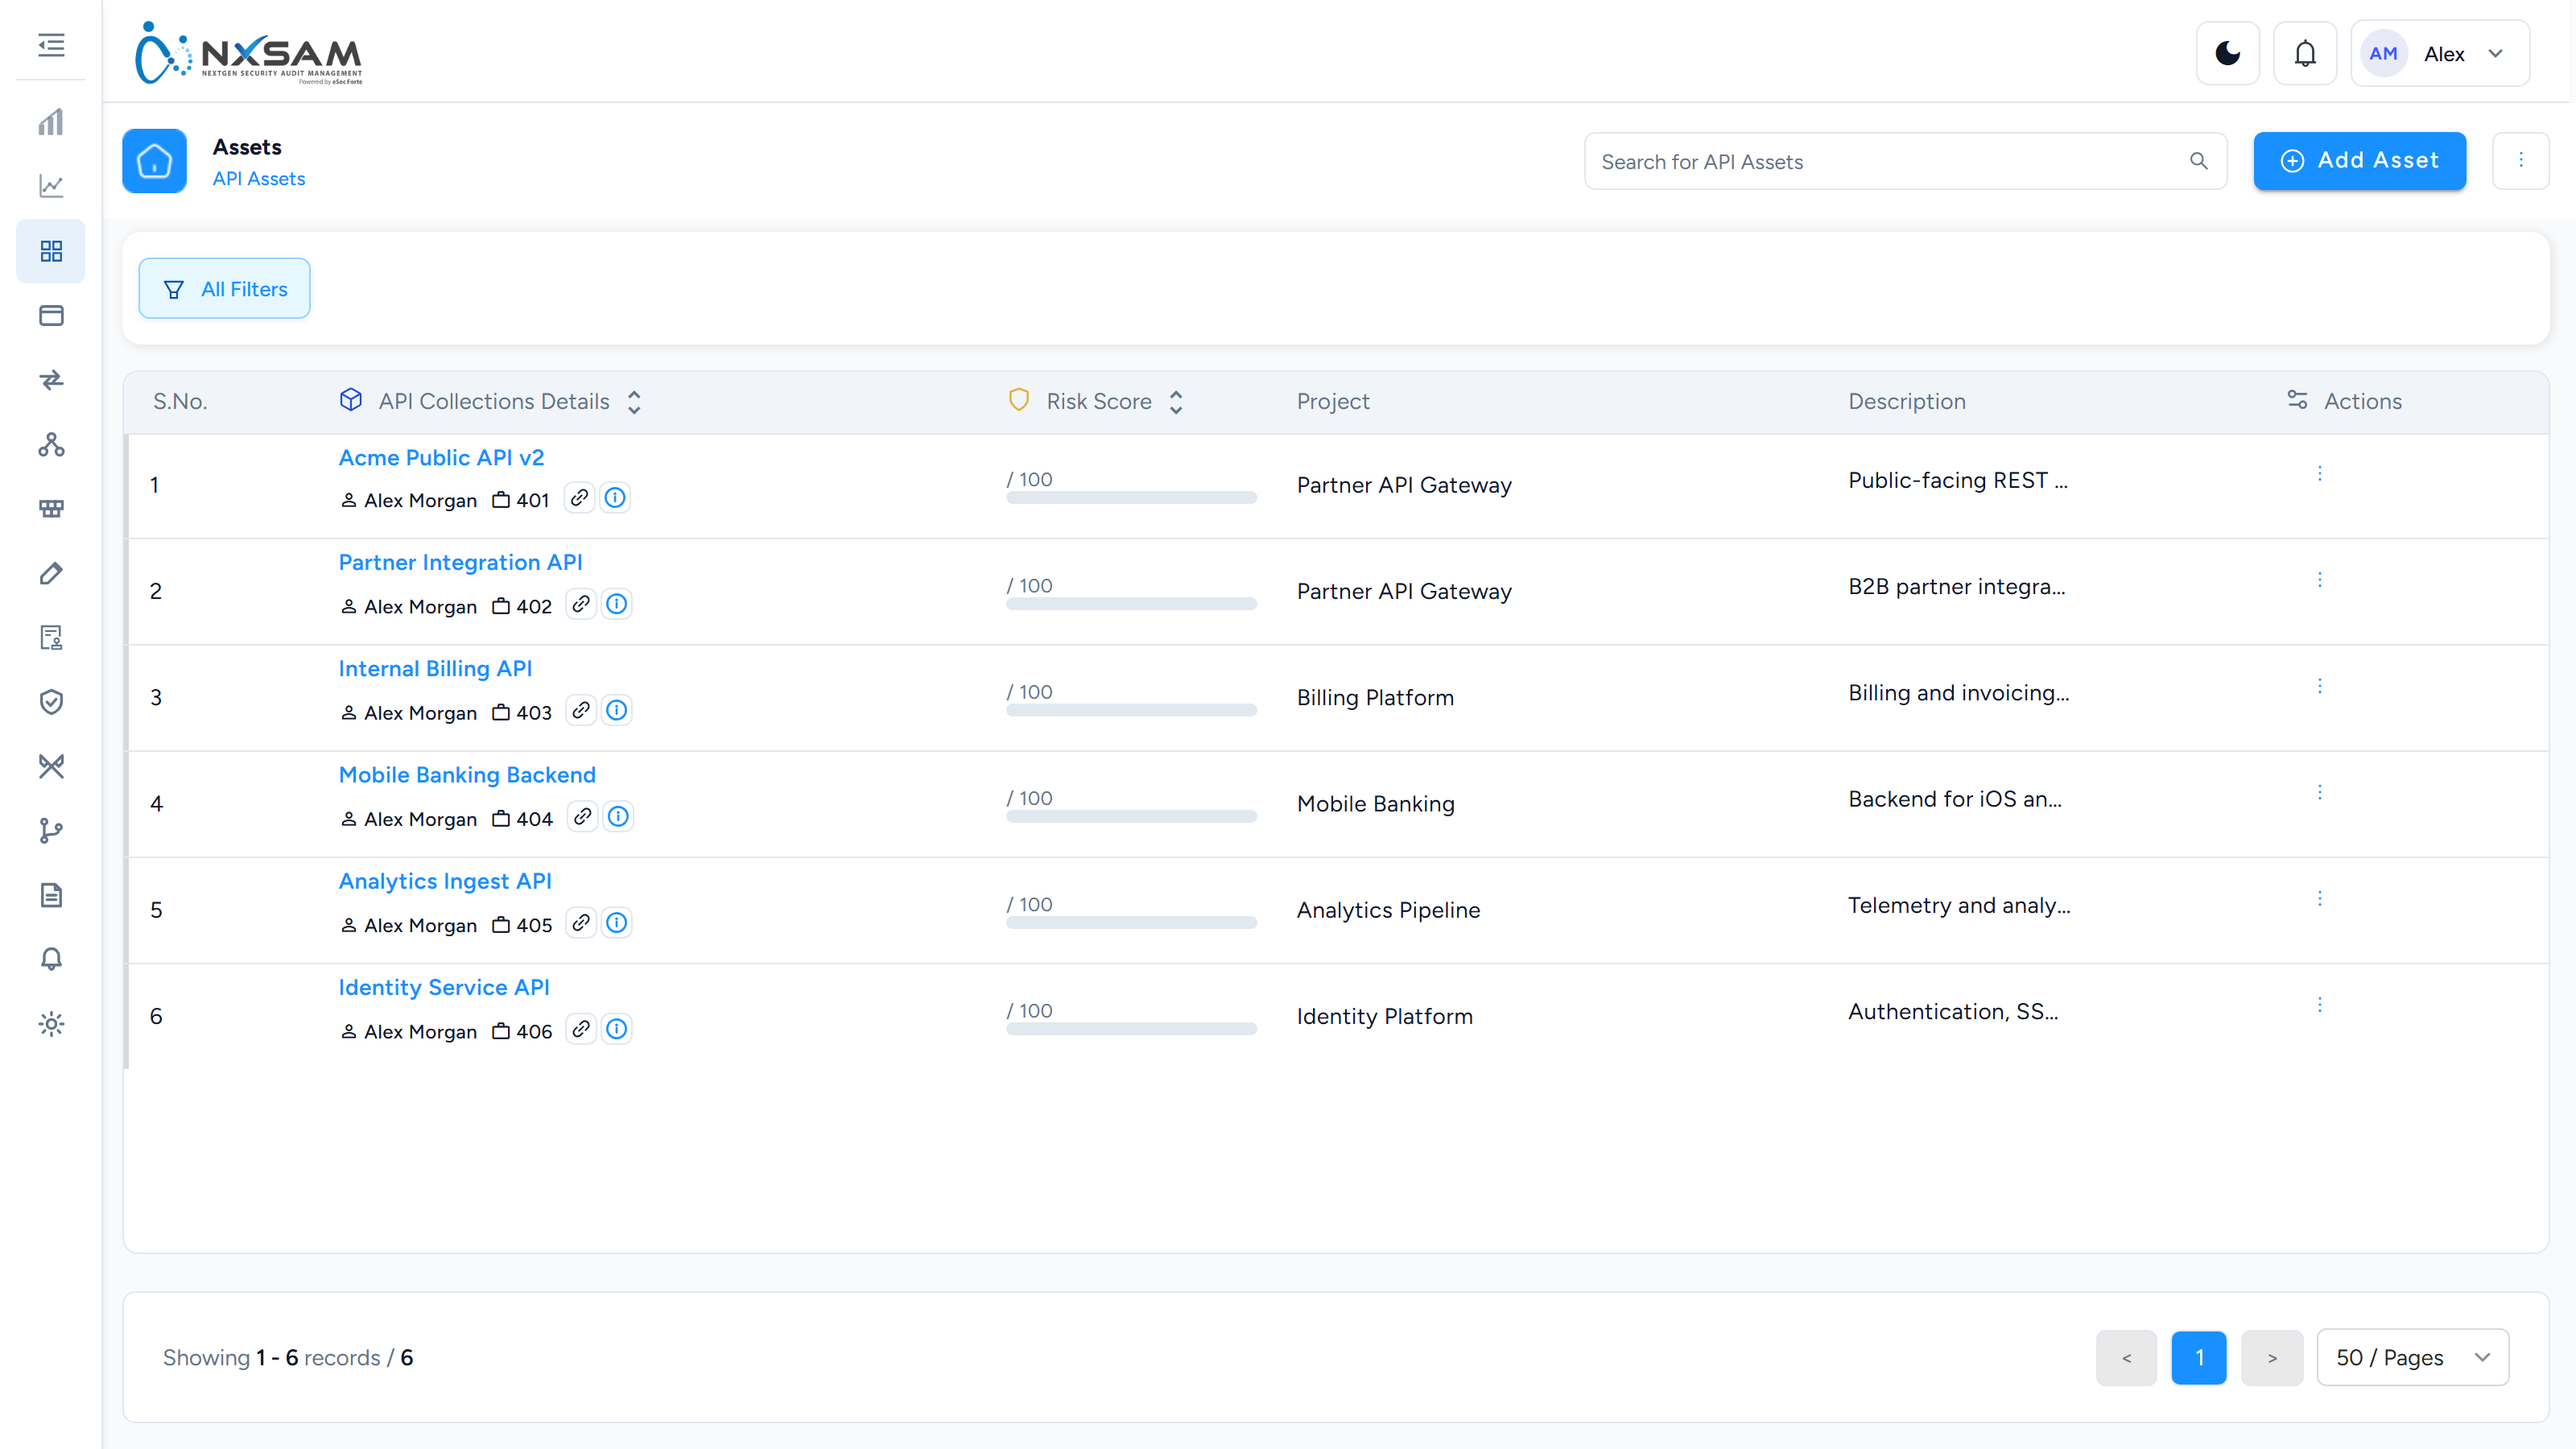
Asset Dashboard
How many assets of each type, and how their criticality is spread across projects. The split matters more than the totals — it shows where the important assets actually sit.
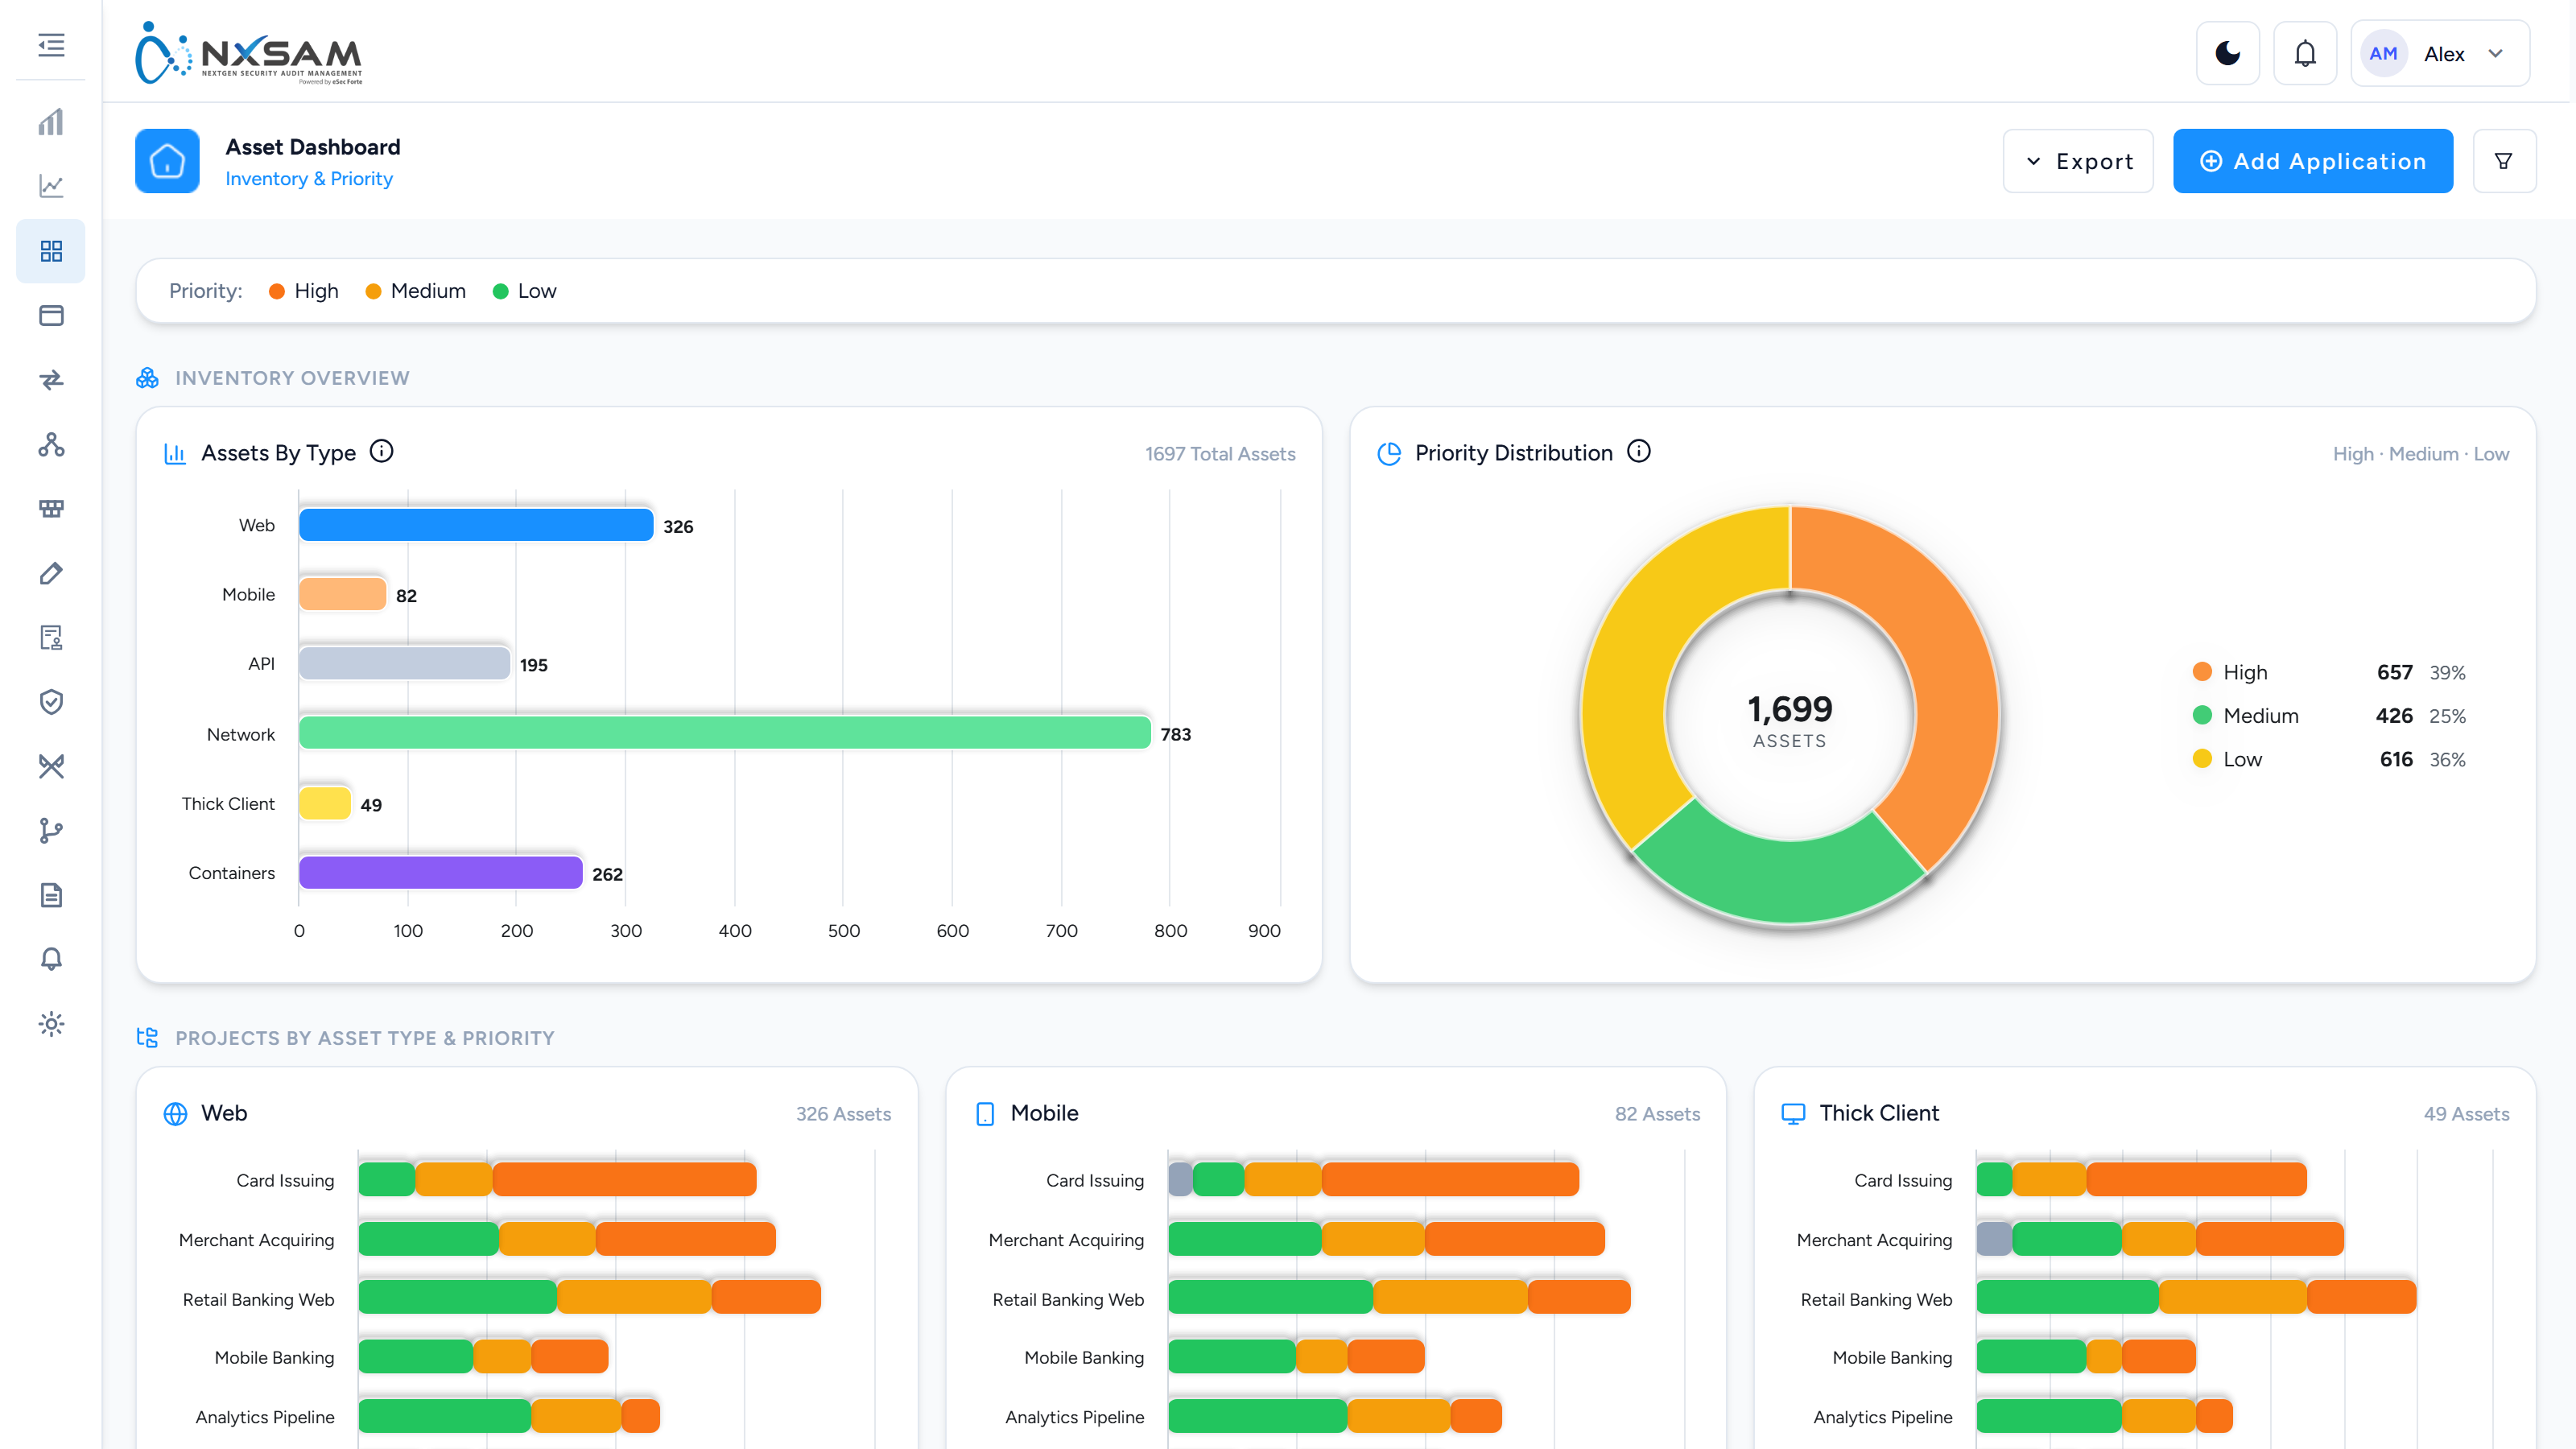
Asset Decommissioning
Requests to retire an asset, and who each is waiting on. Decommissioning preserves history; deleting hides the record.
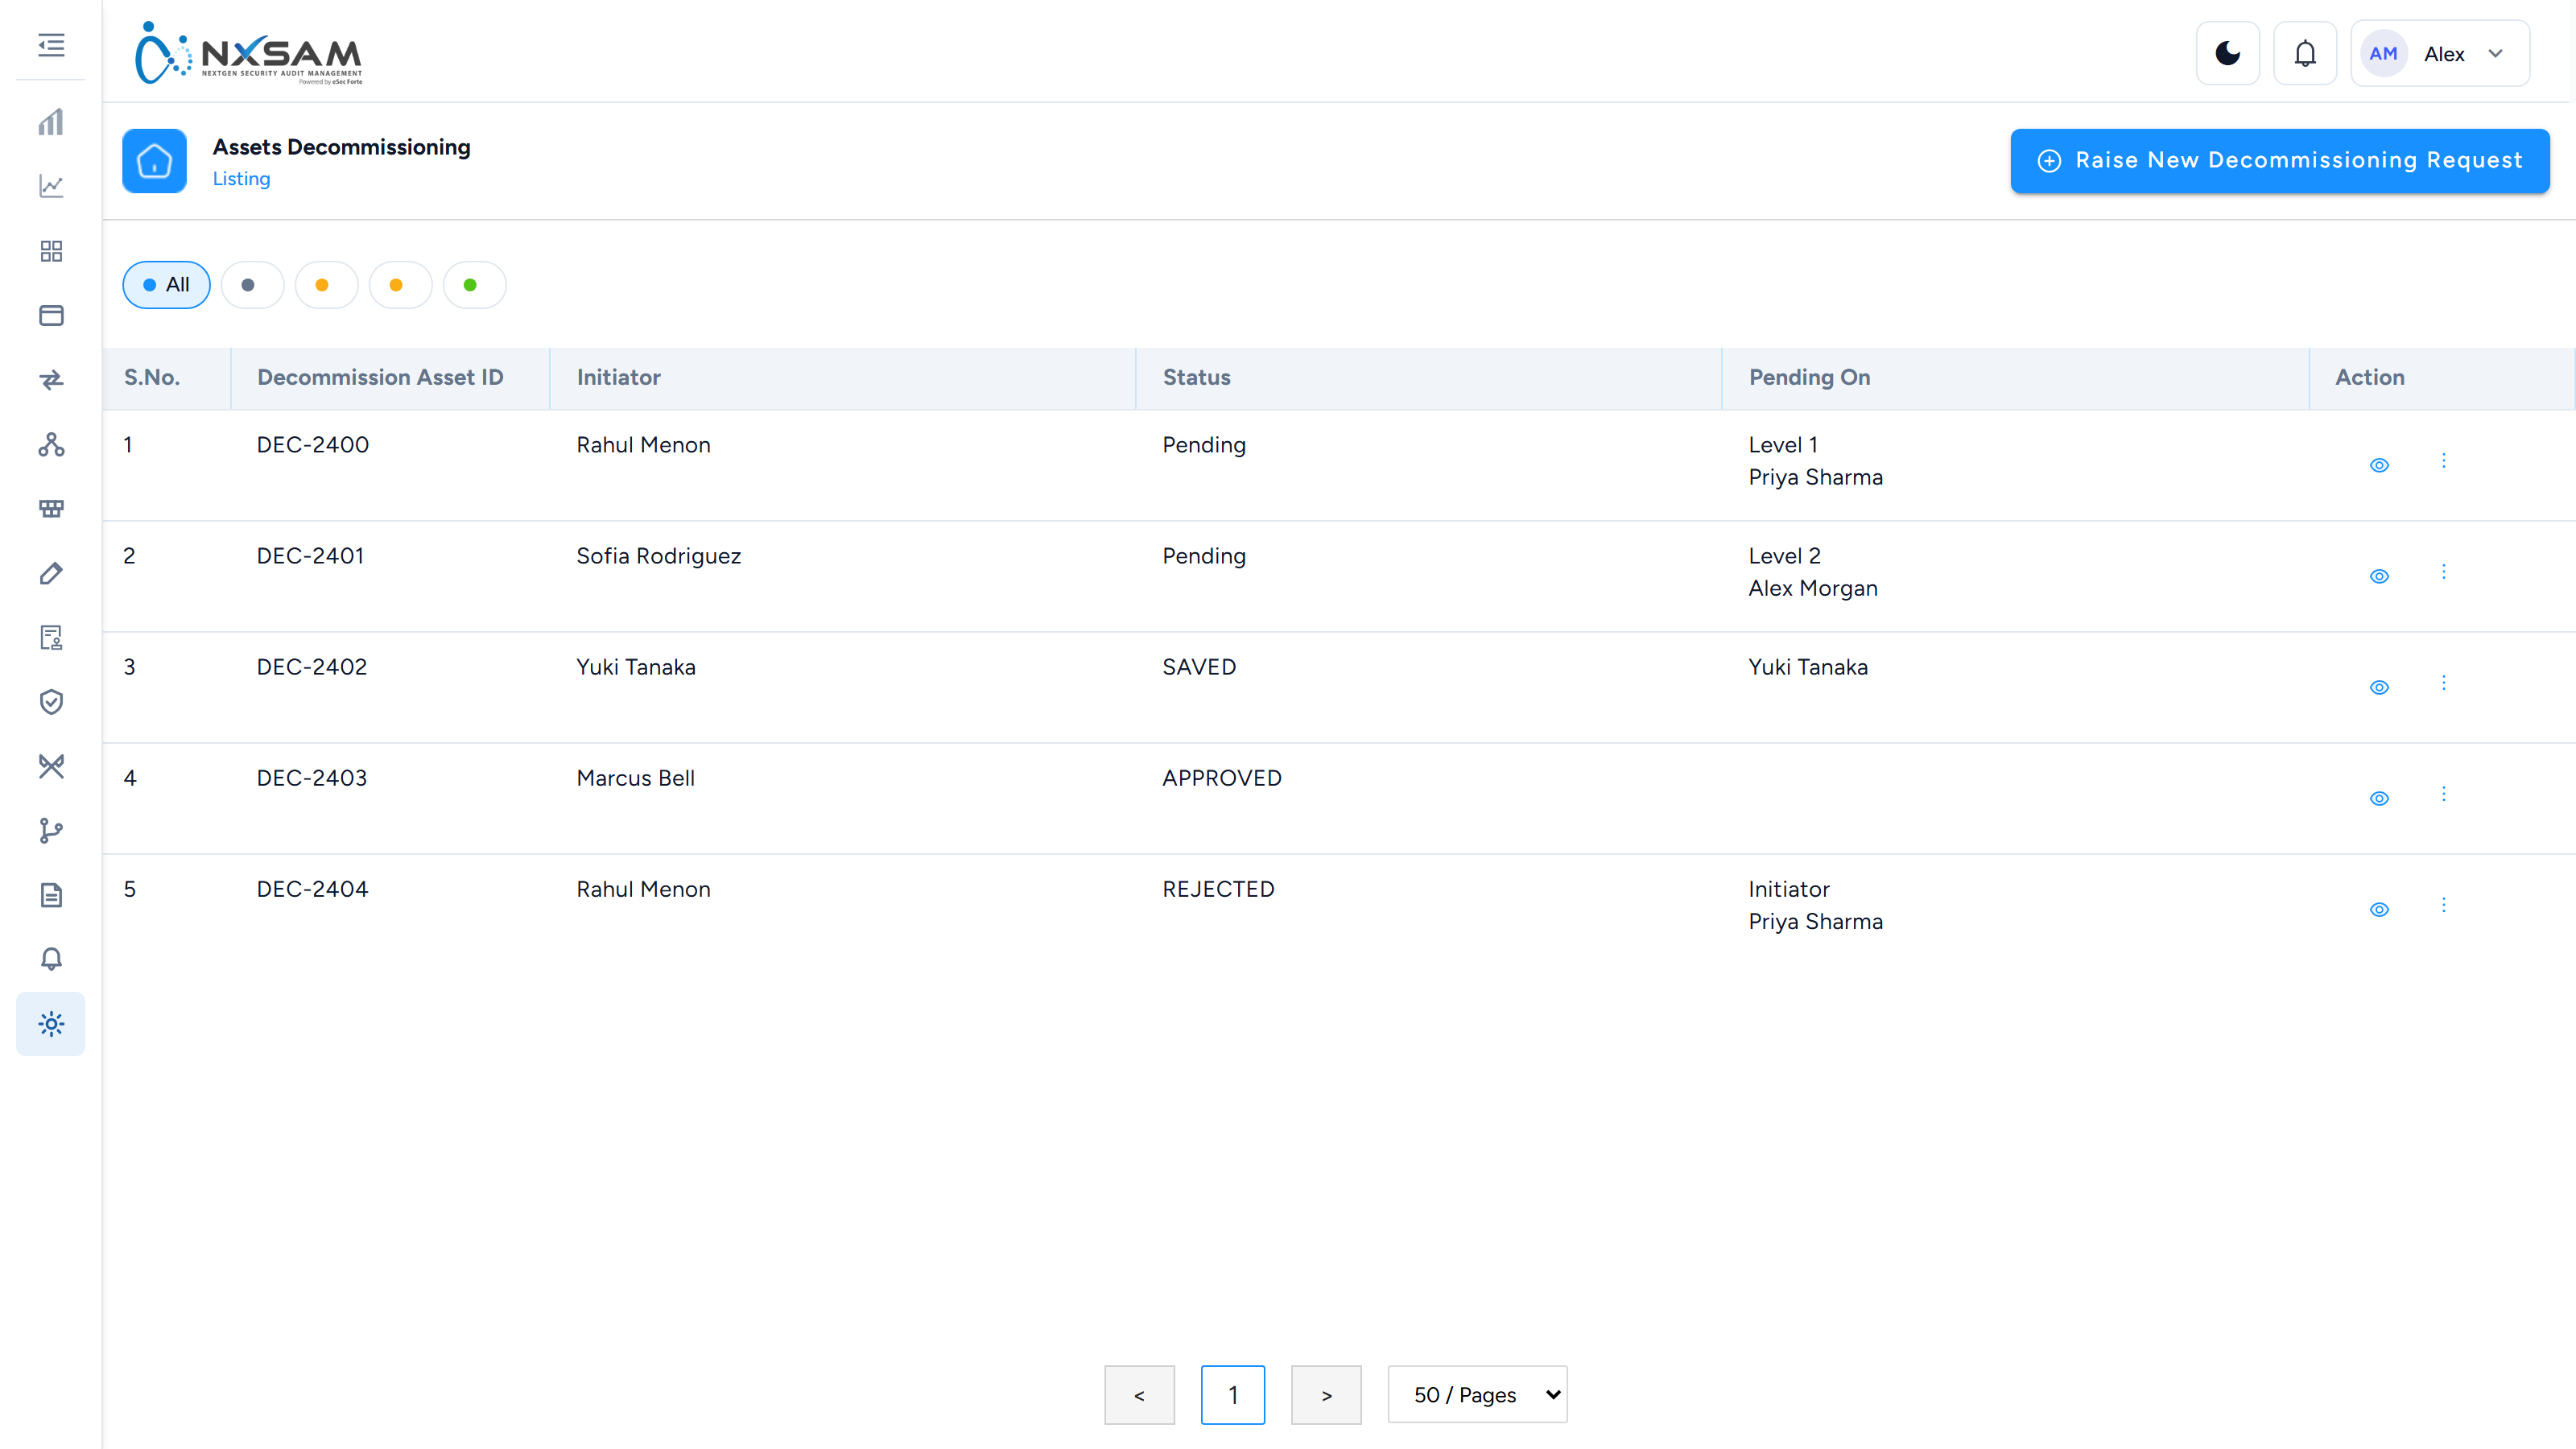
Asset Main Dashboard
Posture across the whole inventory, sectioned by asset type. Which sections appear is set by the dashboard profile.
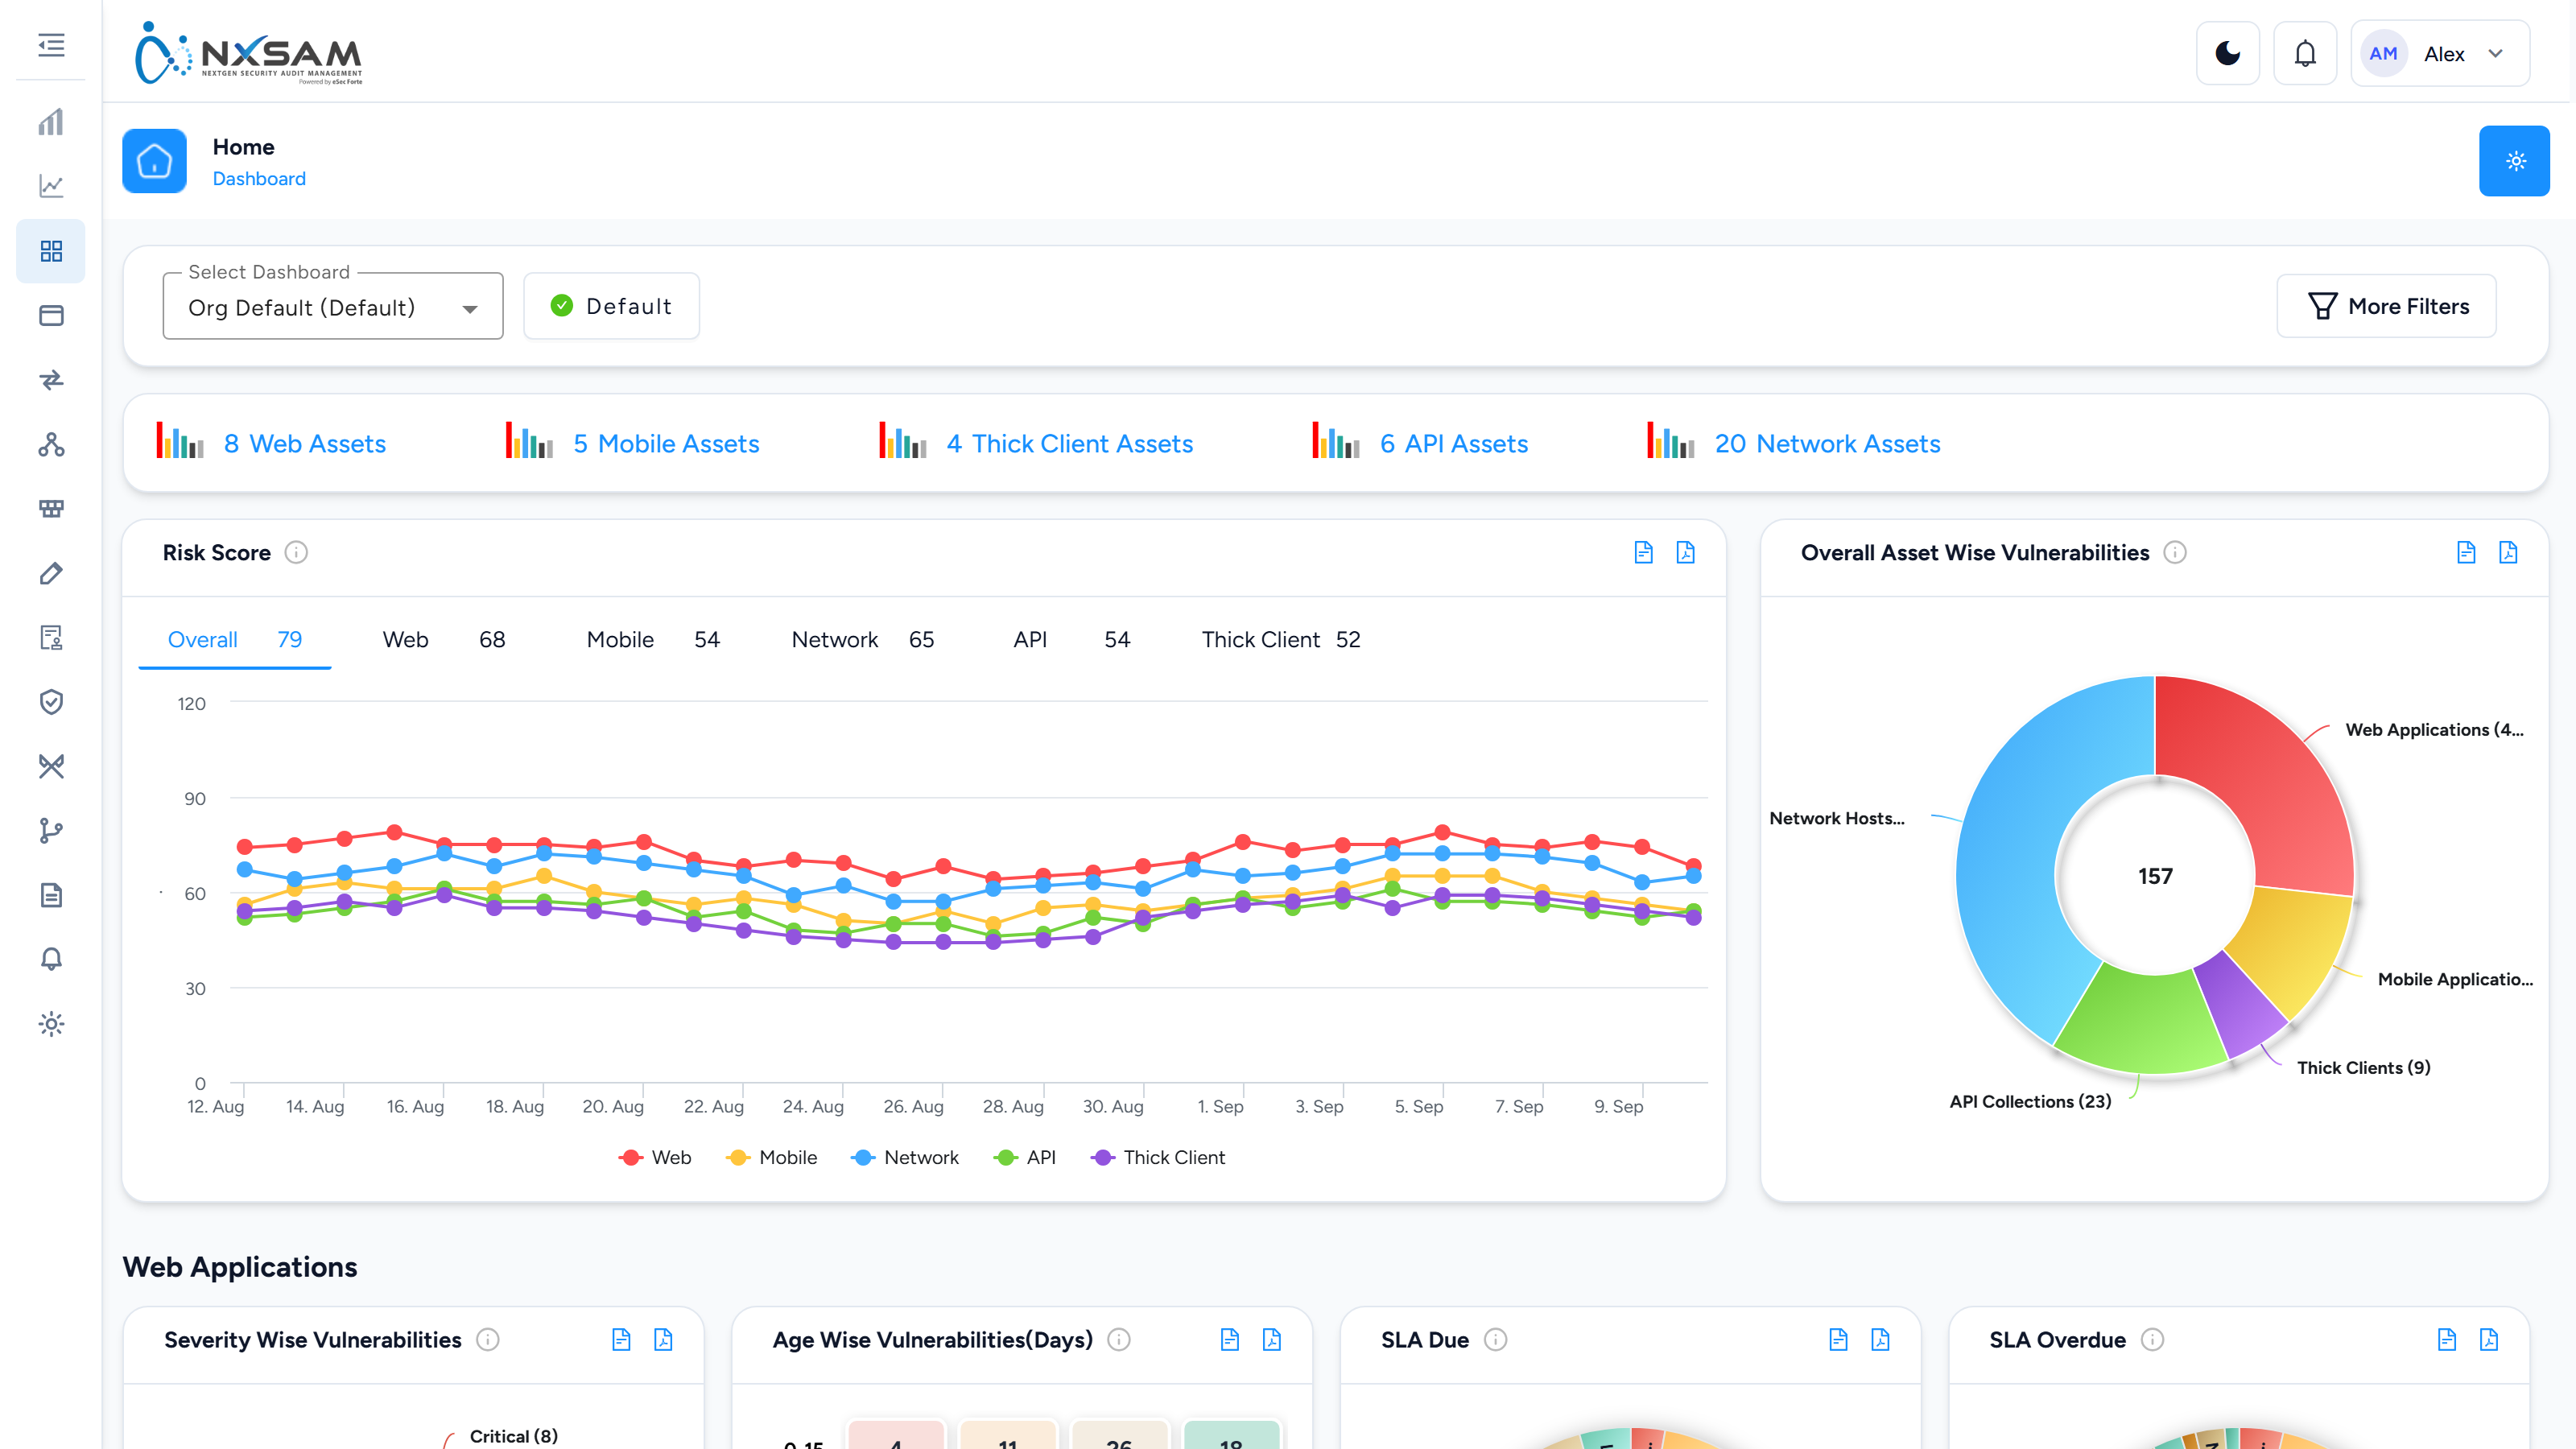
Asset Properties
Custom fields defined on assets — data classification, hosting region, compliance scope. They become filterable everywhere the asset appears.

Asset Sync Configuration
Maps a CMDB’s columns onto NxSAM’s asset fields, and sets the schedule. Where a sync is configured, treat the source system as authoritative.

Audit Calendar Planner
Assessment coverage planned across a period. Each plan shows how much of it has been done, so a plan nobody is executing is visible.
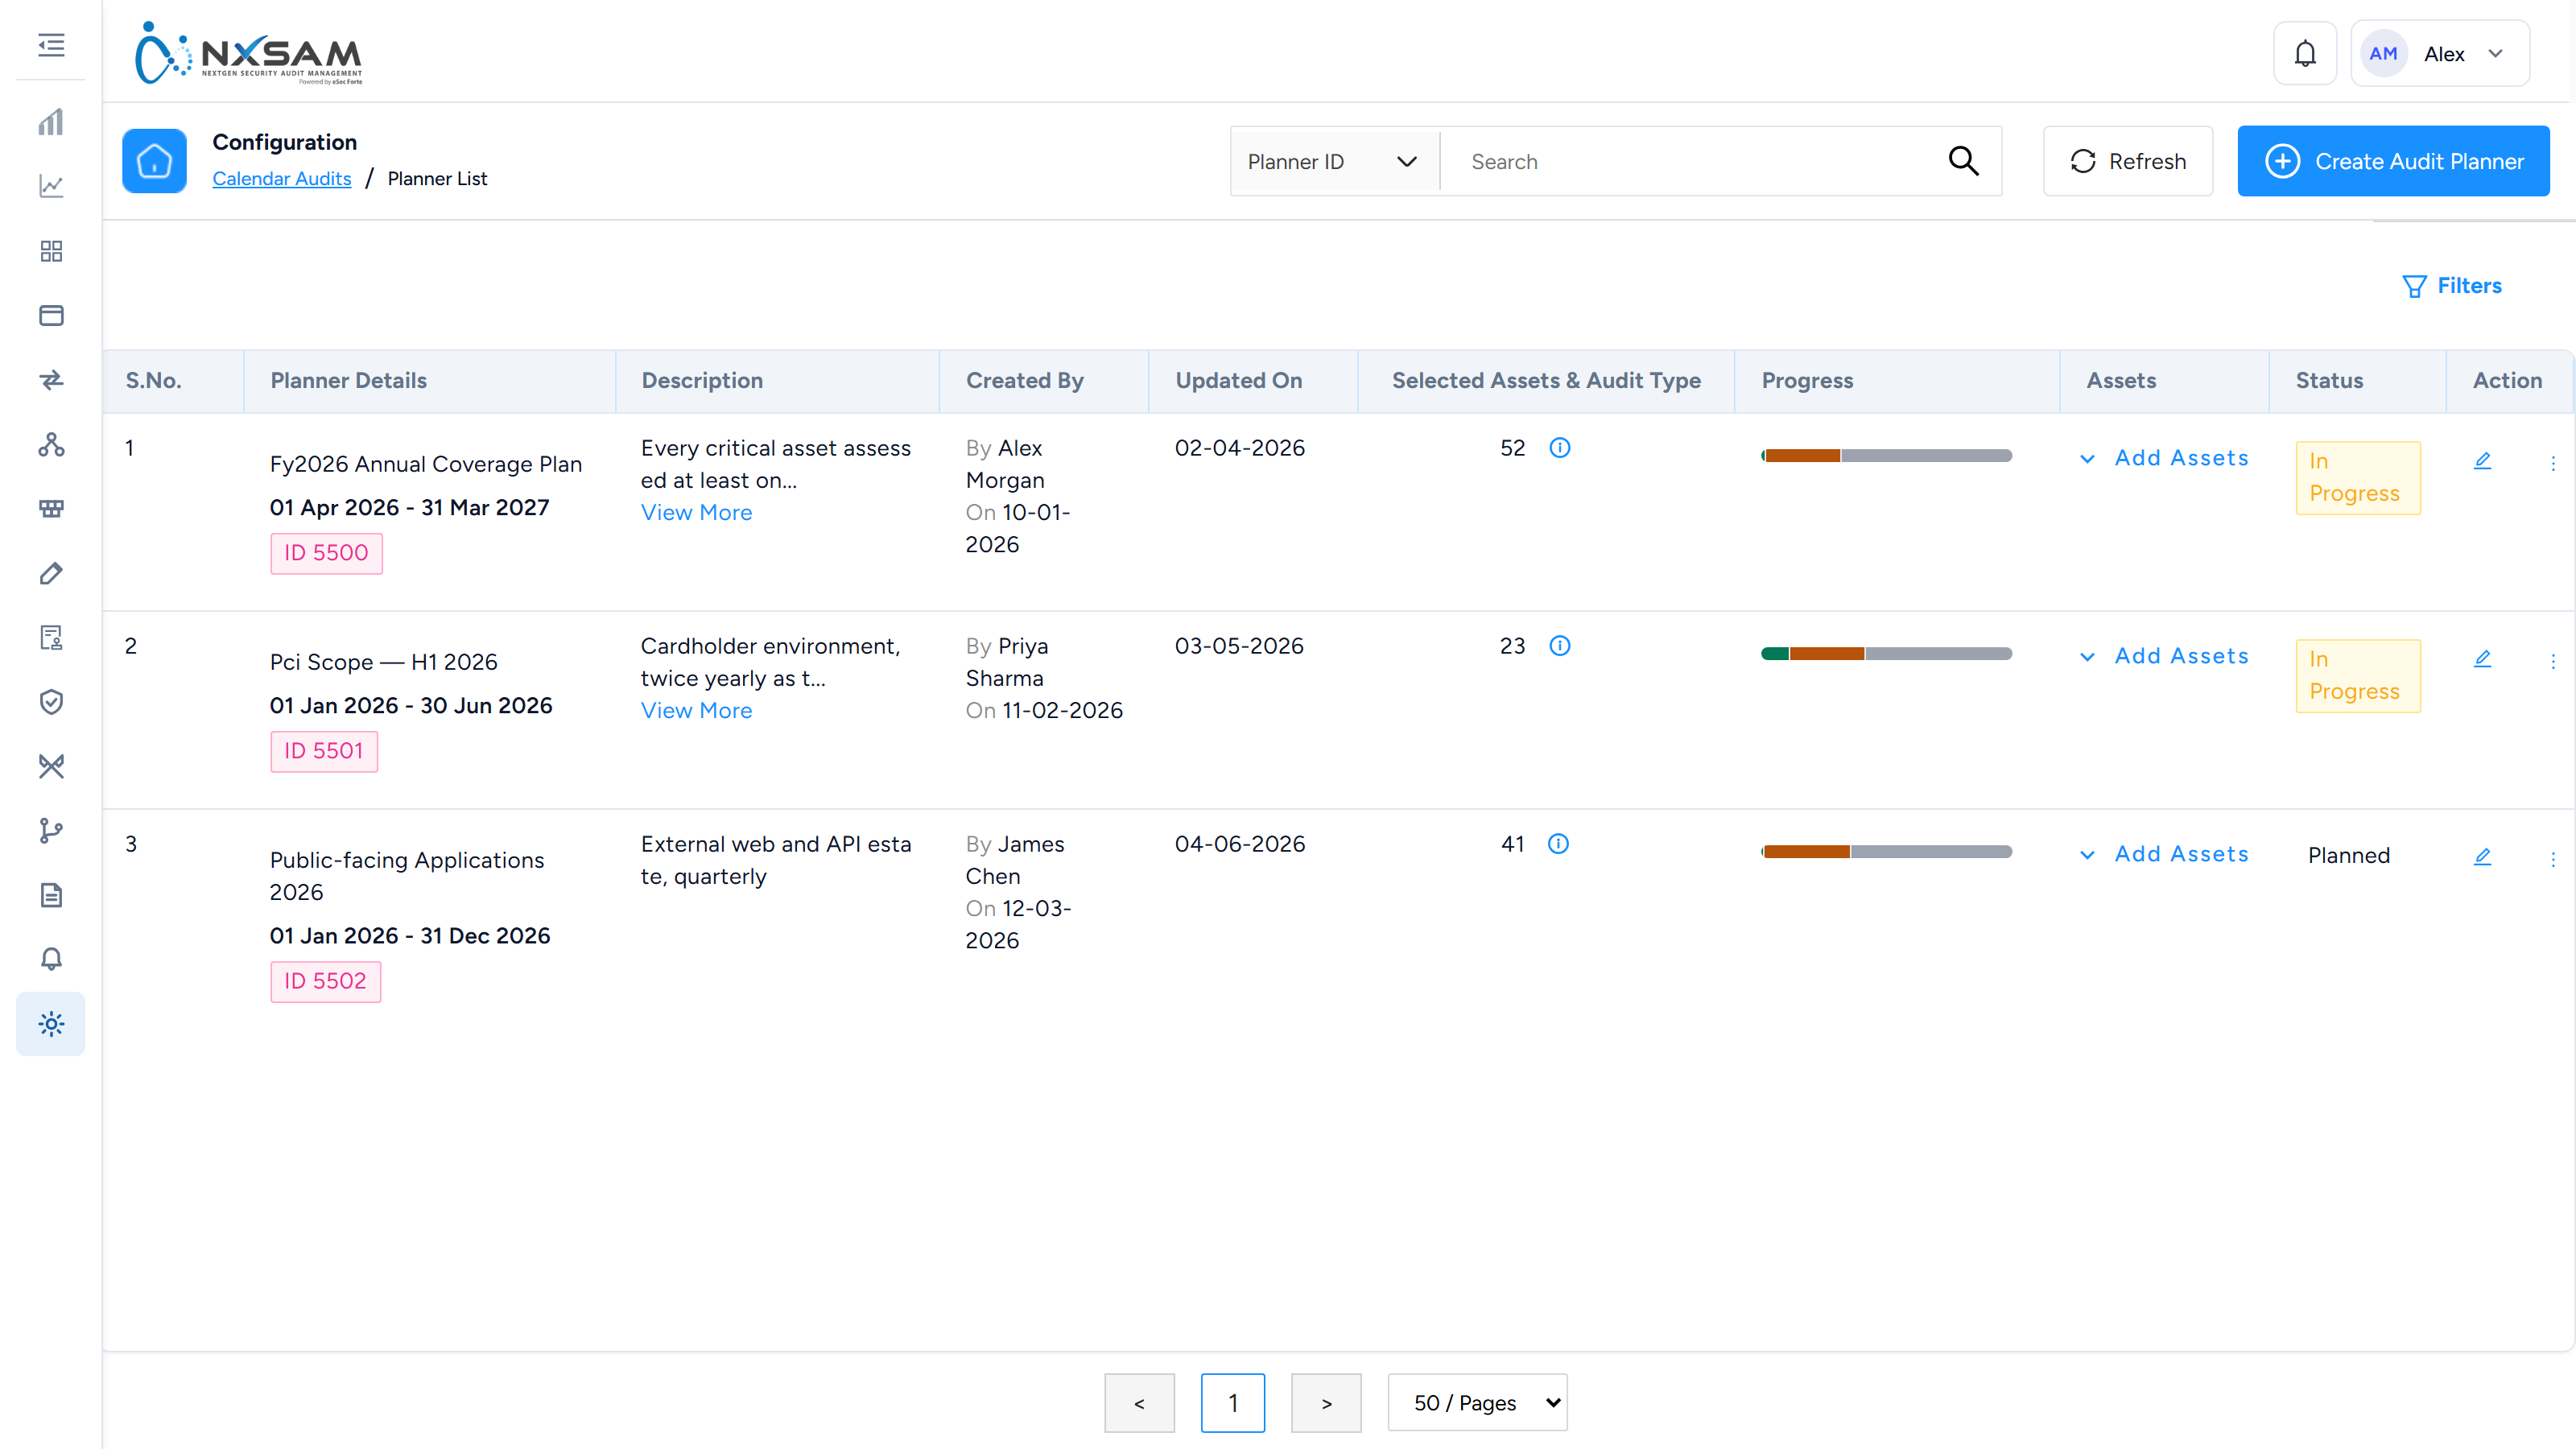
Business Units
The middle level of the grouping hierarchy. Every asset sits under a project, which sits under one of these.

Container Assets
Container images by repository and tag. A tag change is a different asset.
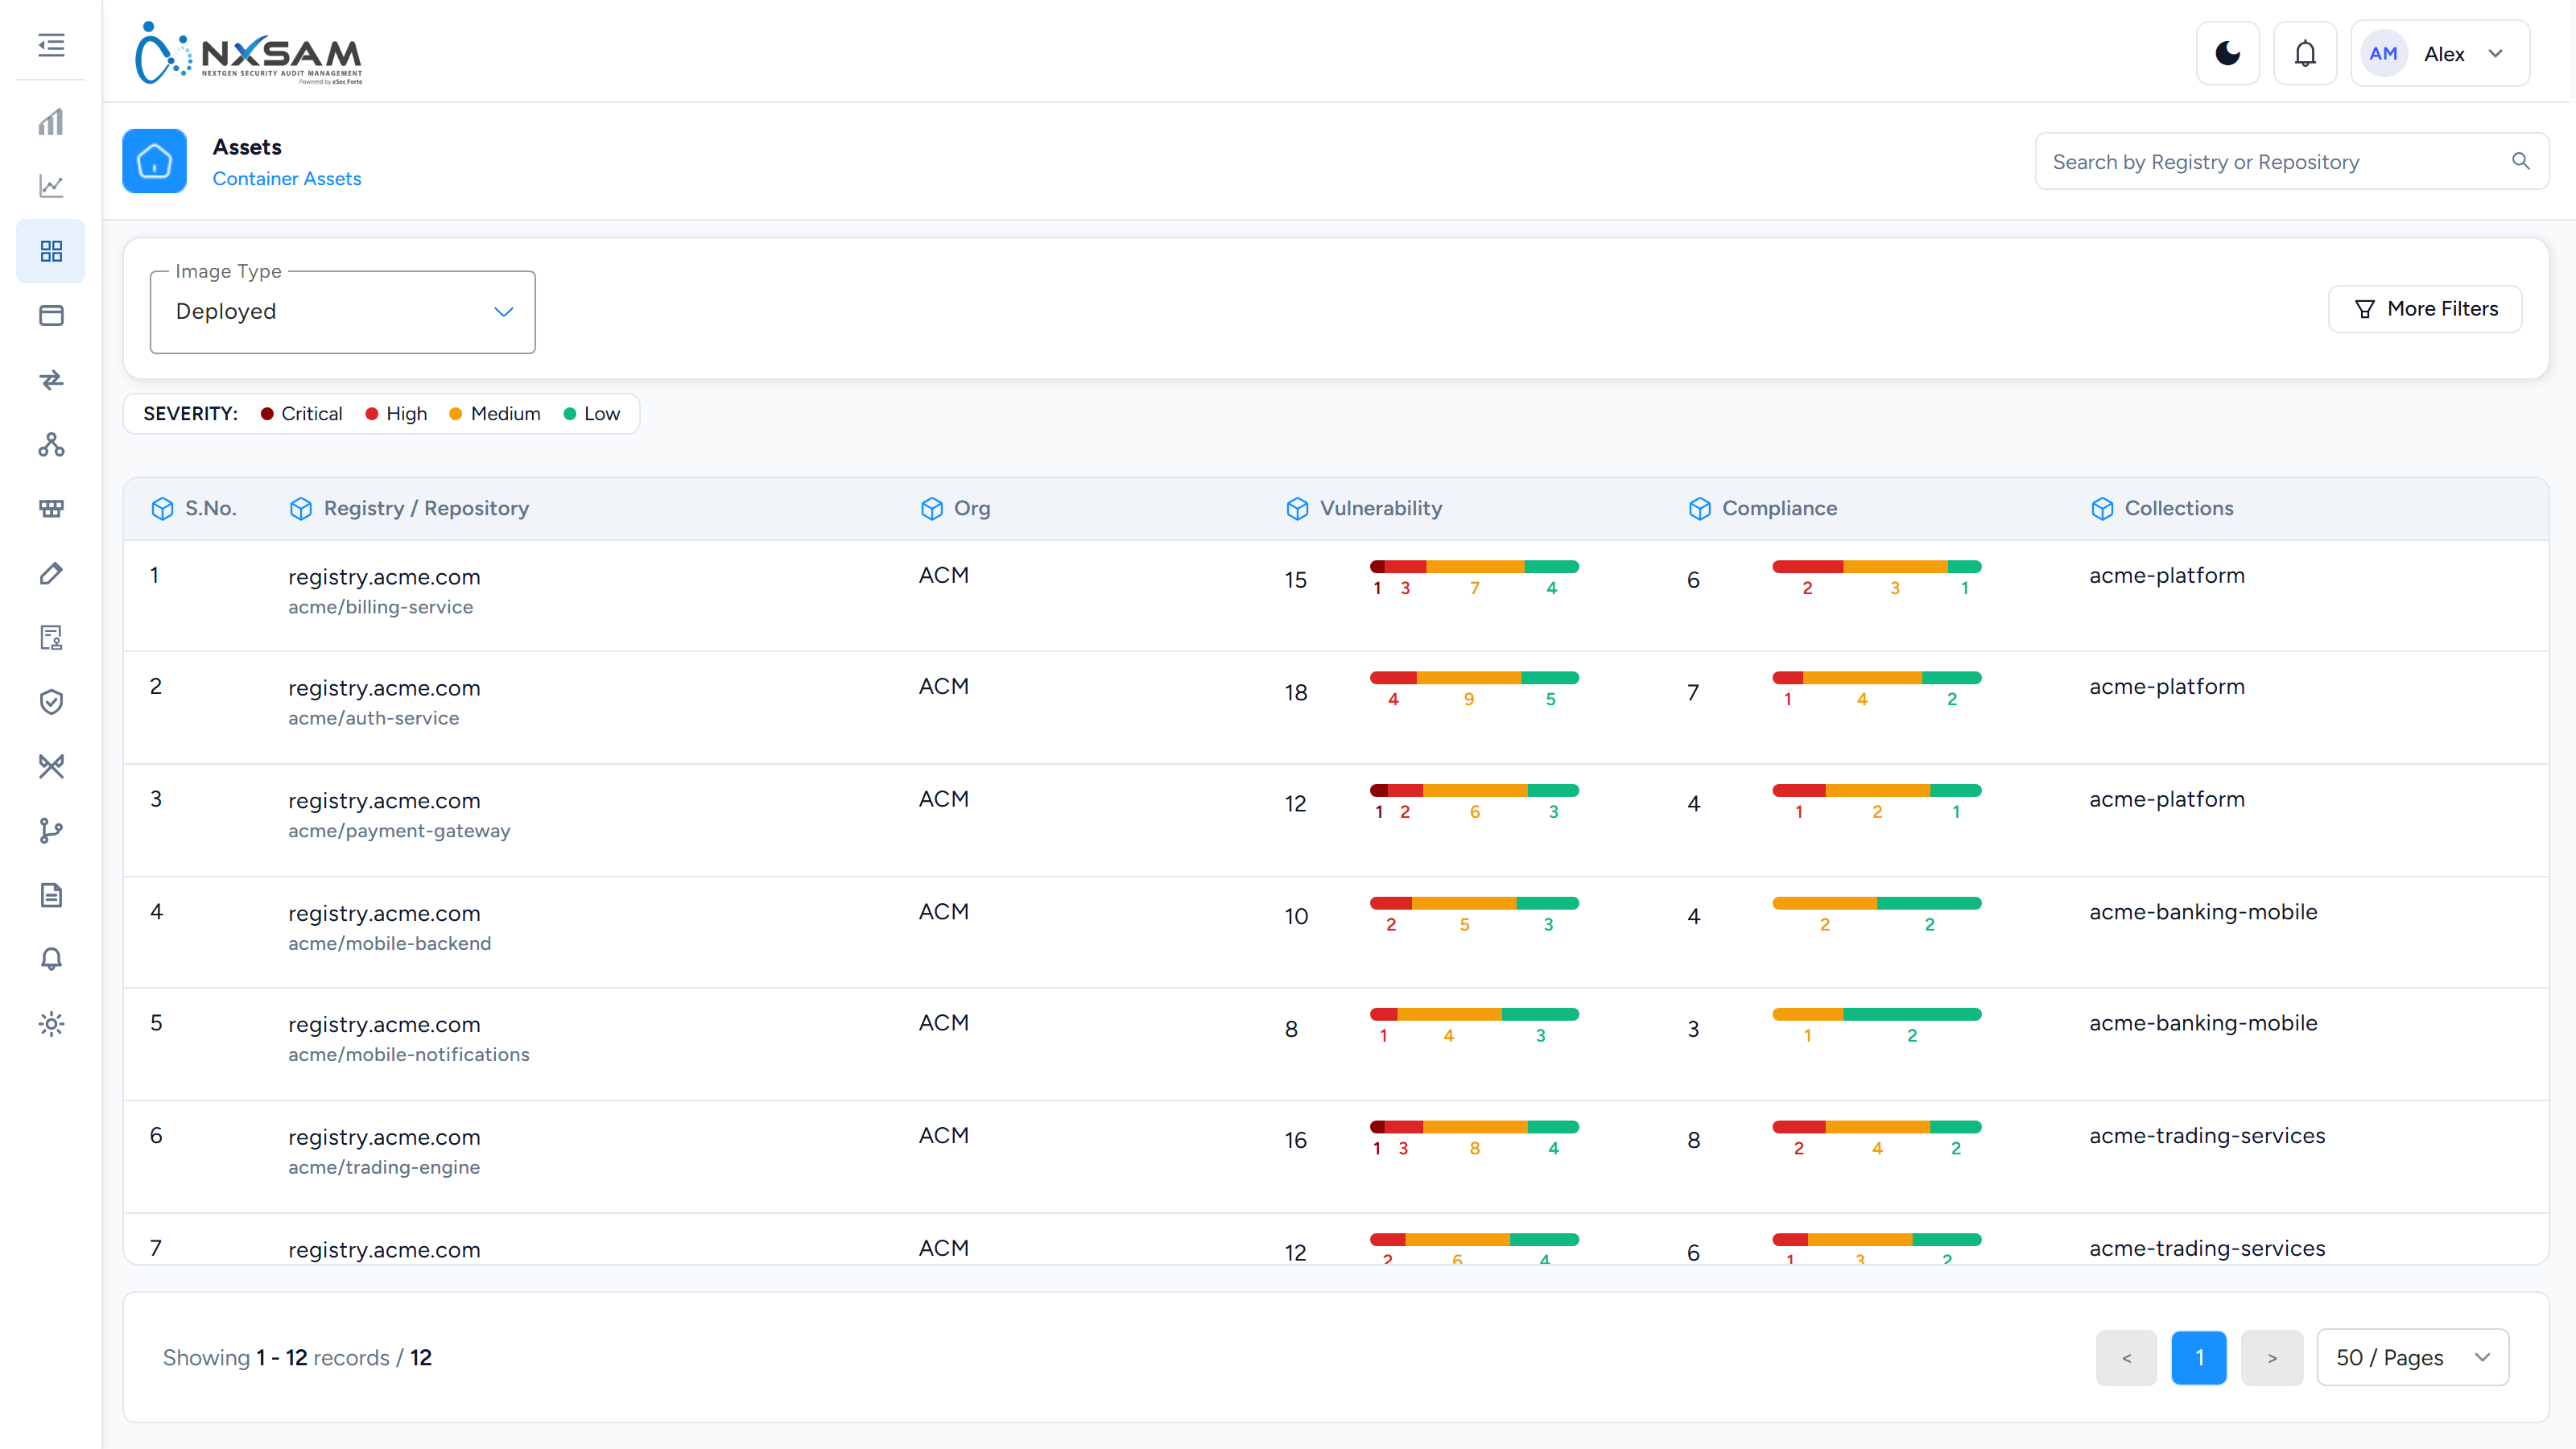
Manage Dashboard Views
Create and edit dashboard profiles — which sections and widgets appear, and the default filter applied.
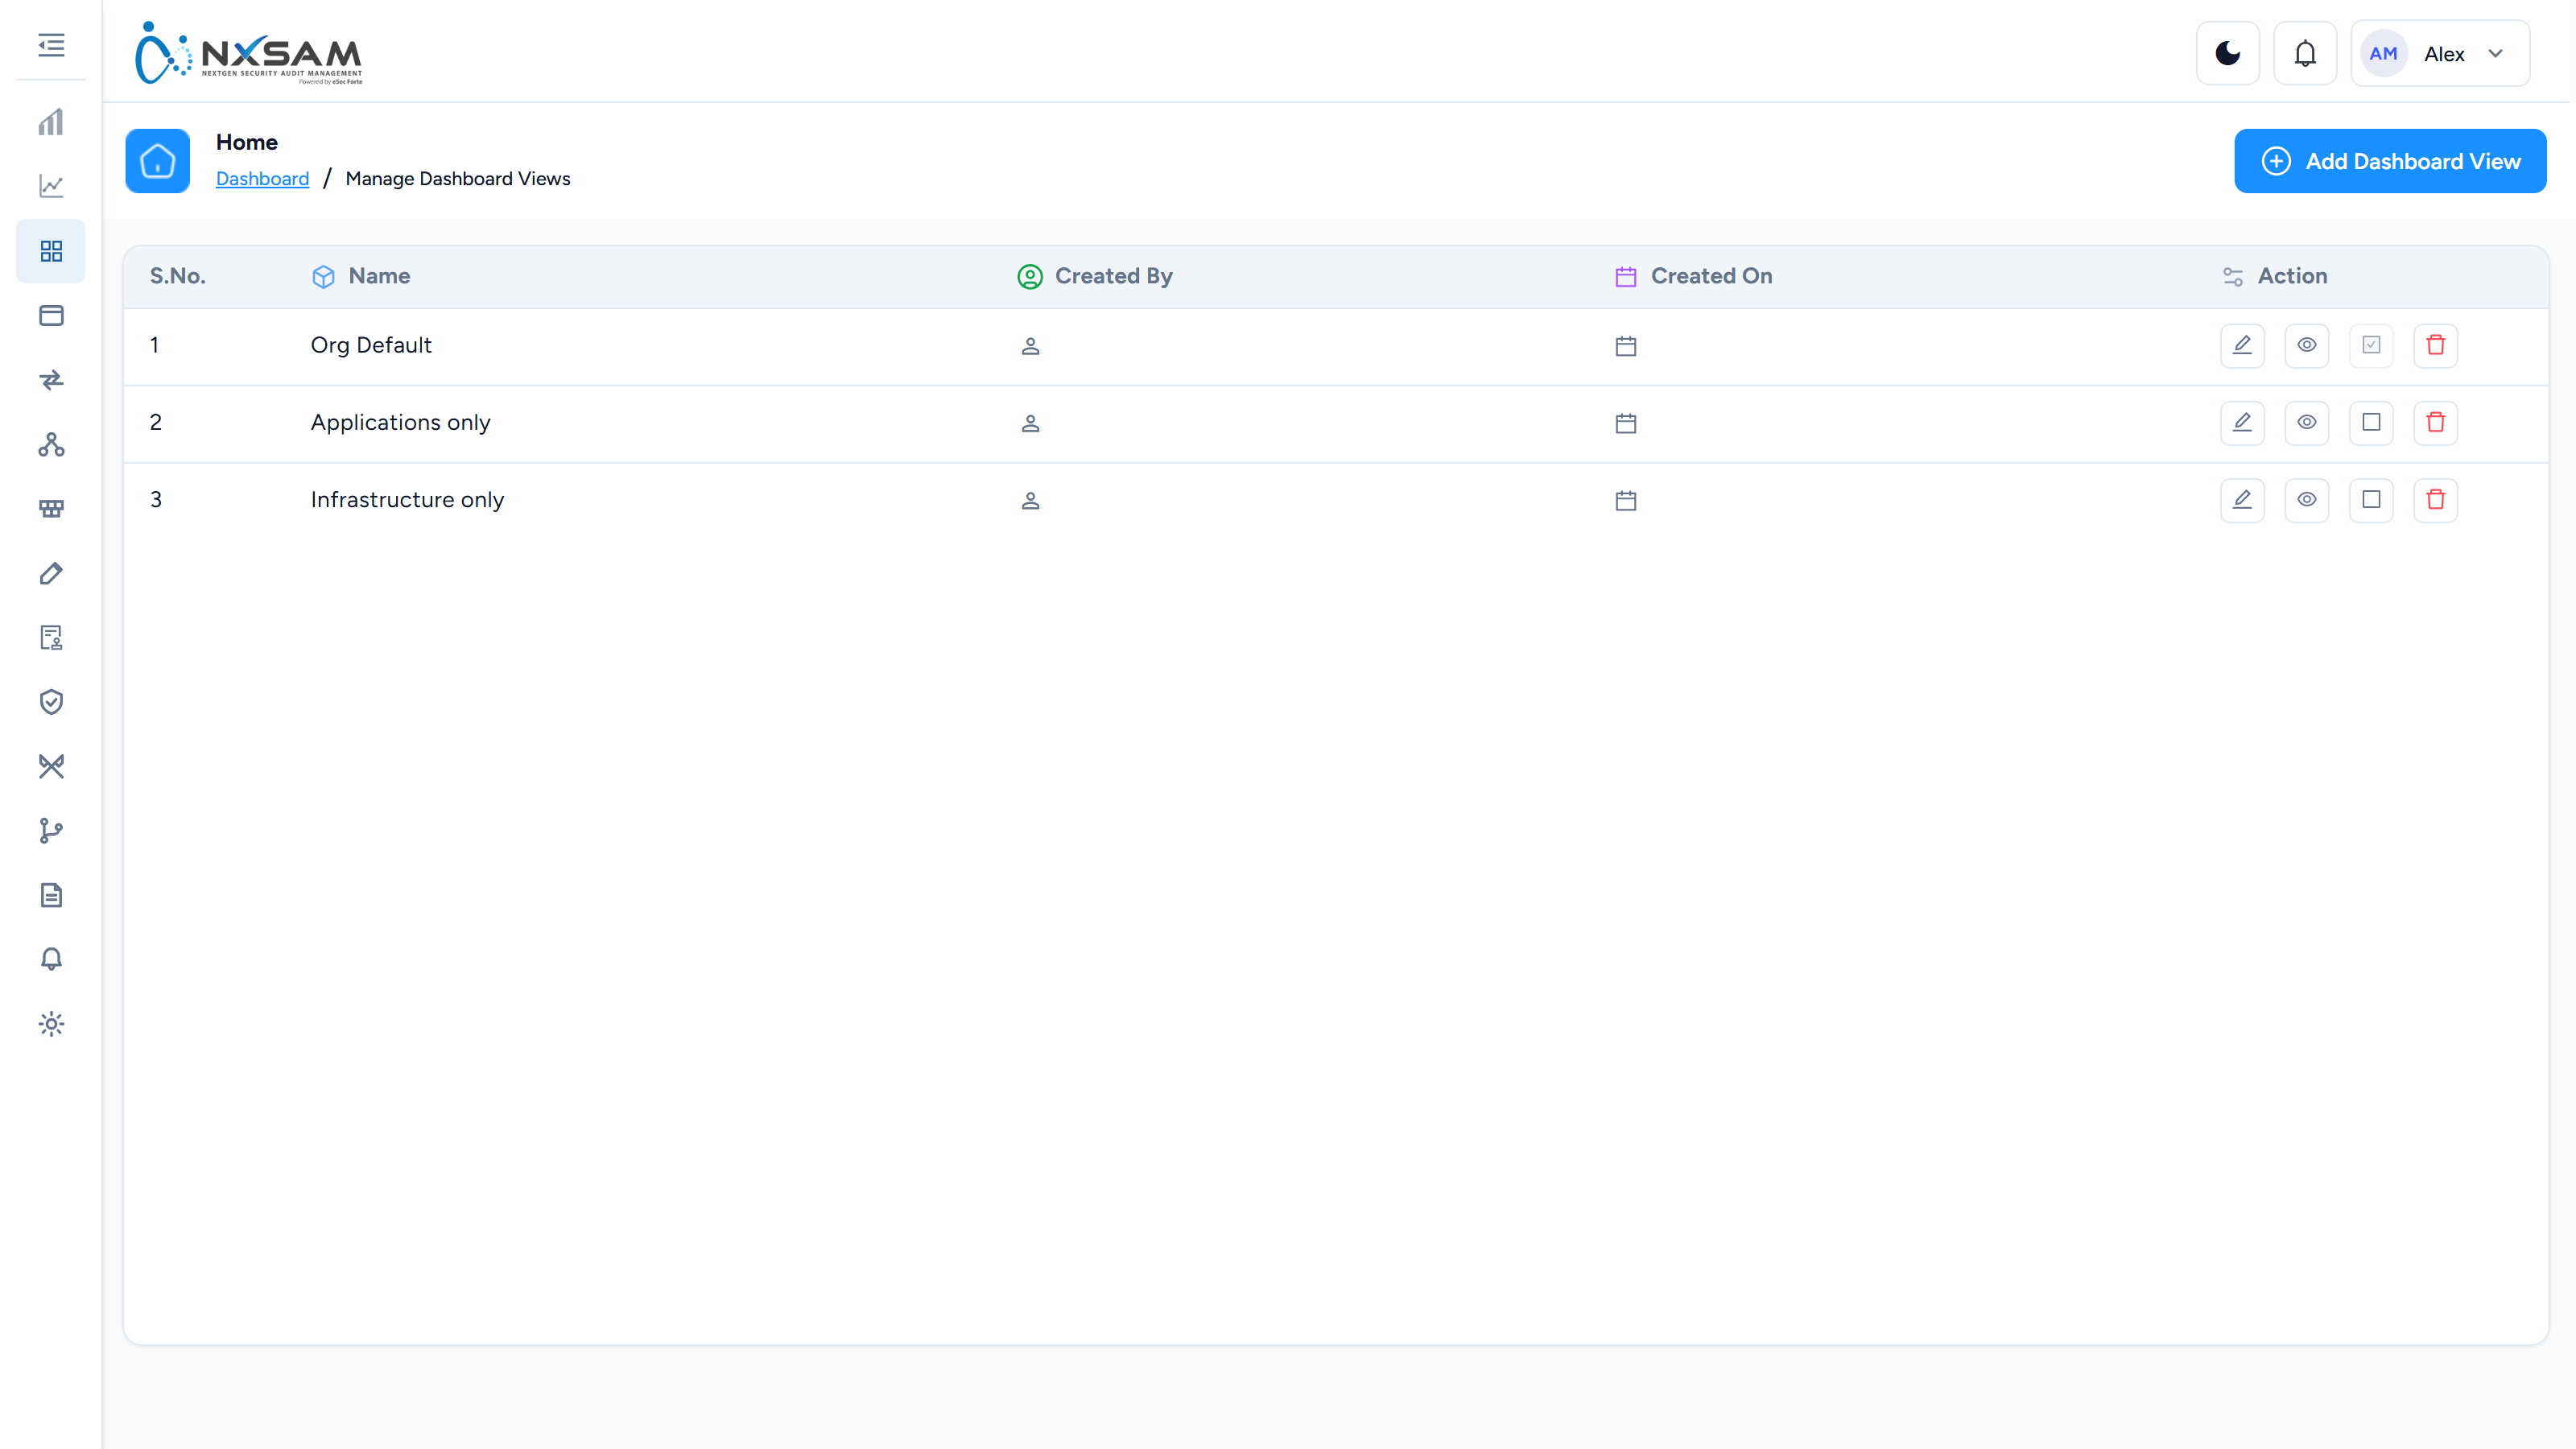
Mobile Applications
iOS and Android applications, identified by package or bundle rather than URL.
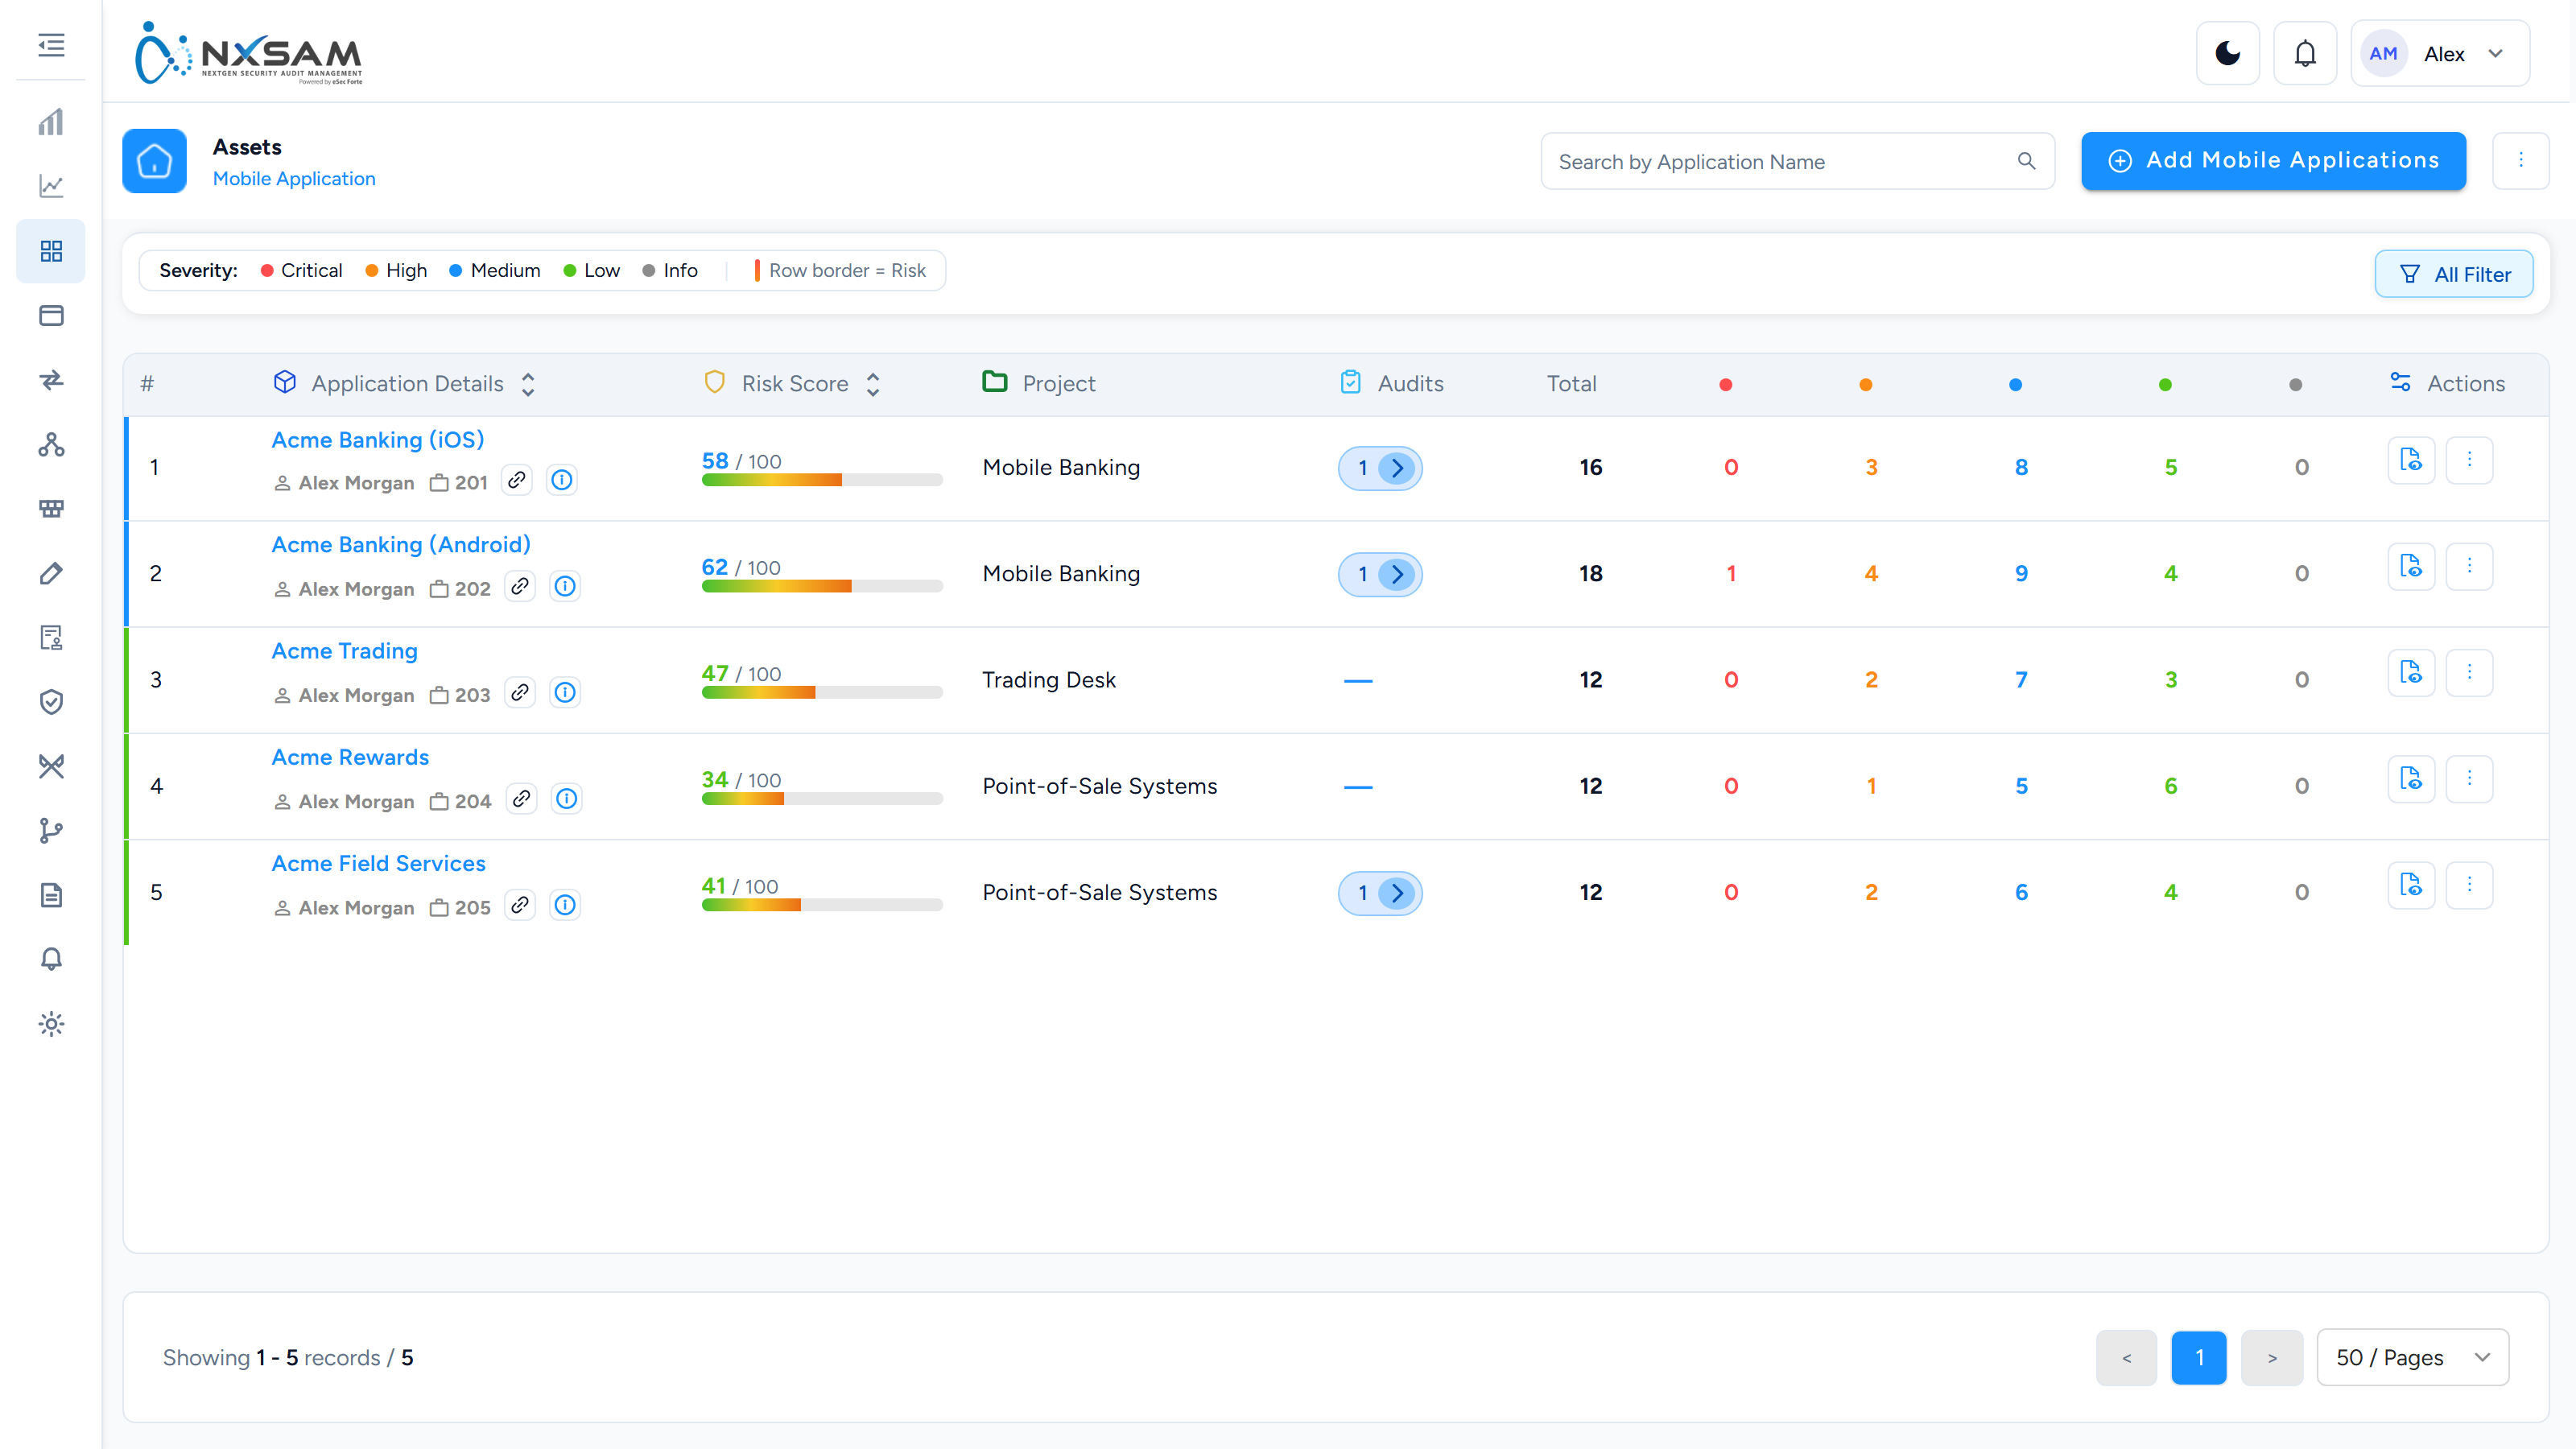
Network Asset Map
Relates network hosts to the applications running on them, so an application finding can be traced to its infrastructure.

Projects
The narrowest grouping level, and the one most reports group by.
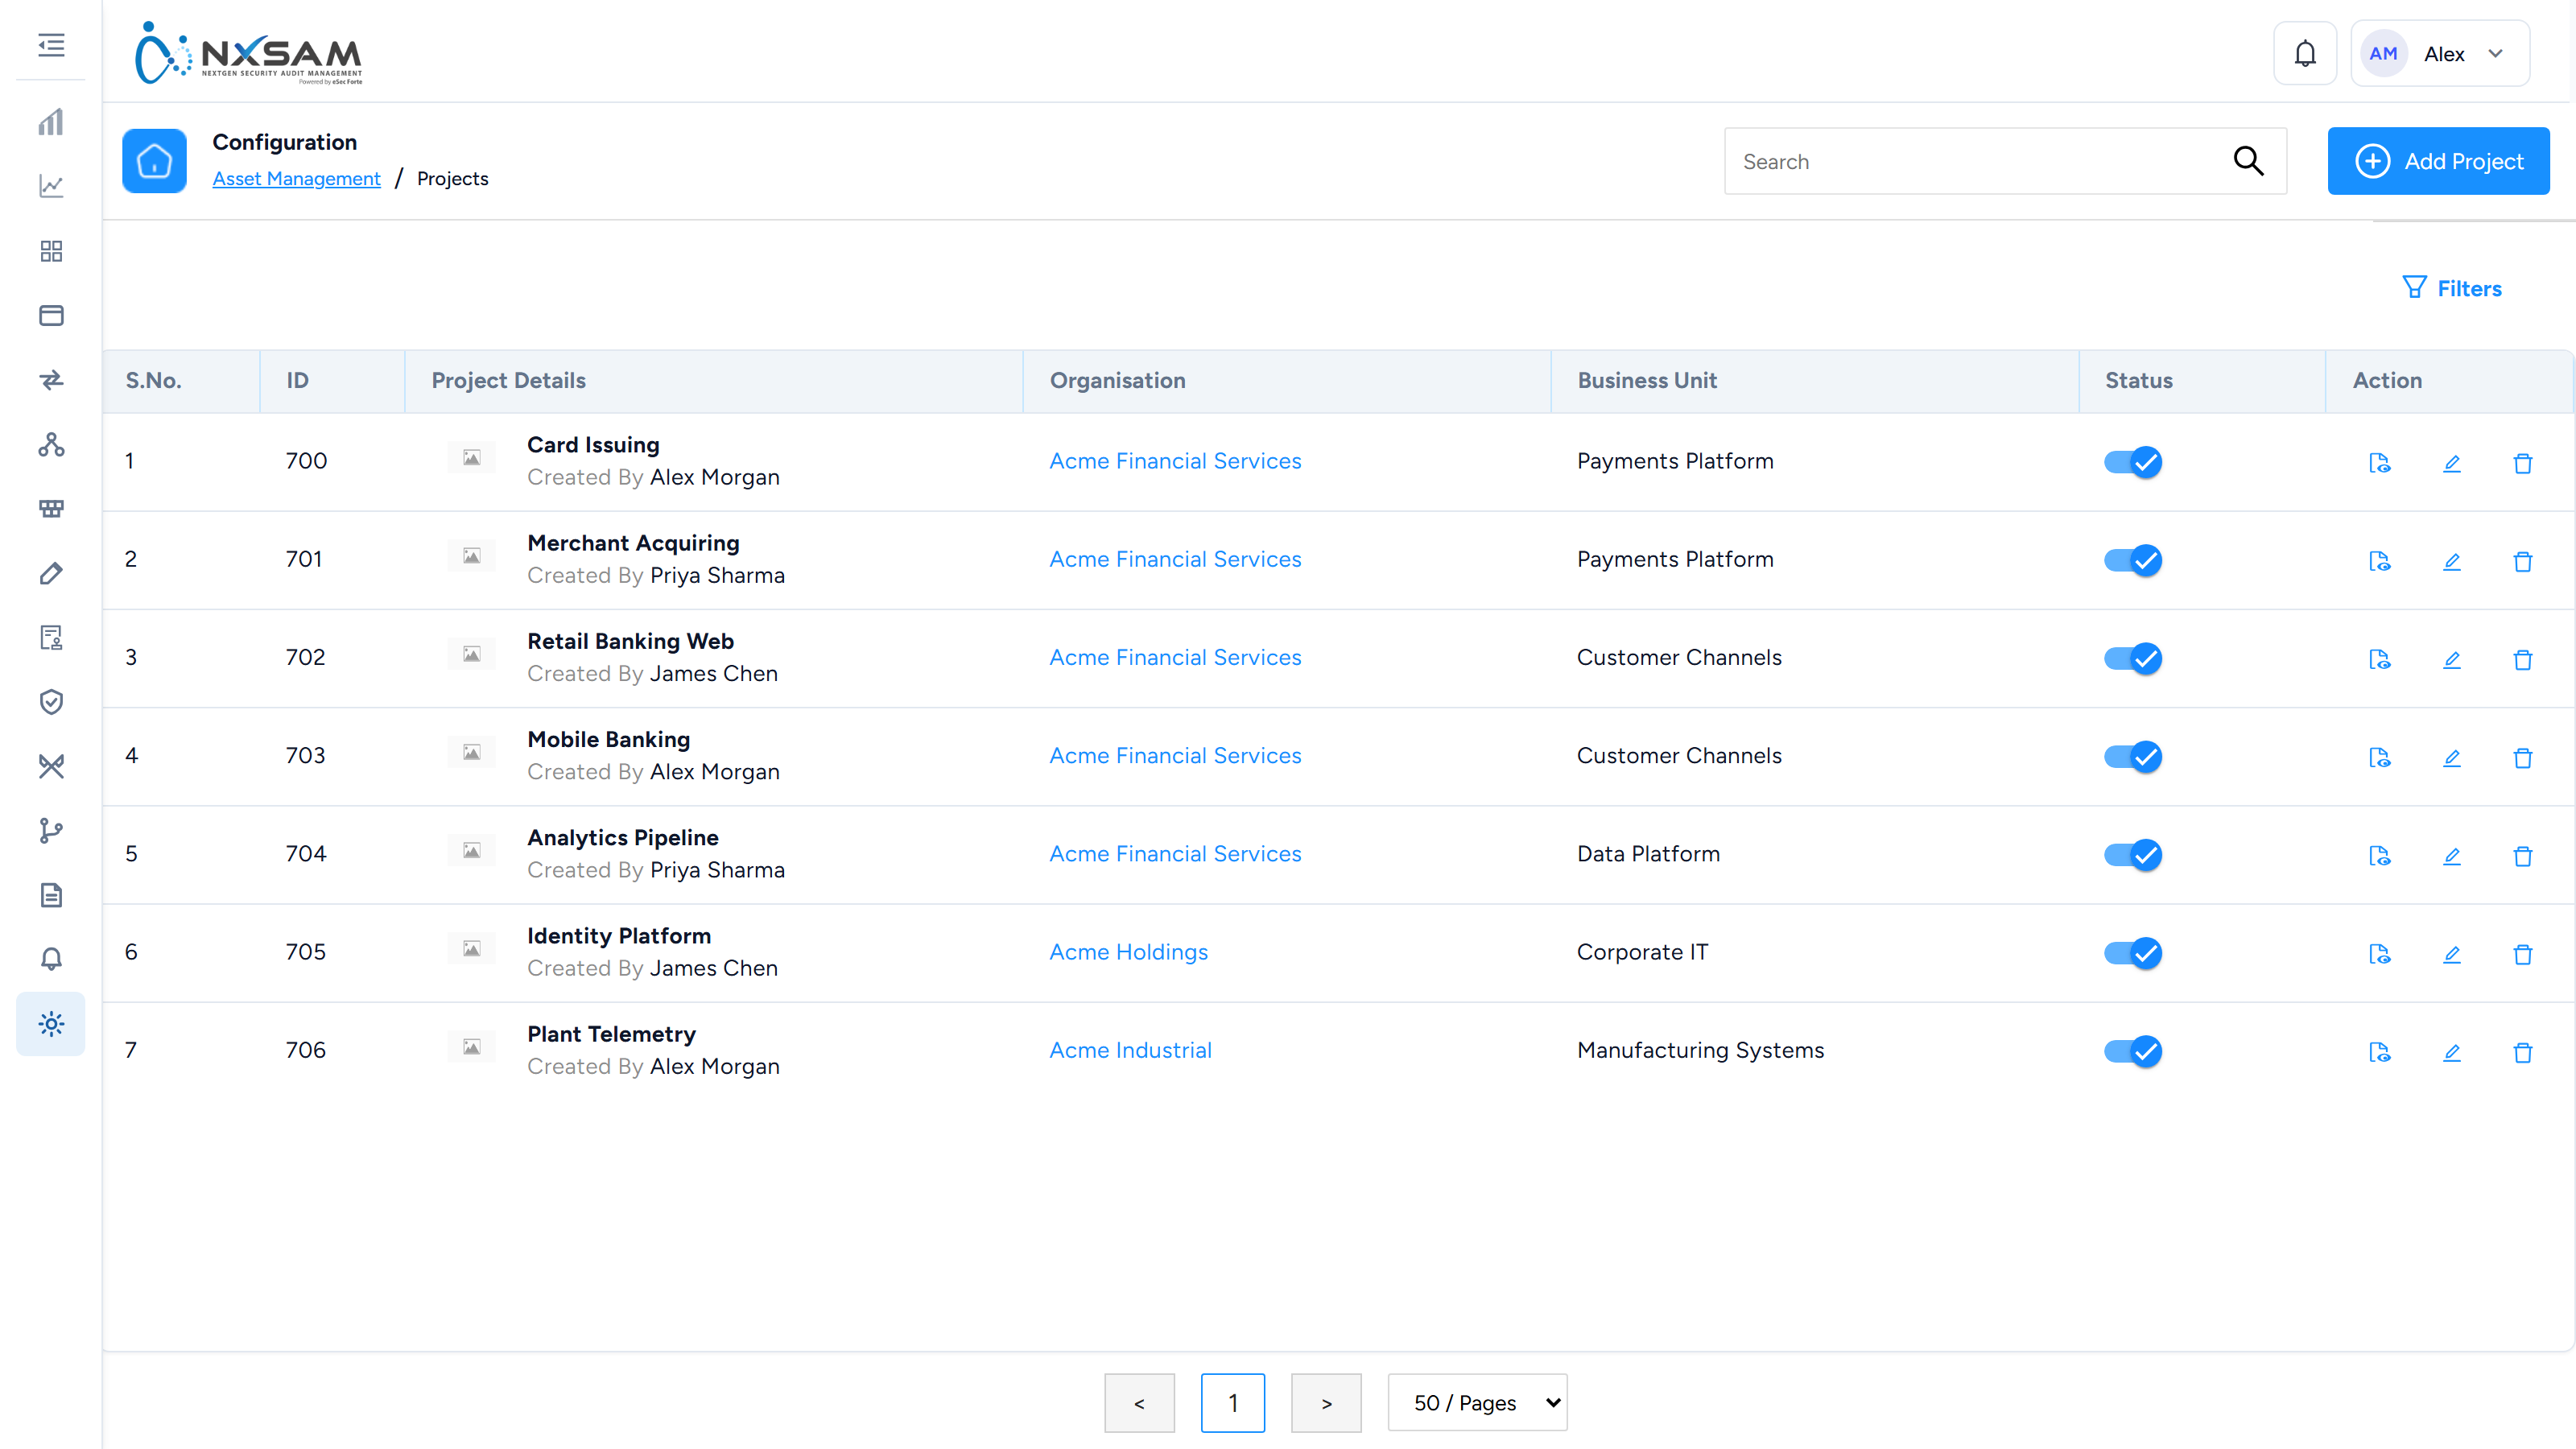
Thick Clients
Installed desktop software tracked as assets in their own right.
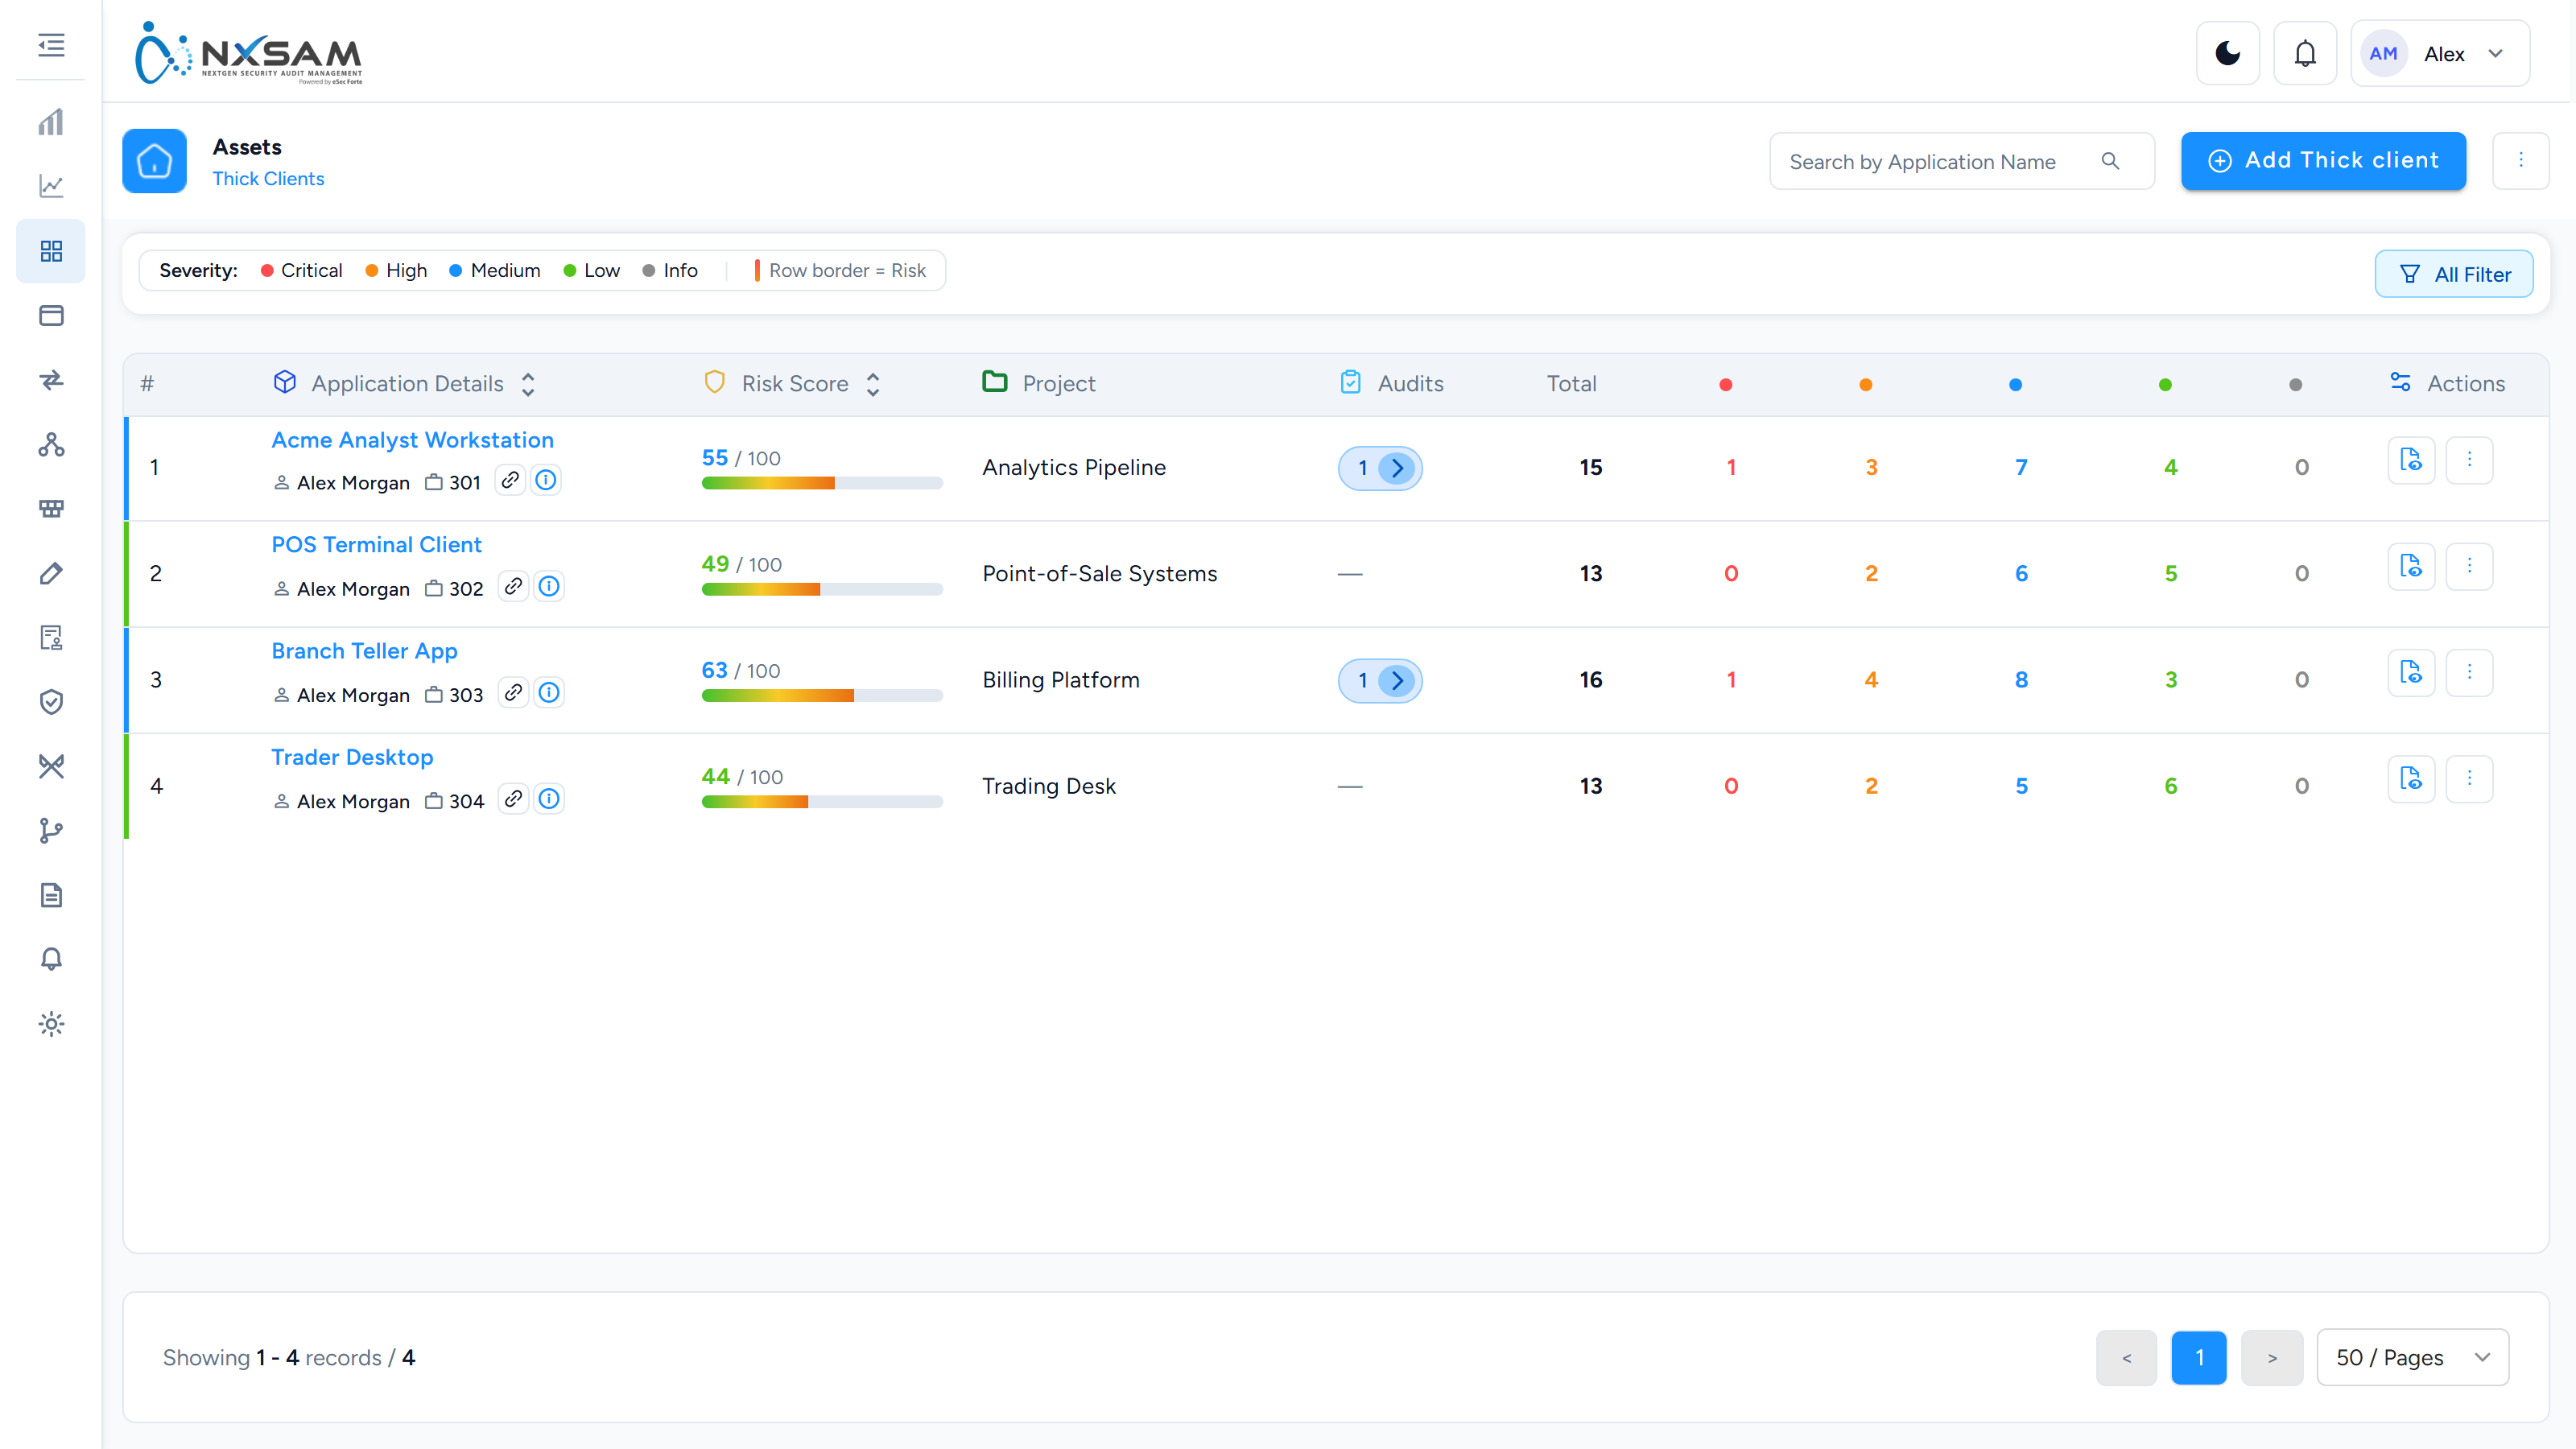
Web Applications
The web application inventory. One row per site or web-based system, with its URL and open findings.
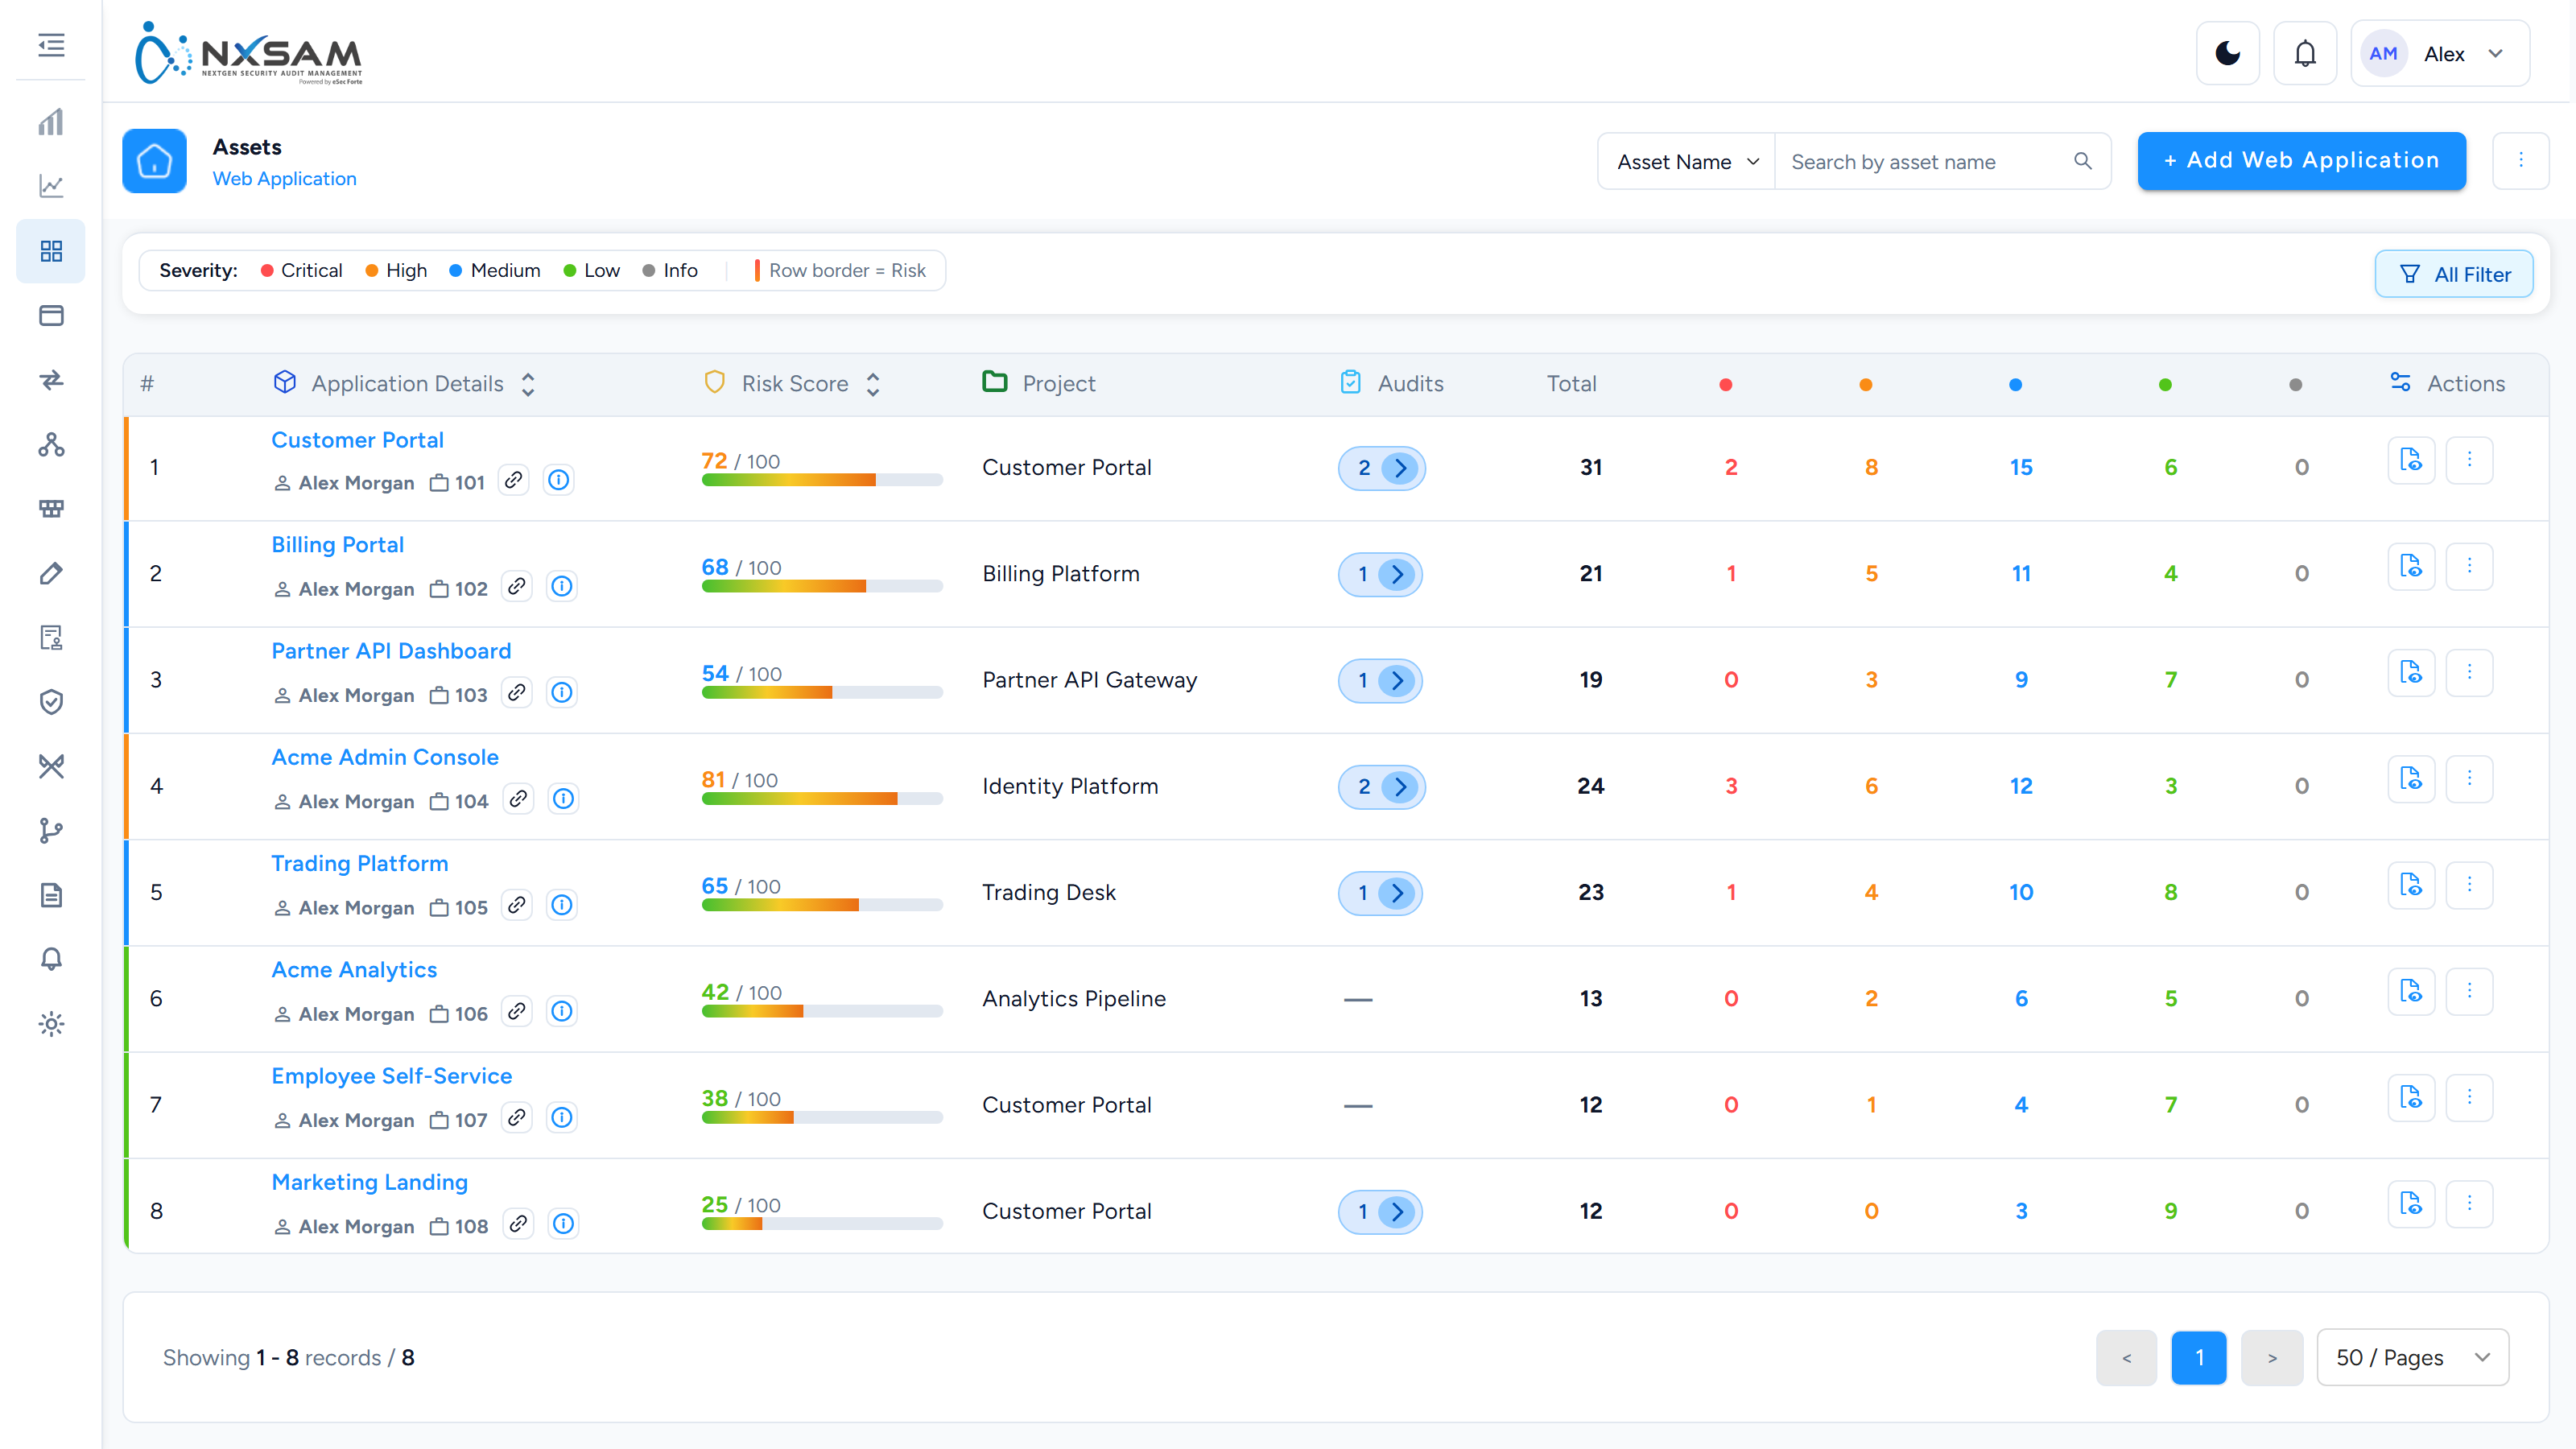
Assets: support reference
Internal. The customer-facing explanation is in the screen reference and Organising the inventory.
Assets is the largest module in the product and the one every other module depends on. An asset problem usually presents as a problem somewhere else — a finding with no owner, a dashboard missing a business unit, a report that omits a system.
Six asset types, one module
Web, Mobile, API, Network, Thick Client and Container Image are separate inventories with separate columns, separate limits and separate onboarding. A caller saying "the asset isn't there" needs the type established first; the screens look similar enough that people search the wrong one.
Licensed limits
Each client has a ceiling per asset type. Reaching it during a bulk import produces a partial inventory — some rows land, the rest do not — and the reconciliation afterwards is manual.
Check the limits before any large onboarding. This is the one asset problem that is much cheaper to prevent than to unpick.
Ownership is visibility
An owner sees their assets and the findings on them. Two consequences:
- A departed user still owning assets means nobody is receiving those notifications.
- Reassignment is done from the user, not asset by asset. Doing it per asset is the slow path and the one that leaves orphans.
"I can't see an asset I'm sure exists" is frequently ownership or collection scope rather than a missing record.
Asset properties feed more than the asset screen
Properties are configured per asset type and drive:
- SLA duration — narrowed by property, so an internet-facing production system can carry a shorter deadline than the same severity internally.
- Risk score — an estate with risk-score properties unset produces a score that is severity with extra steps, and a "top risky assets" list that ranks nothing.
A customer whose SLA dates changed with no data change has usually had a property or an SLA duration edited.
Deletion and decommissioning
Deletion hides rather than removes. A deleted asset can still be named on historical findings and on reports already generated — that is the design, and it is the answer to "I deleted it and it is still in the report".
Decommissioning is the deliberate route for an asset that is genuinely gone: it keeps the history and stops the asset counting as live coverage.
Sync configuration
Assets can arrive from integrations as well as by hand. Integration-created assets carry whatever the tool knew, which is less than a person would have entered — missing business unit, owner and criticality are the norm rather than a fault.
If an inventory fills with unfamiliar assets after an integration is connected, the control is the integration's scope.
Coverage gaps are invisible from inside the module
An asset in NxSAM that no tool scans looks identical to one that is clean. The Tenable IO comparison is the only place that shows the difference between the two inventories — see per-tool setup.
A tidy inventory with no findings is not necessarily a healthy estate.
What to collect before escalating
- Asset type and the exact asset name or address.
- The client, and the collection or group scope the caller is working in.
- Whether the asset was created by hand, by import or by an integration.
- For "missing" assets: whether it is deleted, decommissioned, or simply outside the caller's ownership.
- For SLA surprises: which properties and SLA durations were last edited, and when.
Application Security
Application Security
Application Security covers weaknesses in software your organisation builds or runs — web applications, mobile apps and thick clients. Findings arrive from code scanners, dynamic scanners and manual testing, and are tracked together against the application they affect.
Where findings come from
| Kind | Tools | What they see |
|---|---|---|
| Static (SAST) | Checkmarx, Fortify, Snyk Code | The source code. Finds flaws before the application runs. |
| Dynamic (DAST) | Burp Suite, Netsparker, Acunetix, AppScan | The running application, from the outside. |
| Composition (SCA) | Checkmarx SCA, Dependency Track, JFrog Xray | Third-party libraries and their known vulnerabilities. |
| Secrets | Gitleaks | Credentials committed into source control. |
| Manual | Your own testers | Anything the tools miss — logic flaws in particular. |
The same application usually has findings from several of these at once, which is the point: they see different things, and no single tool is sufficient.
Applications and audits
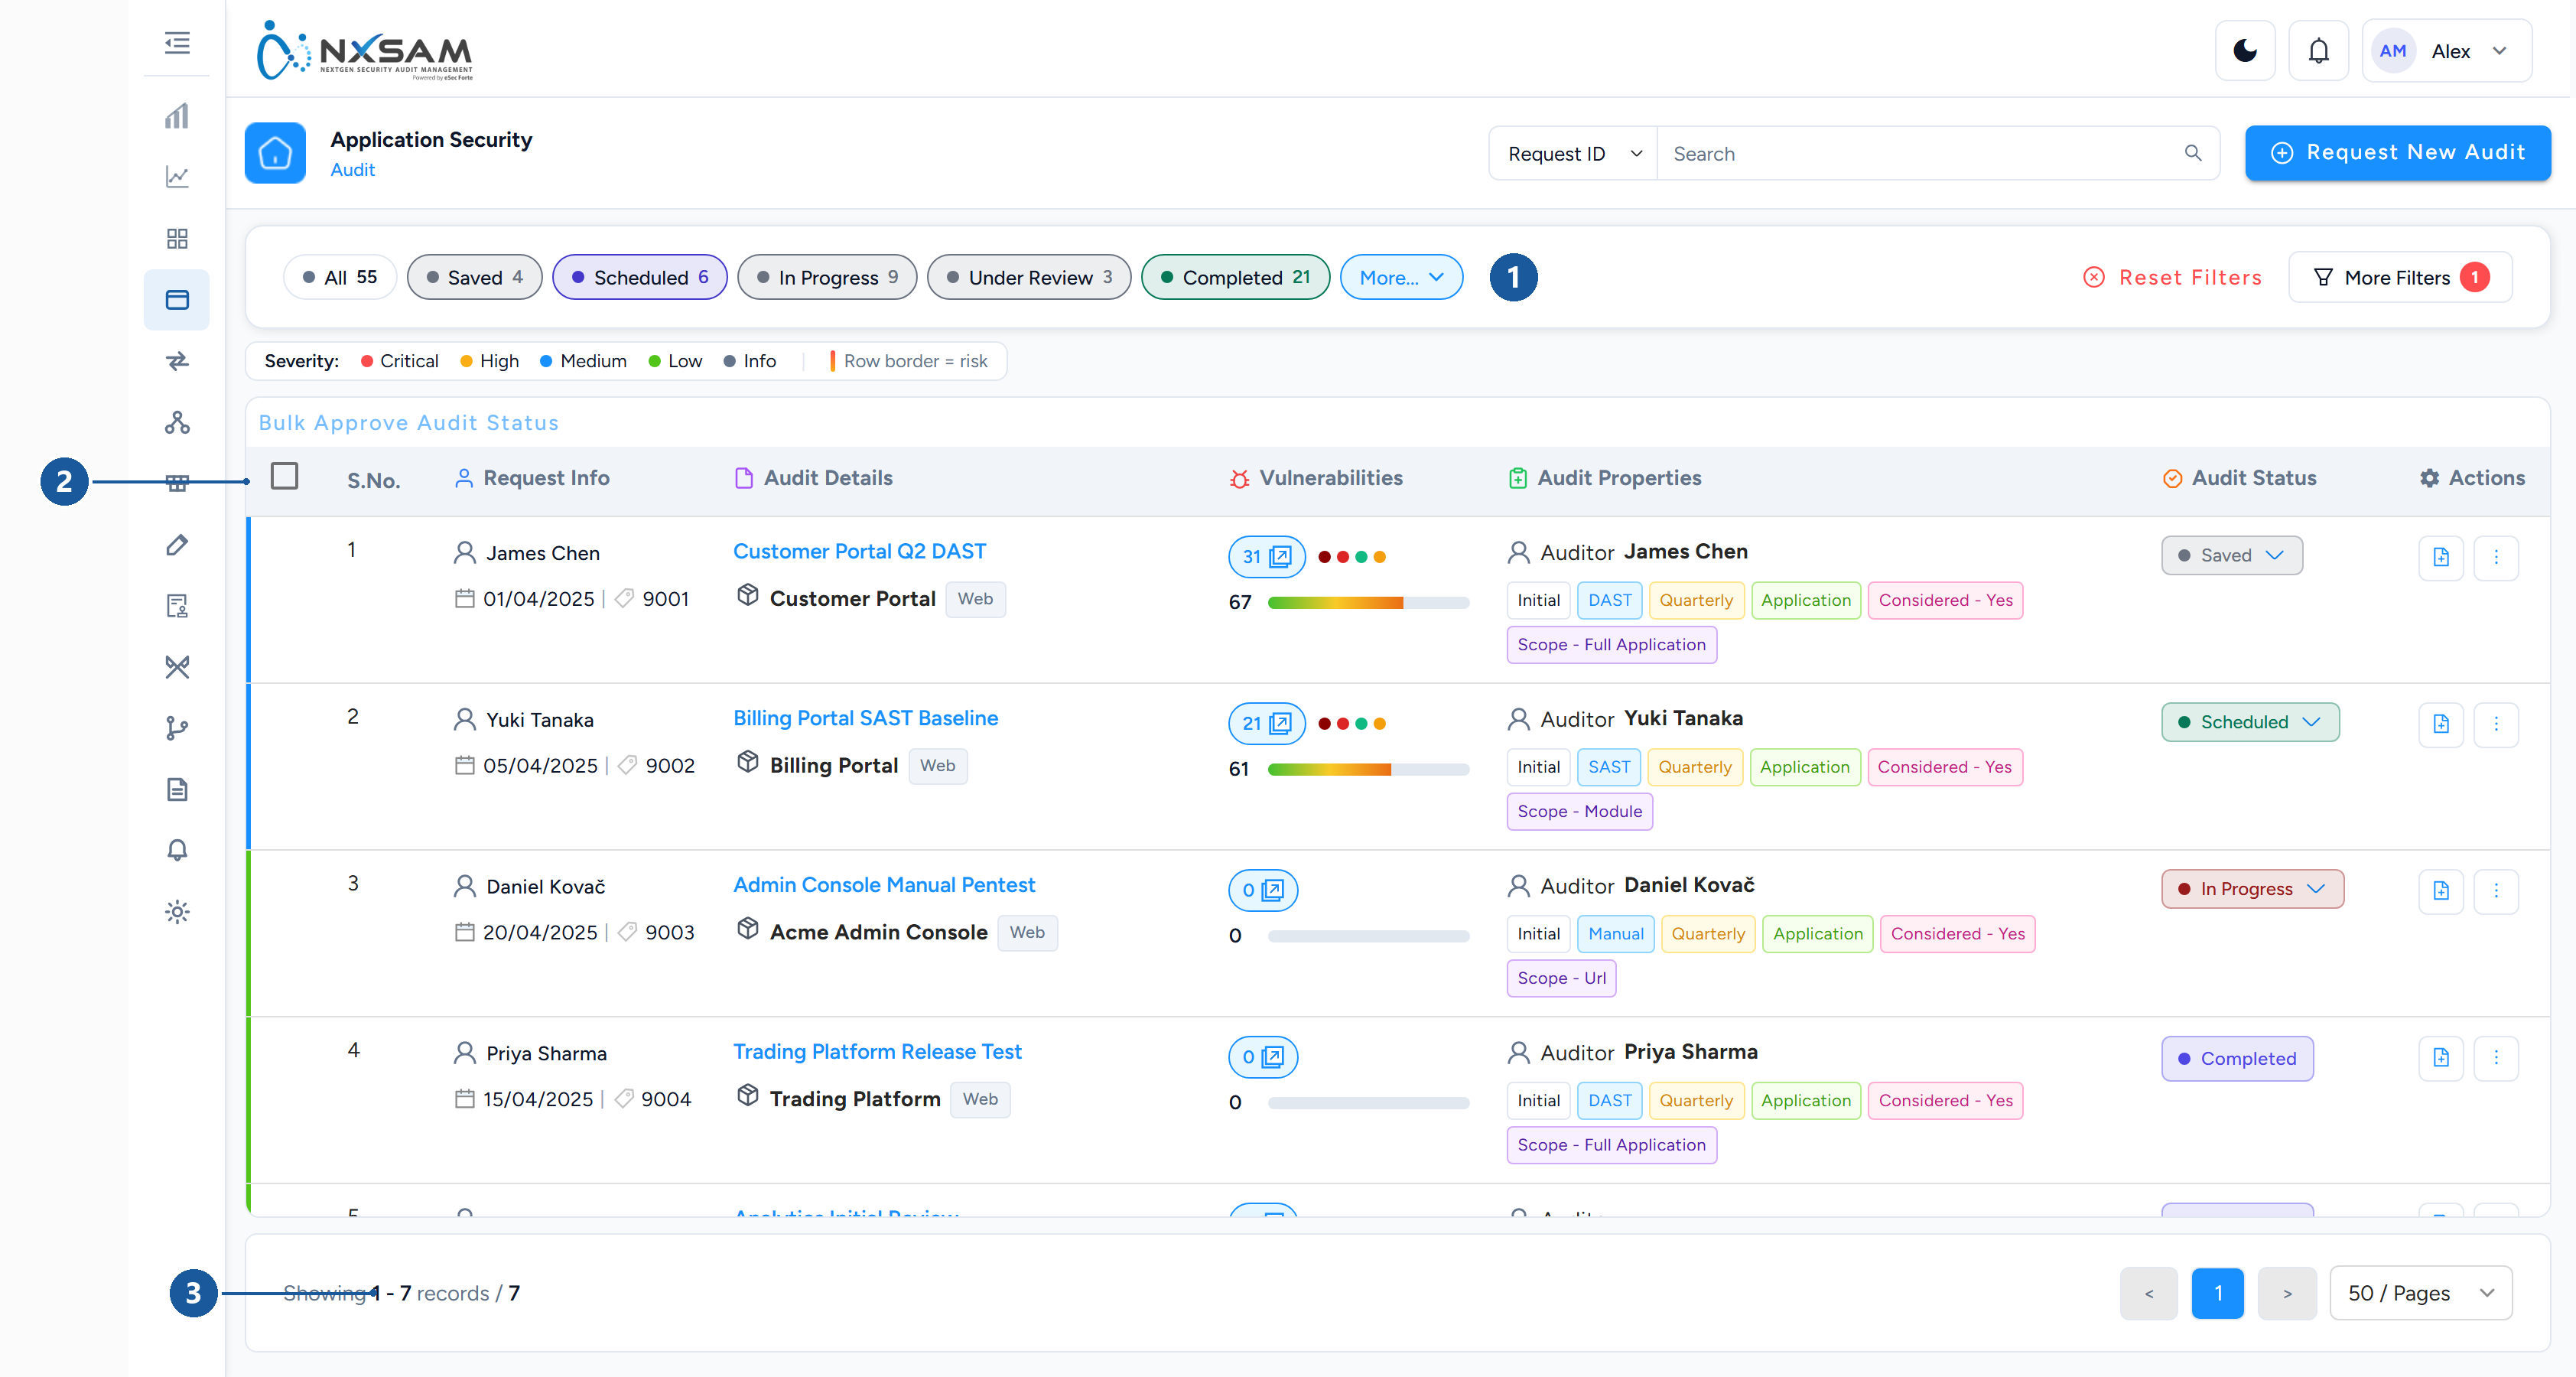
1 status filter chips · 2 what each audit records · 3 page size
An application is the thing you are protecting; an audit is one assessment of it. Applications persist; audits accumulate against them over time.
This is why the same application shows several audits, and why a finding always belongs to a specific audit — it records not only what is wrong but when and how it was discovered.
An application with many URLs or modules can be assessed as a whole or broken into parts, depending on how it was set up.
The working pattern
- An audit is created for the application.
- Findings arrive — imported from a tool, or entered by a tester.
- Each finding is reviewed and approved into the audit. Until then it is not counted in dashboards.
- Approved findings get an SLA by severity and become visible to the application owner.
- The owner fixes; a retest confirms; the finding is validated and closed.
Approval is a real step, not a formality
Findings awaiting approval are visible inside the audit but absent from dashboards and posture counts. If a colleague says "the dashboard is missing findings I can see", approval status is the first thing to check.
Severity and what to do first
Severity comes from the tool that reported it, mapped onto NxSAM's five levels. Tools disagree — the same weakness may be High in one scanner and Medium in another — so severity is a starting point, not a verdict.
Two things temper it in practice:
- Asset criticality. A Medium finding on a payment application usually matters more than a High on an internal wiki.
- Exploitability. Whether the weakness is reachable in your deployment.
False positives
Static scanners in particular report findings that are not genuine. NxSAM handles this two ways:
- Automatically at import, where the integration is configured with rules that classify certain findings as false positives on the way in.
- Manually, by marking a finding as a false positive after review.
Either way the finding is retained rather than deleted, so the decision is auditable and the same finding is not re-litigated after every scan.
Assess an application, end to end
From onboarding an application to closing its findings, with what changes at each step.
Before you start
| You need | Why |
|---|---|
| The application's business context | It is what turns a finding into a decision |
| An audit type and category | They decide which properties are mandatory |
| An auditor account | An audit without one cannot be worked |
1. Onboard the application
Application Security → Application Inventory → Add.
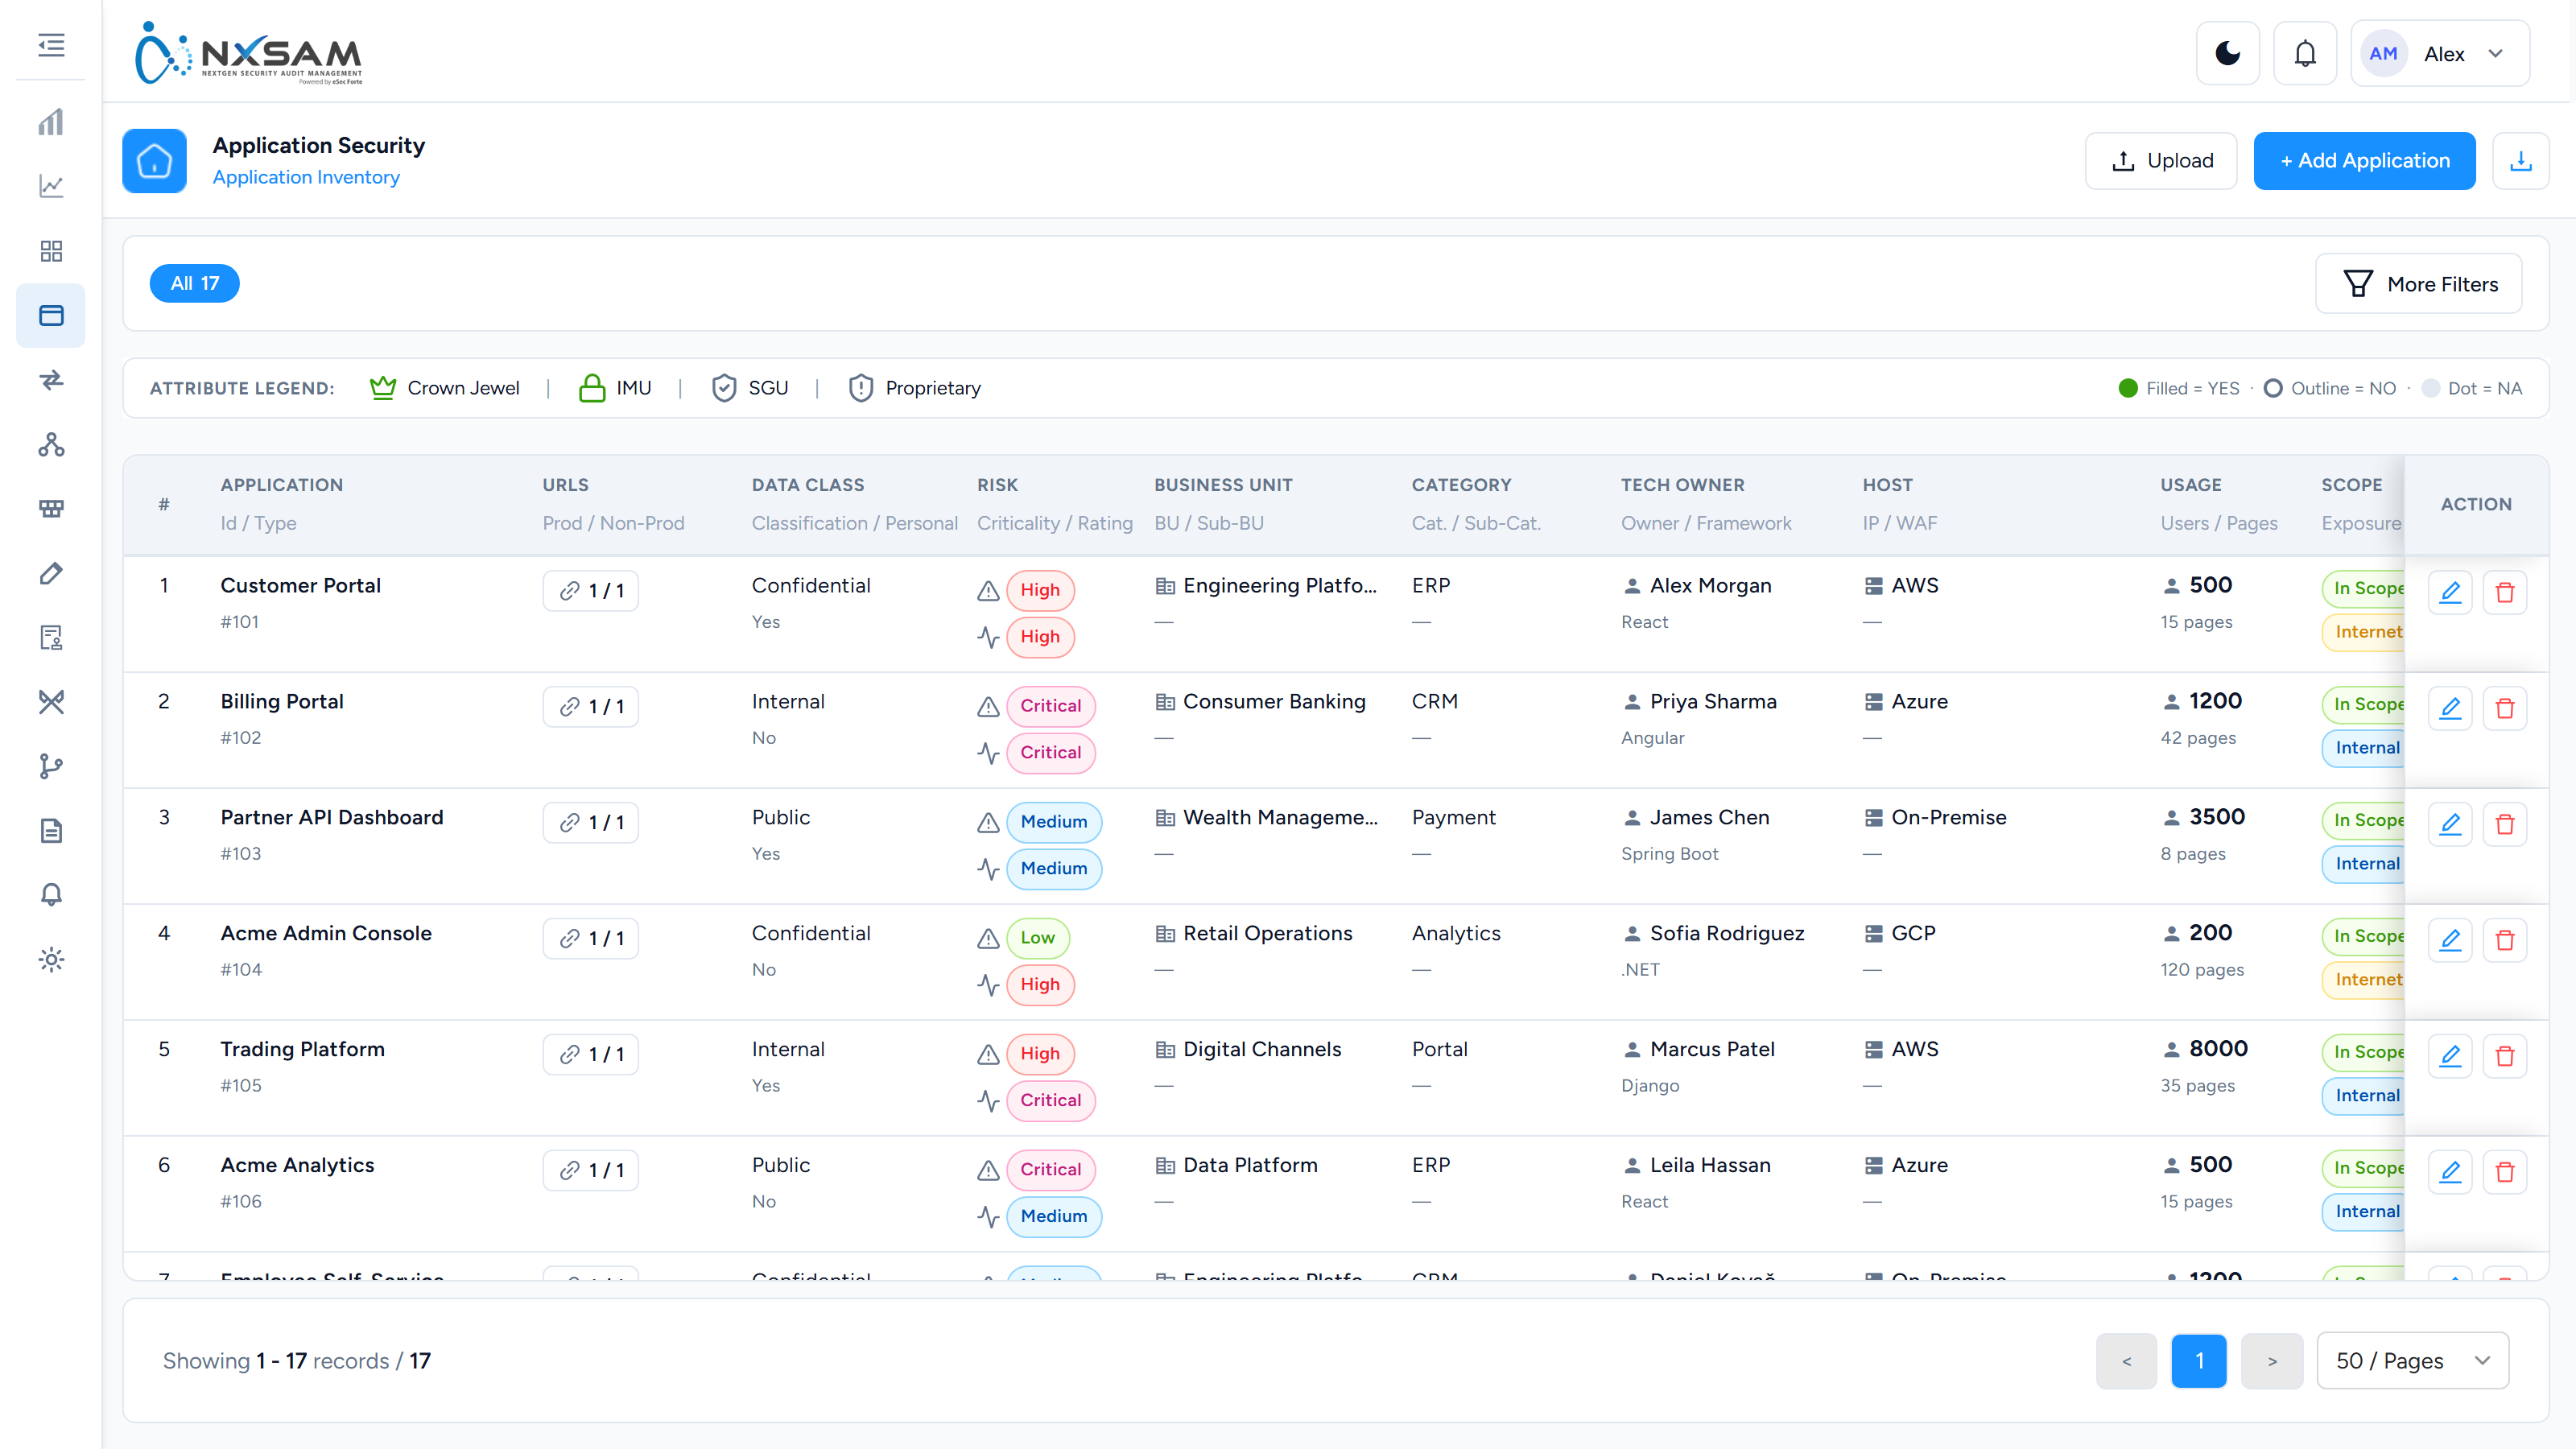
The inventory is filled by whoever onboards the application, not by any scanner. Two fields are routinely skipped and routinely wanted during an incident:
- WAF — whether one sits in front of the application.
- Acceptable Downtime — how long it can be offline.
Together they decide what remediation is even possible. A Critical behind a WAF with zero acceptable downtime needs a virtual patch; the same Critical on an internal tool needs a deploy.
2. Request the audit
Application Security → Audits → Request New Audit.
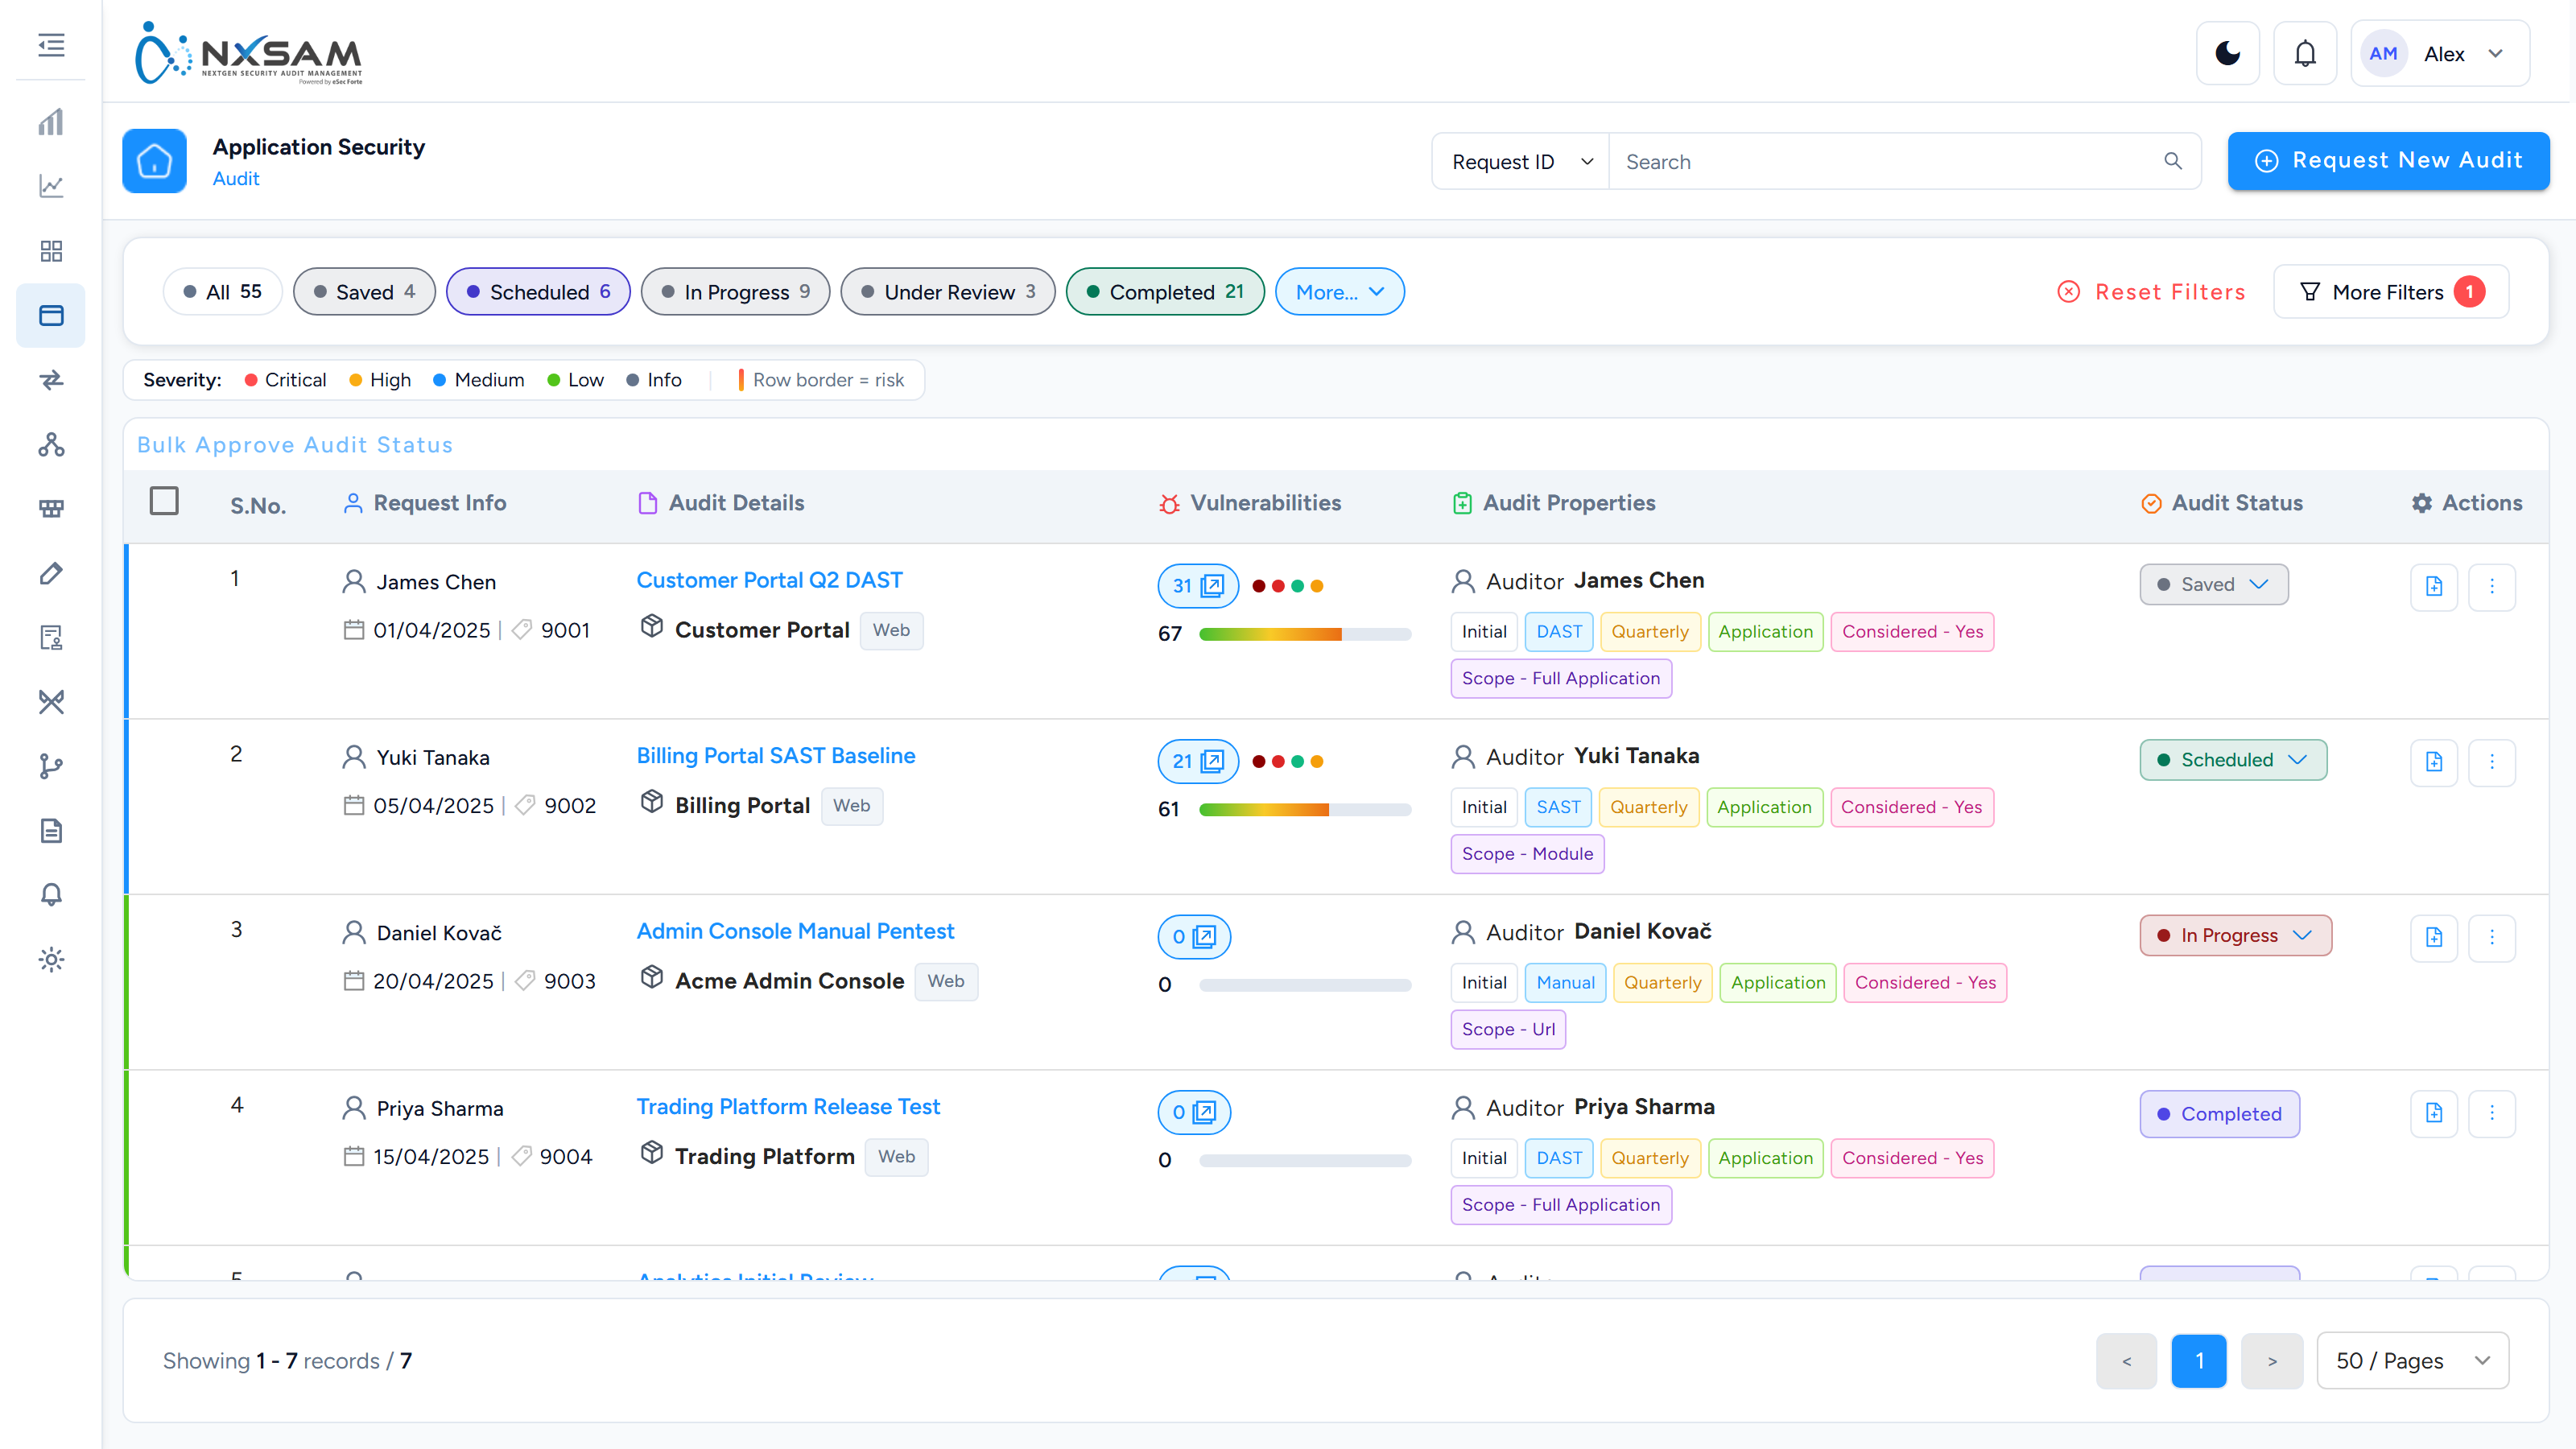
Choose the application, audit type, category and cycle.
After you save: the audit exists and appears in the list, with its properties shown as chips. Audits that arrive by import or from an integration often have fewer chips — the column was not in the file, or the tool did not know.
Assign auditors before the assessment is due to start.
3. Findings arrive
Findings are added by hand during a manual assessment, or imported from a scanner.
A scanner's count and NxSAM's count can differ legitimately
Integrations such as Checkmarx can classify findings on the way in, using your own triage rules. A finding auto-marked false positive never enters the open population — it is not behind a filter, and nothing on the screen explains its absence.
"The scan had 800 findings and NxSAM shows 600" is usually this, not data loss.
4. Record the evidence
Each finding carries Artifacts — step, description and images, in order.
A finding whose artifacts are a single unlabelled screenshot cannot be re-tested by anyone but its author. This is the difference between an assessment that survives a handover and one that does not.
5. Approve
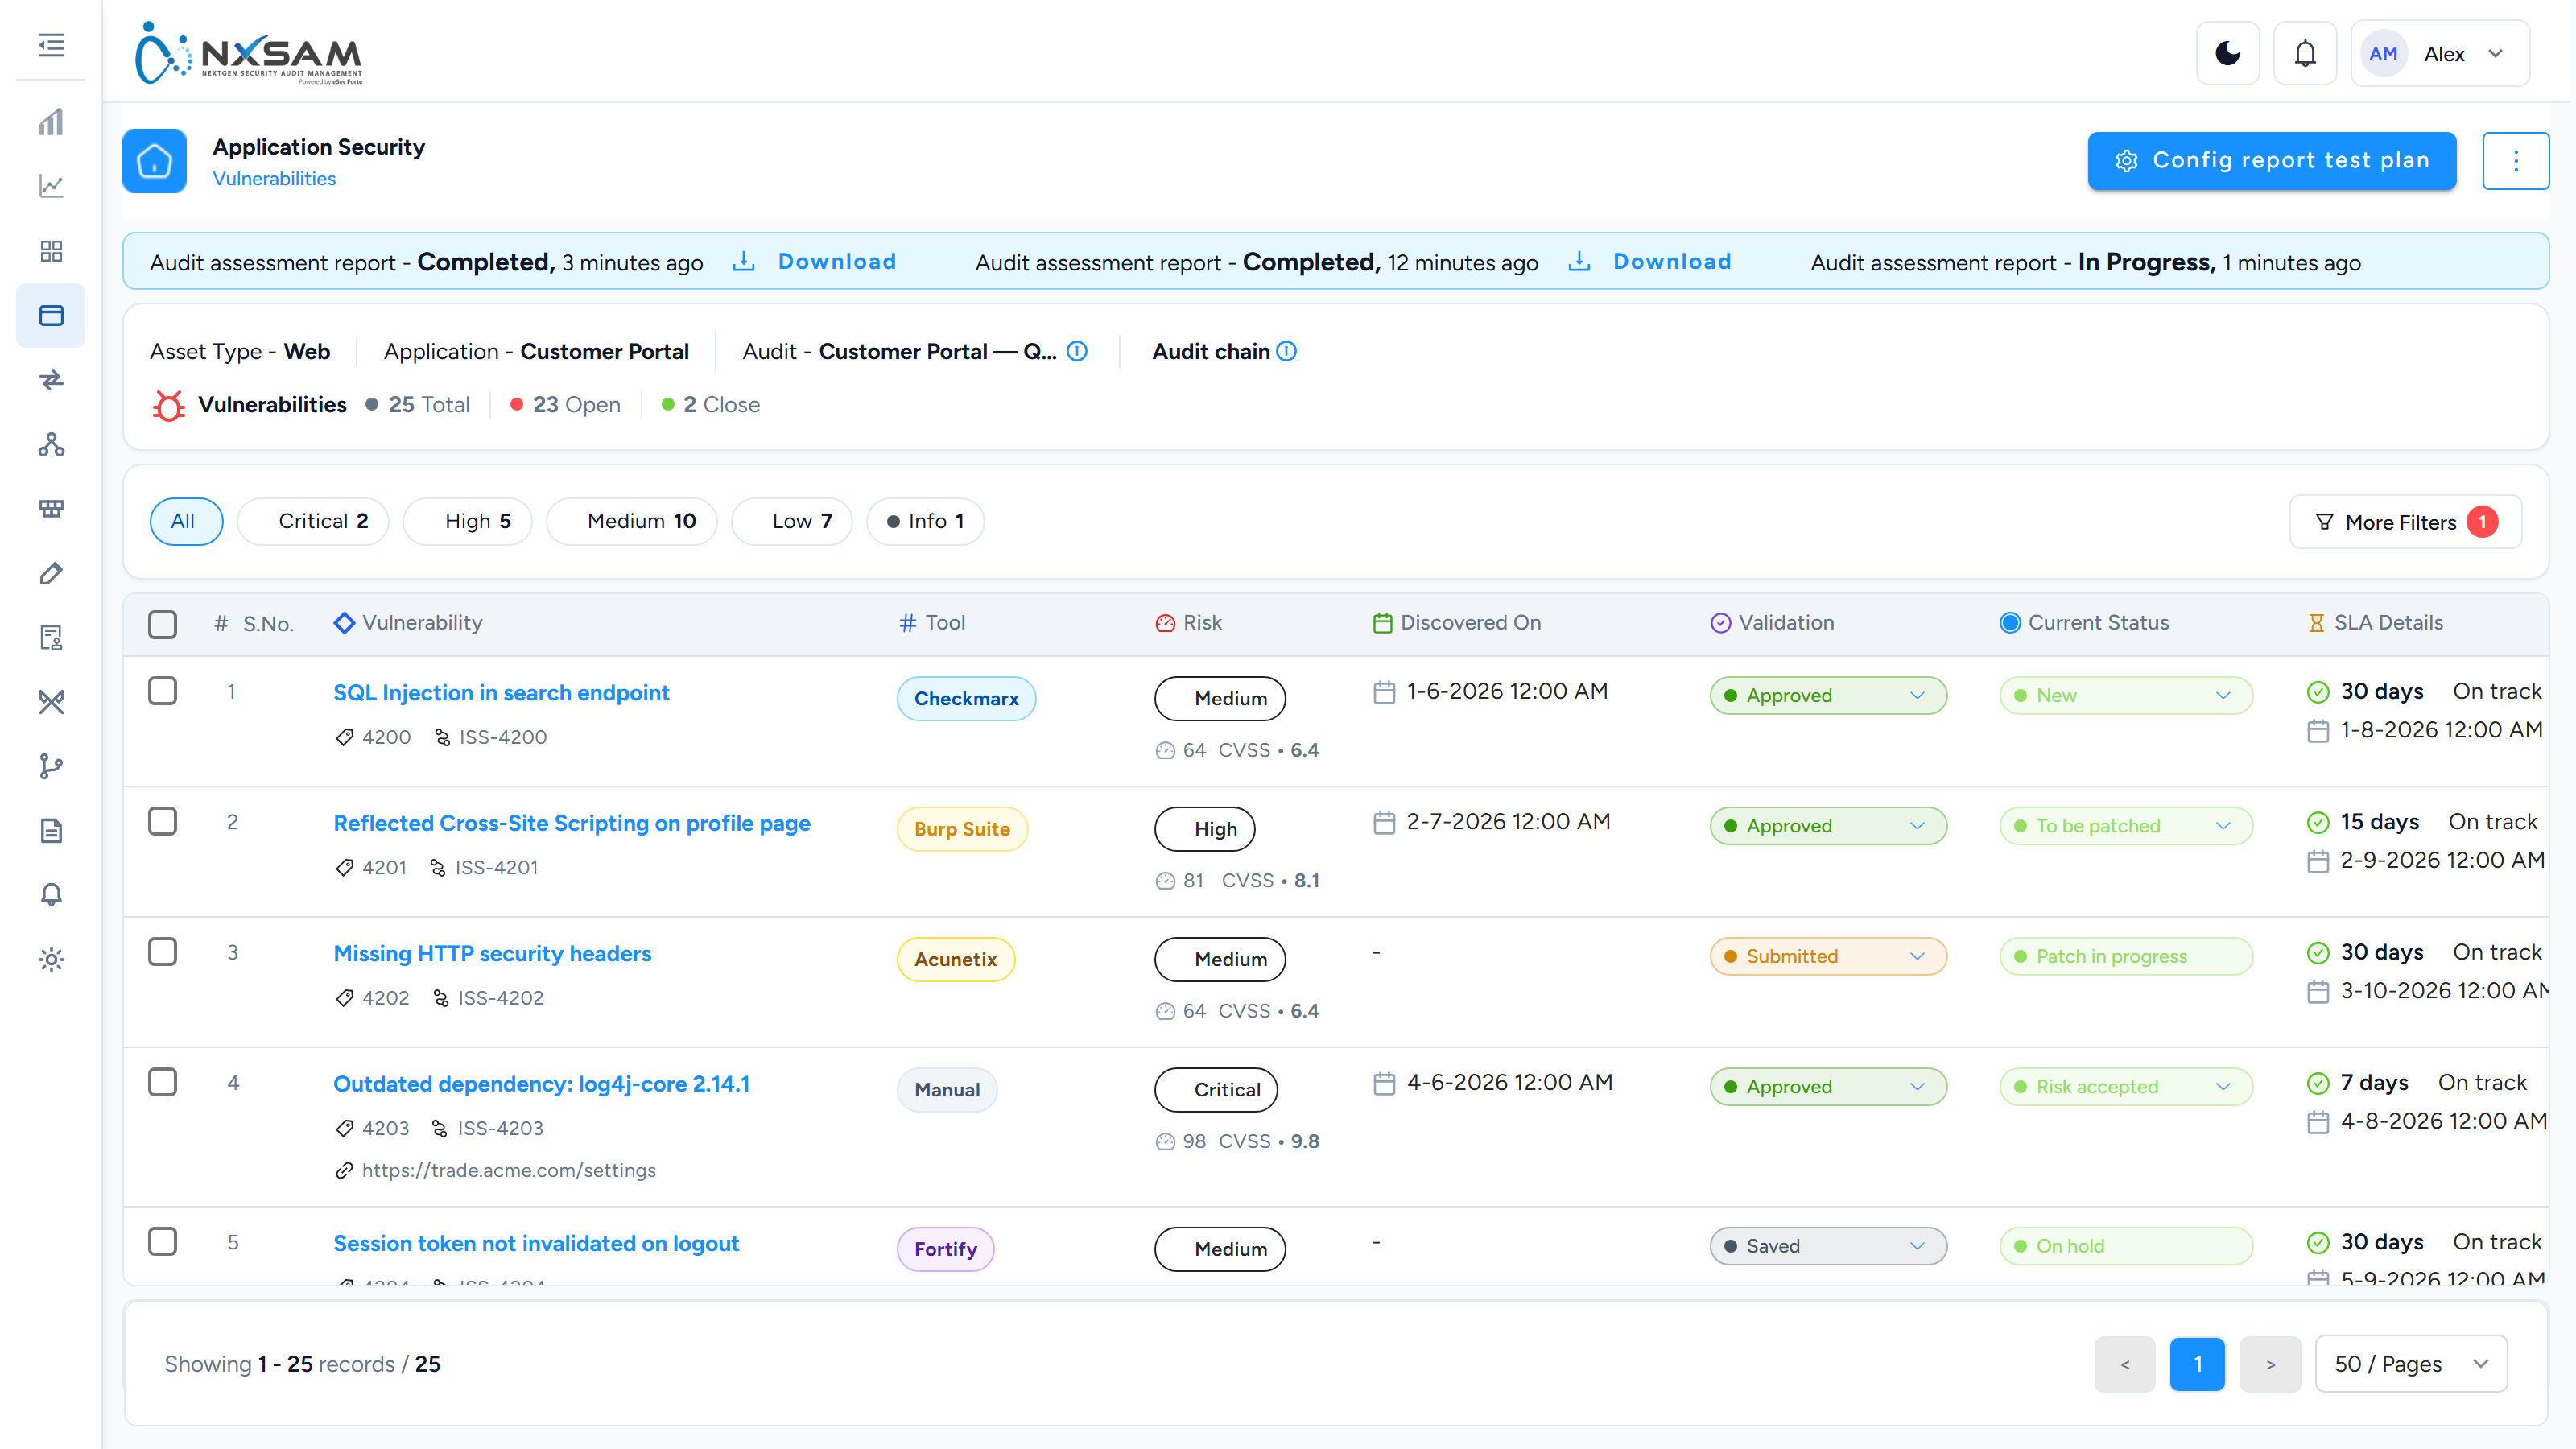
Move Validation to Approved.
After approval: the finding counts, Discovered On is populated, and its SLA starts.
Edit Vulnerability is not Edit Vulnerability Master Details
They sit next to each other in the same menu and look alike.
Edit Vulnerability changes the row you opened. Edit Vulnerability Master Details changes the catalogue entry inherited by every occurrence of that vulnerability, on every asset, in every audit.
Fixing a typo in the master is right. Recording something specific to one application through it is not, and there is no per-occurrence copy to fall back on.
6. Remediate and close
Move Current Status as work proceeds. Only Validated and Exception Handled close a finding — Risk accepted still counts as open, because accepting a risk is a decision about treatment rather than a fix.
Where the same weakness affects several applications built from one template, Copy Vulnerability reproduces it onto another asset while keeping each copy a genuinely separate finding with its own SLA and owner.
7. Re-test
Create a confirmatory audit against the parent. The form opens pre-filled with the name and today's date; both can be changed.
Then use Compare on the vulnerability screen to put the two audits side by side. It answers the only question a re-test asks — which of the original findings are actually gone — without reading two lists in parallel.
8. Complete
Move the audit to a final state. The date it reaches that state is the date every aggregate view files it under.
Only considered audits reach dashboards and reports. An audit marked Considered — No keeps its findings and shows them on the module screen while contributing to nothing aggregated — which is correct for a superseded audit or a trial run.
When something looks wrong
| Symptom | First thing to check |
|---|---|
| Finding not counted | Validation is not yet Approved |
| Discovered On is blank | Same — it populates on approval |
| Audit in the wrong month | The date it reached a final state |
| Text changed on findings you never touched | Someone edited the vulnerability master |
| Fewer findings than the scan reported | The import classification rules |
| An audit cannot be worked | No auditor assigned |
How an audit is created, and what happens next
There are four ways an audit comes into existence, and they behave differently once created. A caller saying "the audit is wrong" usually needs a different answer depending on which of the four produced it.
The four routes in
1. Requested in the UI
Request New Audit on the module screen. Someone picks the application, the audit type,
the category and the cycle, and the audit is created in Saved.
This is the only route where all the properties are chosen deliberately, which is why audits created this way have complete Audit Properties chips and imported ones often do not.
Every field on the request form, and what choosing it decides
The form has three parts: the first narrows what is being assessed, the second defines how, the third says who.
Context — each choice filters the next, so working top to bottom is faster than it looks:
| Field | What choosing it decides |
|---|---|
| Org | The organisation the audit belongs to. Everything below is filtered to it |
| Application Type | Web, mobile, thick client and so on. It filters the application list, and it decides which audit properties become mandatory further down |
| Business Unit, Projects | Narrow the application list further. They change what you can pick, not the audit itself |
| Application Name | Required. The asset being assessed. Decommissioned applications are deliberately not offered |
Audit definition — the choices that change how the audit behaves afterwards:
| Field | What choosing it decides |
|---|---|
| Methodology | Required. Black box, grey box or white box — how much the tester was given. It bounds what the assessment could have found, which is the first thing an auditor asks about a result |
| Audit Type | Required. Your organisation's own list, administered under Configurations |
| Audit Cycle | Required. A scheduled round or a one-off — and it decides which Audit Scope values are offered. An ad-hoc audit may be scoped freely; a calendar-cycle audit is held to the full scope. A scope you expected can be missing simply because of the cycle chosen above it |
| Audit Scope | Required. Full or partial coverage. Partial scope is why "we tested that" can be true and still not cover the thing being asked about |
| Audit Category | Required. The classification the audit is reported under |
| Scope Length | How much was assessed — screens, endpoints or modules in scope. It is what makes two audits comparable when one covered four screens and the other forty |
| URL | The address assessed. On a multi-URL application this is the one this audit covers, not the whole application |
| Audit Name | Free text. On a re-test it arrives pre-filled with Confirmatory and the parent's identifier |
| Start Date, Closure Date | Planned dates. The closure date is a plan — not the date the audit counts from, which is when it reaches a final state |
| Audit properties | Your own fields, defined under Configurations. Which are mandatory depends on the asset type and audit type together, which is why two audits can demand different fields |
| Remarks | Free text carried with the audit |
| Upload Documents | Scope documents, authorisation, rules of engagement — attached here they stay with the audit |
Assignment:
| Field | What choosing it decides |
|---|---|
| Auditor | Who works the audit. It can be left empty, and that is the commonest reason an approved audit sits with nothing happening |
| Comment | Sent to the approver with the request |
2. Imported in bulk
A file of audits, staged and queued like any other import. Used when onboarding a programme of work that already exists elsewhere — a year of assessments being migrated in.
Two consequences:
- Properties absent from the file are absent from the audit. A blank cycle or category chip usually means the column was not in the import, not that someone forgot to set it.
- Import is asynchronous. Audits appear when the worker processes the batch, not when the upload returns.
3. Created by a tool integration
Some integrations create an audit for each scan they find. A Burp Suite scan, for instance, becomes an audit against the application it targeted.
This is the route that surprises people: audits appear that nobody created. That is the integration doing its job. The audit is named after the scan, and its properties come from what the tool knew, which is usually less than a person would have entered.
If a module fills with audits after an integration is connected, this is why — and the fix is scoping what the integration collects, not deleting audits.
4. As a re-test of an earlier audit
A confirmatory audit is created against a parent audit to verify that fixes hold. The form opens pre-filled — the name as Confirmatory plus the parent's identifier, and the start date as today — both of which you can change before saving. Naming that parent is what makes the audit's chip read Confirmatory rather than Initial, and it inherits the parent's scope.
The chain matters for reporting: a confirmatory audit is evidence about the original, not an independent assessment, and the two should not be counted as two rounds of testing.
What "considered" decides
Only one audit per asset should normally count towards the organisation's figures — the
latest one that reached a final state. That is what Considered marks.
A considered audit is chosen, not automatic
An audit only becomes considered when it reaches a final state, and the date it did so is the date aggregate views use for it — not the date it was created, and not the date the scan ran.
So a scan run in March, imported in April and completed in May counts as May in the dashboards. Support tickets about "findings appearing in the wrong month" are almost always this.
An audit marked Considered — No keeps all its findings and appears in the module, and is excluded from dashboards, posture counts and reports. Superseded audits, trial runs and assessments of decommissioned environments are the normal reasons.
Status, and who can move it
An audit moves through its statuses in a defined order, and the dropdown offers only the legal next steps from where it is. An option that is missing is a transition that is not allowed from the current state, or one your role cannot perform — not a defect.
Some transitions require a comment — whether one is needed is a property of the status being moved to, so moving an approved audit to Hold asks for one, and the same is true of any status an administrator has marked as needing a reason. Bulk Approve applies one status change to every selected row, which is the reason the checkbox column exists and the usual tool after a large import.
A reverted audit comes back with its start date cleared
When an audit is sent back with Reverted, reopening it for edit unlocks the fields and blanks the start date deliberately. The audit is being re-run, so the original start date is no longer true, and leaving it in place would silently misstate how long the work took.
Set it again before saving — the form will not accept the audit without it.
Deleting an audit
Deletion is soft: the record is hidden rather than destroyed. That is why a deleted audit's name can still appear on historical findings and older reports, and why deleting an audit does not retrospectively change a report already produced.
If an audit was deleted to correct a mistake and its findings are still visible somewhere, that is the design rather than a failure to delete.
What to ask when an audit looks wrong
- Which route created it? The chips tell you — a confirmatory chip, or missing properties suggesting an import or an integration.
- Is it considered, and when did it reach a final state? This answers most "wrong period" and "not in the dashboard" questions.
- Is the status where the caller thinks it is? Findings are not counted anywhere until they are approved, regardless of the audit's own status.
Reading the Application Security screens
Both screens pack a lot into each row, and most of it is unlabelled — the chips, dots and bars all carry meaning that is not written on screen. This page names every element and says what it is telling you.
The audit list, row by row
1 status filter chips · 2 what each audit records · 3 page size
The status chips above the table
All, Saved, Scheduled, In Progress, Under Review, Completed, and more behind
More…. Each carries a count, and the counts are of all audits matching your other
filters — not of the page you are looking at.
Clicking one filters the list. All clears the status filter but leaves the other filters
in place, which is why the count sometimes does not match what you expect: Reset Filters
is what clears everything.
The severity legend and the row border
Severity: Critical · High · Medium · Low · Info followed by Row border = risk.
The coloured bar down the left edge of each row is the audit's highest open severity. It is the fastest way to scan the list — a red edge means at least one Critical is open in that audit, regardless of what the counts column shows.
Request Info
Who requested the audit, the date, and the request ID. The ID is what to quote in a support ticket: it identifies the audit unambiguously where names repeat.
Audit Details
The audit name, then the asset it runs against with its type badge (Web, Mobile,
Thick Client, API). One application can have many audits; the audit name is what
distinguishes them, so a naming convention pays off here.
Vulnerabilities
Three separate things in one column:
| Element | Meaning |
|---|---|
| Count badge | Open findings in this audit. The arrow opens the finding list |
| Coloured dots | Which severities are present — one dot per severity that has at least one open finding |
| Number and bar | The audit's risk score, 0–100, coloured along a green-to-red ramp |
The dots answer "how bad", the number answers "how bad overall". An audit with 31 findings and a score of 67 has more, milder findings than one with 8 findings and a score of 90.
Audit Properties
The chips that generate the most questions. Each is a separate property:
| Chip | What it means |
|---|---|
| Initial / Confirmatory | Whether this is the first assessment or a re-test verifying earlier fixes |
| DAST / SAST / Manual | The kind of testing — dynamic, static, or hand-performed |
| Quarterly / Annual / … | The audit cycle it belongs to |
| Application / Module / URL | The bifurcation: whether the app was assessed whole or split into parts |
| Considered — Yes/No | Whether this audit counts towards aggregate figures |
| Scope — … | What was in scope for this particular run |
Considered is the one that surprises people
An audit marked Considered — No is fully visible here, with all its findings, and is excluded from dashboards, posture counts and reports.
That is deliberate: a superseded audit, a trial run, or an assessment of a decommissioned environment should not move the organisation's numbers. But it means "the dashboard does not match the audit list" is expected behaviour for those audits, not a defect.
Only an audit in a final state can be considered, and the date it reached that state is what aggregate views use as its date.
Audit Status
A dropdown, not a label — the status can be changed from here where your role permits it. Which statuses you can move to depends on the current one: the list offers only the legal next steps, so an option missing from the dropdown means that transition is not allowed from where the audit currently is, not that it is broken.
Some transitions require a comment; the product will ask.
Actions
The per-row menu. What appears depends on the audit's status and your permissions, which is why two people looking at the same row see different options. Typical entries are managing the audit's scope, assigning an auditor, editing the audit, and downloading its report.
An action that is absent is almost always a permission or a status question rather than a fault — check the audit's state first.
Bulk Approve Audit Status
Acts on the rows selected by the checkboxes. Useful after a large import when many audits need the same status change, and the reason the checkbox column exists.
The vulnerability list
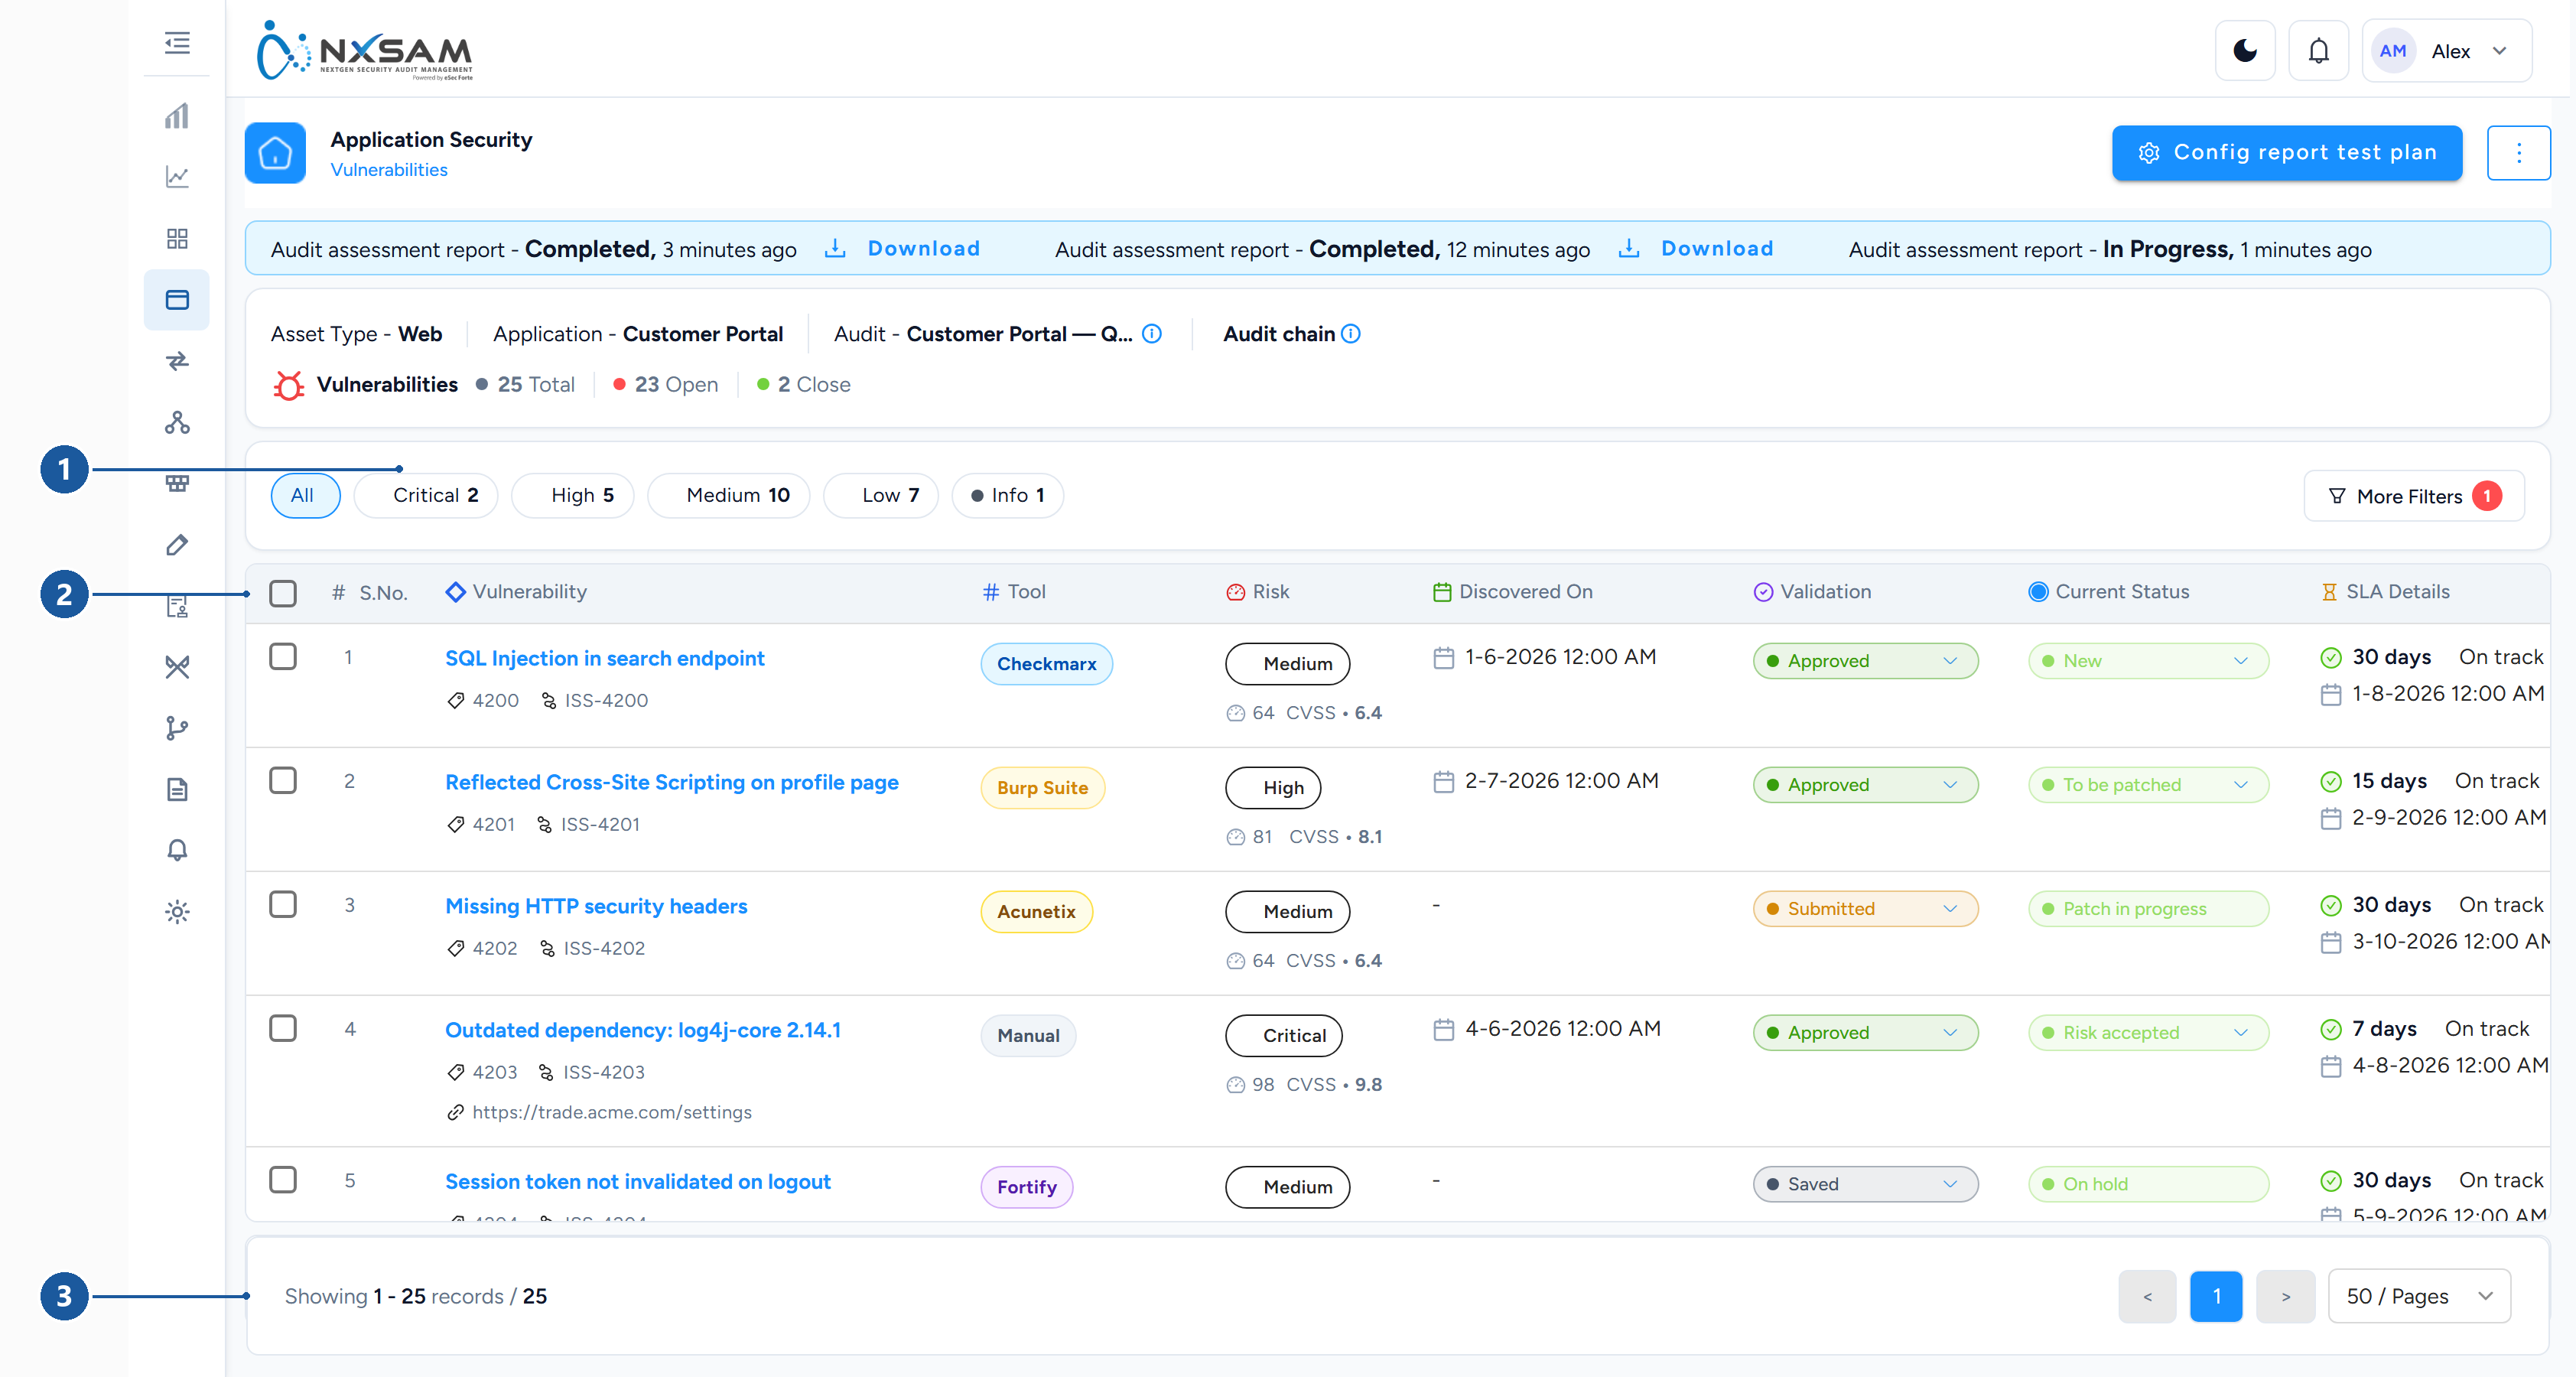
1 filter by severity · 2 finding, asset and status · 3 paging
This is reached by drilling into an audit — the count badge in the Vulnerabilities column above. It always shows findings within a scope, so a finding you expect to see and cannot is often in a different audit rather than missing.
Two status columns, not one
The column people read as "status" is actually two:
- Validation status — is this finding genuine and agreed? There are exactly five:
Saved,Submitted,Approved,Closed,False Positive. - Client status — what is being done about it? Fourteen values:
New,To be patched,Patch in progress,Patched,Not Patched,On hold,Reopen,Validated,Not Applicable,Risk accepted,Risk acceptance,Duplicate,Exception Handled,Expired.
Only Validated and Exception Handled count as closed. Everything else — including
Patched and Risk accepted — is still an open finding as far as every count in the
product is concerned, which is why a list that looks resolved can report every row as
open.
Both are dropdowns offering only the legal next steps. They move independently, and the distinction matters more than anything else on the screen — see the two status fields.
The remaining columns
| Column | Notes |
|---|---|
| Issue / track ID | Quote this in tickets; it survives re-scans |
| Title | The finding, usually with its category and OWASP mapping |
| Severity | Derived from the score, so it changes if the score mapping is edited |
| CVSS / risk score | The raw score, and NxSAM's contextual score |
| Asset | Which application, and the affected URL where the tool reported one |
| Discovered on | Last seen, not first — a re-scan updates it |
| SLA expiry | Read the SLA from here, not by counting days from discovery |
| Tool | Which scanner reported it. The same weakness from two tools should be one finding; if it is two, check the vulnerability master mapping |
Discovered today and overdue at the same time
Not a contradiction. A re-opened finding gets a new discovery date but keeps its original SLA expiry. The expiry column is authoritative.
Discovered On is blank until the finding is approved
The date is gated on validation status. A finding still Saved or Submitted shows
an empty Discovered On cell — visible in the screenshot above on rows 3 and 5, which
are the two rows not yet approved.
This is deliberate rather than missing data: before approval the finding is not counted anywhere, so it has no agreed discovery date to show. It appears the moment the finding is approved, and the SLA clock starts from it.
Application Security: every screen, column and action
Complements Reading the Application Security screens, which covers the audit and vulnerability lists in narrative form. This page is the exhaustive list — every column and every menu item, including the ones that are easy to confuse with each other.
Application Inventory
The widest table in the product: seventeen columns, most of them stacked pairs. It is the business context that turns a finding into a decision, and it is filled by whoever onboards the application rather than by any scanner.
| Column | Holds | Why it matters |
|---|---|---|
| Application — Id / Type | Application name, its NxSAM identifier and asset type | Identity and asset type |
| URLs — Prod / Non-Prod | The production and non-production addresses | Which environment a finding was raised against |
| Data Class — Classification / Personal Data | Data classification, and whether personal data is handled | Whether a breach here is a regulatory event |
| Risk — Criticality / Rating | Business criticality, and the rating derived from it | Business criticality, and the resulting rating |
| Business Unit — BU / Sub-BU | Owning business unit and sub-unit | Who owns the remediation budget |
| Category — Cat. / Sub-Cat. | Application category and sub-category | Application classification |
| Tech Owner — Owner / Framework | The technology owner and the framework it is built on | Who can actually fix it, and in what |
| Host — IP / WAF | Address, deployment location, and whether a WAF is in front | Where it runs and whether a WAF sits in front |
| Usage — Users / Pages | Number of users and pages | Blast radius, and rough test effort |
| Scope — Exposure | Assessment scope, and internet-facing or internal | What was assessed, and how reachable it is |
| Attributes — CJ / PROP | Customer-journey and personal-information flags | Whether the application sits on a customer journey or handles personal data |
| Attributes — IMU / SGU | Internal management unit and service group unit | The internal ownership hierarchy |
| Status — Remarks | Lifecycle state and any note recorded against it | Lifecycle state and any note |
| Acceptable Downtime | The outage the business will tolerate | Decides whether a fix can be deployed immediately |
| End User Base — Size | Scale of the user population | How many people a change affects |
| Repository — Source URL | Where the source code lives | Needed for static scanning |
WAF and Acceptable Downtime change what remediation is possible
These two are the operational reality behind a finding. A Critical on an application behind a WAF with zero acceptable downtime cannot be fixed the same way as one on an internal tool that can be restarted at will — the first needs a virtual patch, the second a deploy.
They are the fields most often left blank at onboarding and most often wanted during an incident.
The audit list
Columns and the twelve row actions are covered in Reading the Application Security screens. Two are worth naming here because they are not obvious:
- Manage Test Summary — a free-text record of what testing was actually performed. For a manual assessment this is the evidence of scope; without it, an audit cannot be reviewed after the fact.
- View Audit Chain — the original audit and every re-audit against the same scope, in order. The answer to "why are there four audits for this application".
- Assign Auditors — who performs the assessment. Until someone is assigned the audit
can be requested and approved but not worked, which is a common reason an audit sits in
Approvedwith nothing happening. - Vulnerability Overview — the severity and asset breakdown for the audit without opening its finding list, useful when triaging a queue of audits rather than one.
As in API Security, the module ships two audit-table components with slightly different menus. Both perform the same operations.
The vulnerability list
| Column | Notes |
|---|---|
| Vulnerability | The finding, with category and OWASP mapping |
| Tool | Which scanner reported it — a numeric master-type code rendered as a name |
| Risk | Severity, derived from the score |
| Discovered On | Blank until the finding is approved |
| Validation | Saved, Submitted, Approved, Closed, False Positive |
| Current Status | The client status — fourteen values |
| SLA Details | Duration and expiry |
| Artifacts | Evidence attached to the finding |
Row actions — nine
| Action | What it does |
|---|---|
| Edit Vulnerability | This occurrence |
| Edit Vulnerability Master Details | The catalogue entry every occurrence inherits |
| Copy Vulnerability | Duplicates the finding onto another asset or audit |
| Edit CVSS Metrics / View CVSS Metrics | The CVSS vector, component by component |
| Edit Sequence | The order findings appear in the generated report |
| Vulnerability History | Every change to the finding, across audits |
| View Status History | Status changes with who made them |
| Delete Vulnerability | Removes it from the audit |
Edit Vulnerability Master Details is not Edit Vulnerability
They sit adjacent in the same menu. The first changes the master catalogue — the title, description and remediation inherited by every occurrence of that vulnerability across every audit and asset. The second changes only the row you opened it from.
Fixing a typo in the master is correct. Recording something specific to one application through it is not, and the dialog does not make the difference obvious.
Copy Vulnerability exists because the same weakness often affects several applications built from one template. Copying preserves the description and remediation while creating a genuinely separate finding, each with its own SLA and owner.
Page-level actions on the vulnerability screen
| Action | What it does |
|---|---|
| Export Vulnerabilities | Downloads the current list, respecting the filters applied |
| Compare | Two audits side by side — what is new, fixed and unchanged |
| Trend analysis | How the finding profile has moved over successive audits |
Compare is the re-test tool. After a confirmatory audit it answers the only question that matters — which of the original findings are actually gone — without reading two lists in parallel.
Artifacts
Step, Description, Images: the reproduction path, in order. A finding whose artifacts are a single unlabelled screenshot cannot be re-tested by anyone but its author.
Vulnerability history
Audit ID, Audit Details, Risk, Vulnerability Status, Created On, Status Changed By — and it spans audits, so it shows a finding closed in one assessment and re-opened by the next.
Add Old Vulnerabilities
vId, Vulnerability, Audit Name, Risk, Client Status. Carries outstanding
findings from earlier audits into a new one, preserving their history and original
discovery date. Re-entering them by hand creates fresh findings that age separately.
Edit Tags
Tag ID, Tag Name. Tags are shared, so renaming one changes it everywhere.
The dashboard
Every widget exports individually via Download PDF and Download PNG.
Application Security: find the right screen
Every screen in this module, what each one is for, and where it lives. Use it to find the right screen quickly, and to confirm you are on the one a colleague means — several screens in this product have similar names and different jobs.
Screenshots come from a demonstration data set, so the figures are illustrative. Click any screenshot to open it at full resolution.
AppSec Dashboard
Application security posture — severity mix, age, top applications and the audit timeline.
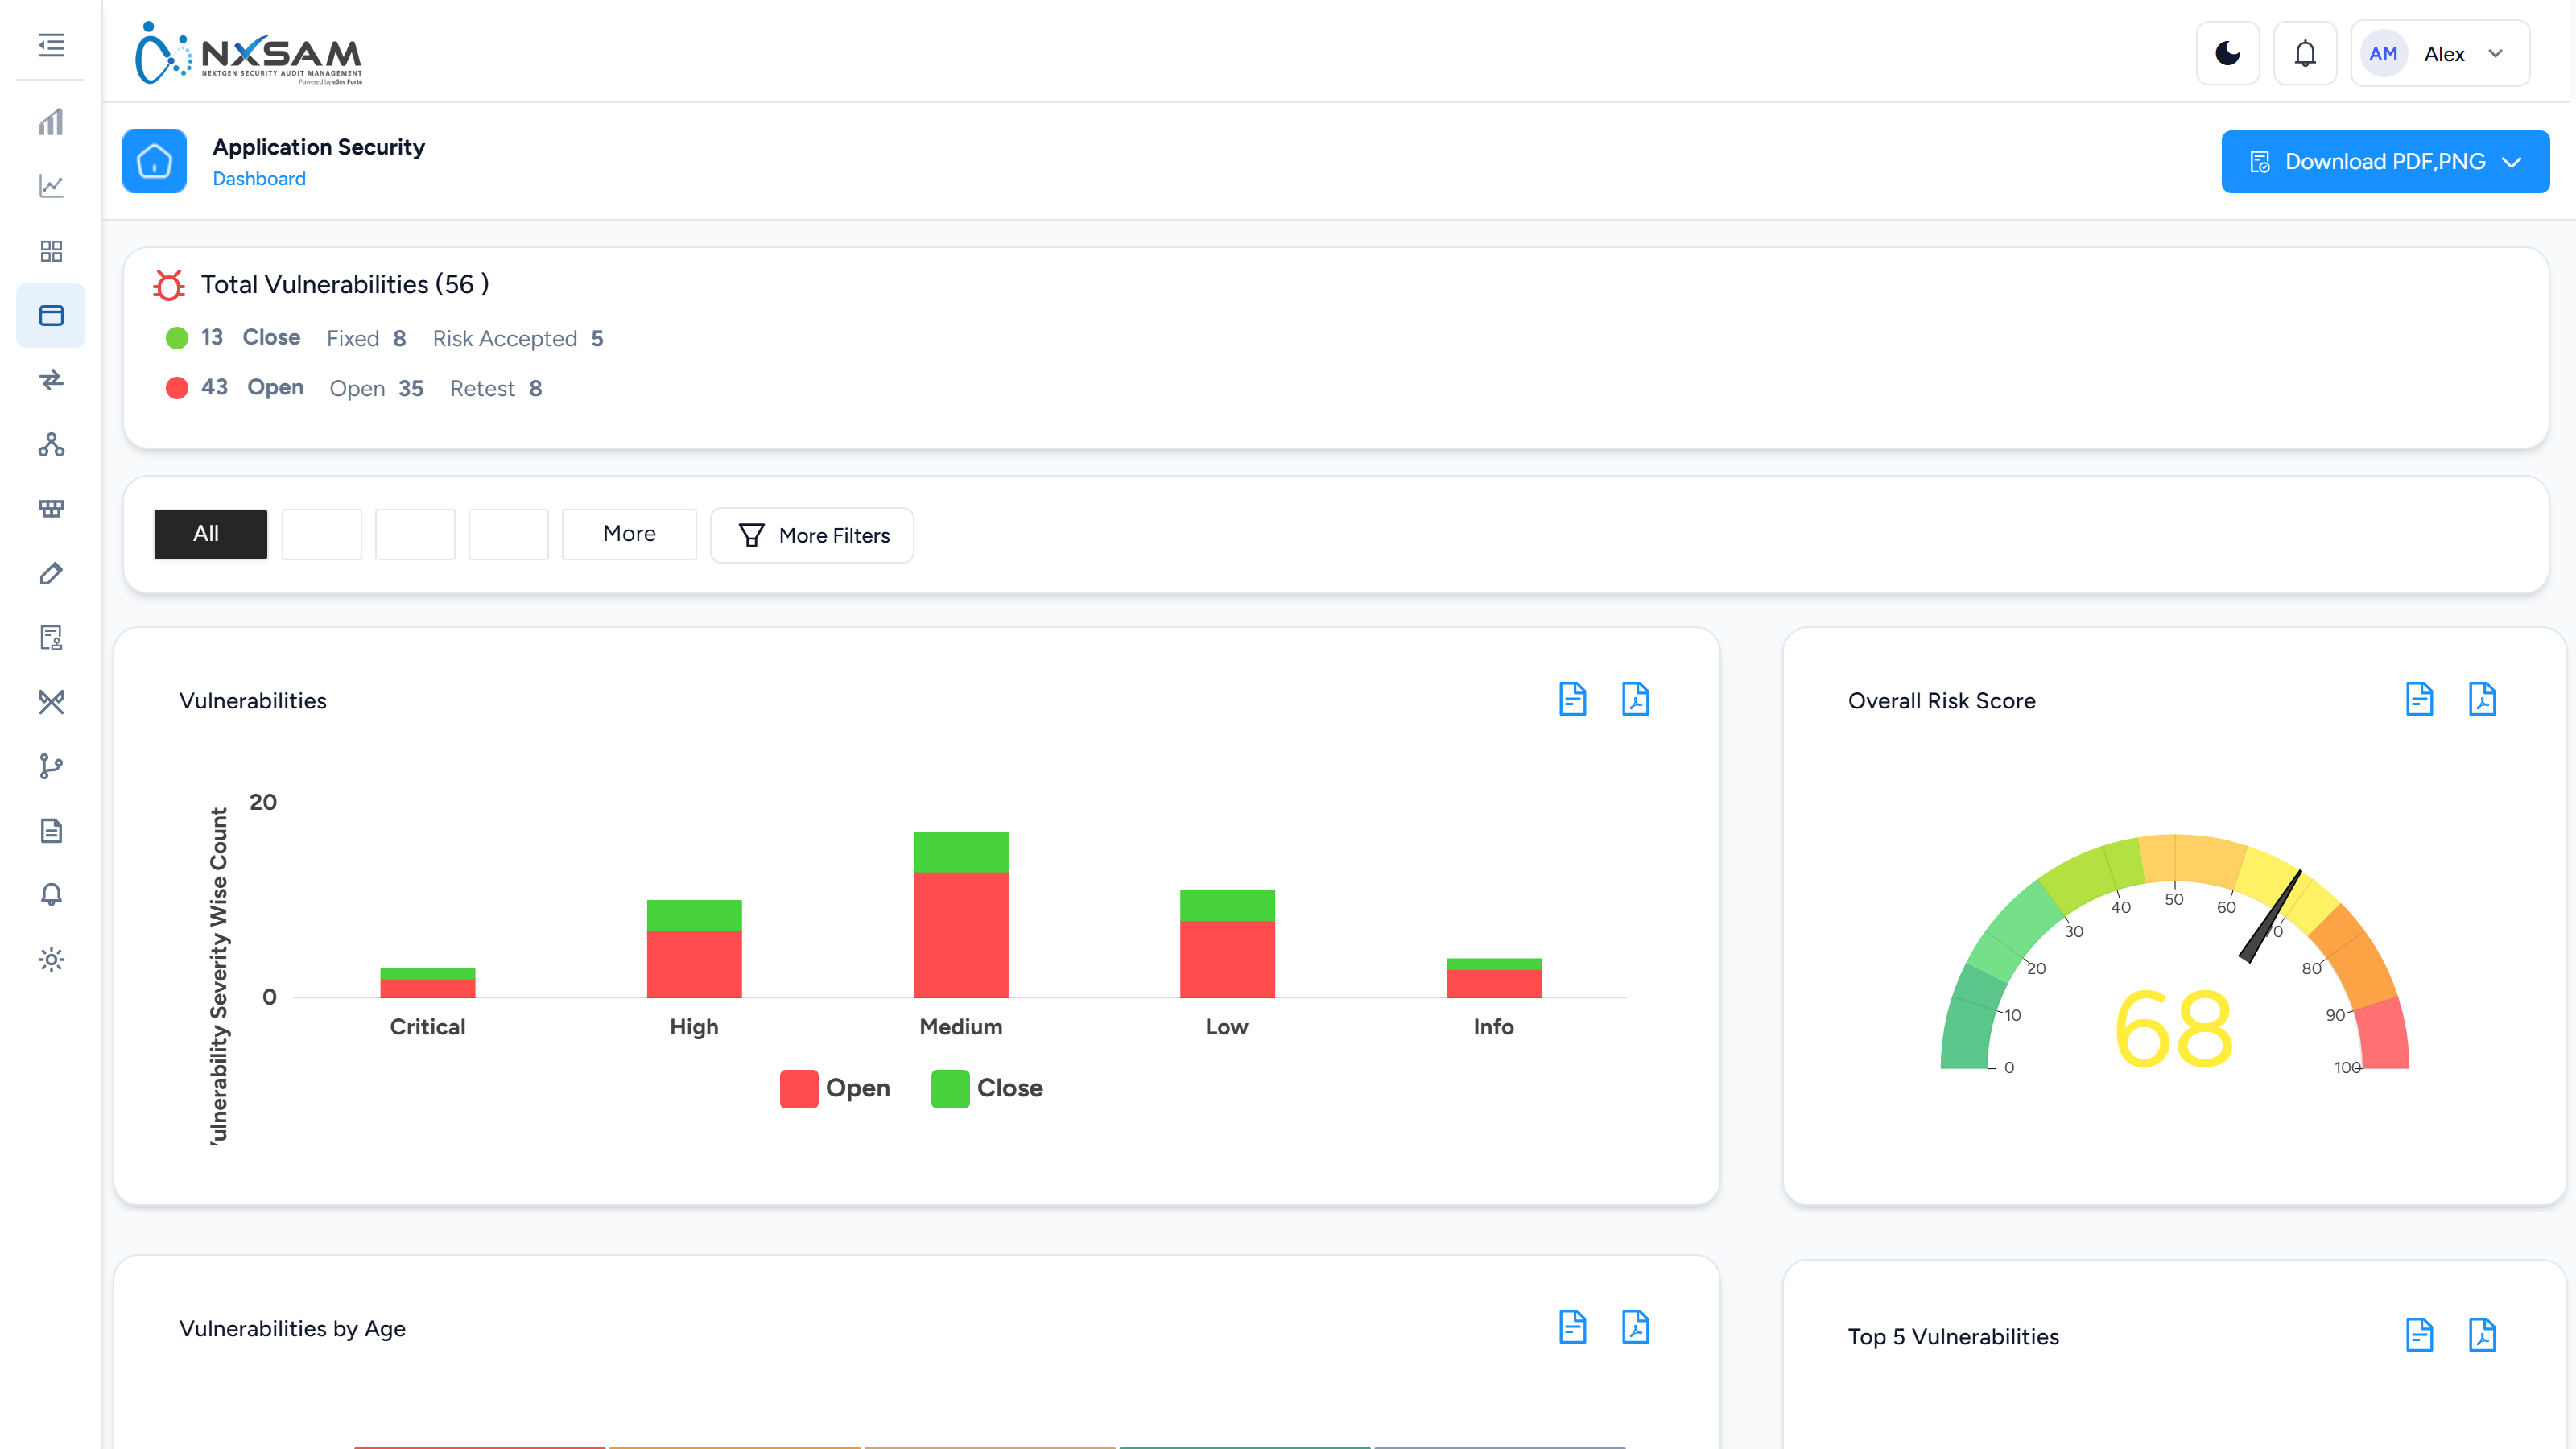
Application Security: support reference
Internal. The customer-facing explanation is in Reading the Application Security screens, How an audit is created and the screen reference.
Most AppSec tickets are one of four things: a finding that is not counted, an audit in the wrong period, an edit that changed more than the caller intended, or a status that will not move.
The two-status model
A finding carries Validation (has it been confirmed) and Current Status (what is being done about it). They are independent, and almost every "the numbers are wrong" question comes from reading one as the other.
- Nothing is counted anywhere until Validation reaches Approved.
- Discovered On is blank until approval — that is the field being unset, not missing data.
- Current Status has fourteen values, of which only two close the finding. Risk accepted is still open.
Full detail in Two status fields.
The edit that changes more than expected
Edit Vulnerability Master Details sits directly beside Edit Vulnerability in the same row menu, and the dialogs look similar.
| Action | Scope |
|---|---|
| Edit Vulnerability | The one occurrence you opened |
| Edit Vulnerability Master Details | The catalogue entry — every occurrence, every audit, every asset |
A caller reporting "the description changed on findings I never touched" has almost certainly used the second. There is no per-occurrence copy to fall back on: the master's text is inherited live, so the correction is to fix the master again rather than to restore one finding.
Audits in the wrong period
Three dates exist and only one drives reporting:
- The scan date — when the tool ran.
- The import date — when it reached NxSAM.
- The date the audit reached a final state — what dashboards and reports use.
A scan run in March, imported in April, completed in May is a May audit. This single rule resolves most "findings appearing in the wrong month" tickets.
An audit that is not considered keeps its findings and shows them on the module screen, while contributing to nothing aggregated. If a module screen and a dashboard disagree, check considered before anything else.
Statuses that will not move
The status dropdown offers only transitions legal from the current state and permitted for the caller's role. A missing option is one or the other, never a defect.
An audit sitting in Approved with nothing happening usually has no auditor assigned — it can be requested and approved without one, and cannot be worked.
A reverted audit returns with its start date cleared and will not save until it is set again.
Where findings come from
Audits arrive by four routes, and the route explains the audit's shape:
| Route | Tell-tale |
|---|---|
| Requested in the UI | Complete audit-property chips |
| Bulk import | Missing chips — the column was absent from the file |
| Tool integration | Audits nobody created, named after the scan |
| Re-test | A Confirmatory chip and a parent audit |
"Audits are appearing on their own" is an integration doing its job. The control is the integration's scope, not deletion.
Import classification
Checkmarx-style integrations can classify findings on the way in. A finding auto-marked false positive never enters the open population — it is not hidden behind a filter, and nothing on the screen explains its absence. "The scan had 800 findings, NxSAM shows 600" is usually this. See import classification.
Permission-gated controls
Absent, not disabled. Before treating a missing control as a defect, compare what the caller can see against their role:
- Approve / reject
- Edit vulnerability master details
- Delete
- Export
- Artifacts (viewing a finding's proof-of-concept)
What to collect before escalating
- Audit ID and client — audit names repeat across clients.
- Validation and Current Status of the specific finding, quoted exactly.
- Whether the audit is considered, and when it reached a final state.
- For "changed unexpectedly": the finding's Vulnerability History and View Status History, which name who changed what and when.
- For count disputes: the same number from the module screen and from the dashboard.
API Security
API Security
API Security tracks weaknesses in service endpoints — the interfaces your applications, partners and mobile apps call. APIs are assessed separately from the applications that use them, because they are separately exposed and separately exploitable.
Why APIs get their own module
An API is often reachable by more parties than the application in front of it, and it rarely has the protections a user interface does. The characteristic API weaknesses are also different in kind:
- Authorisation flaws — a caller can request another customer's record simply by changing an identifier. The most common and most damaging API weakness.
- Excessive data exposure — the response contains more than the caller needs, and the filtering happens in the client.
- Missing rate limits — an endpoint that can be called without restriction.
- Forgotten versions — an old API version left reachable after its replacement shipped.
None of these are visible from the user interface of the application using the API, which is why the API is assessed in its own right.
How the module is organised
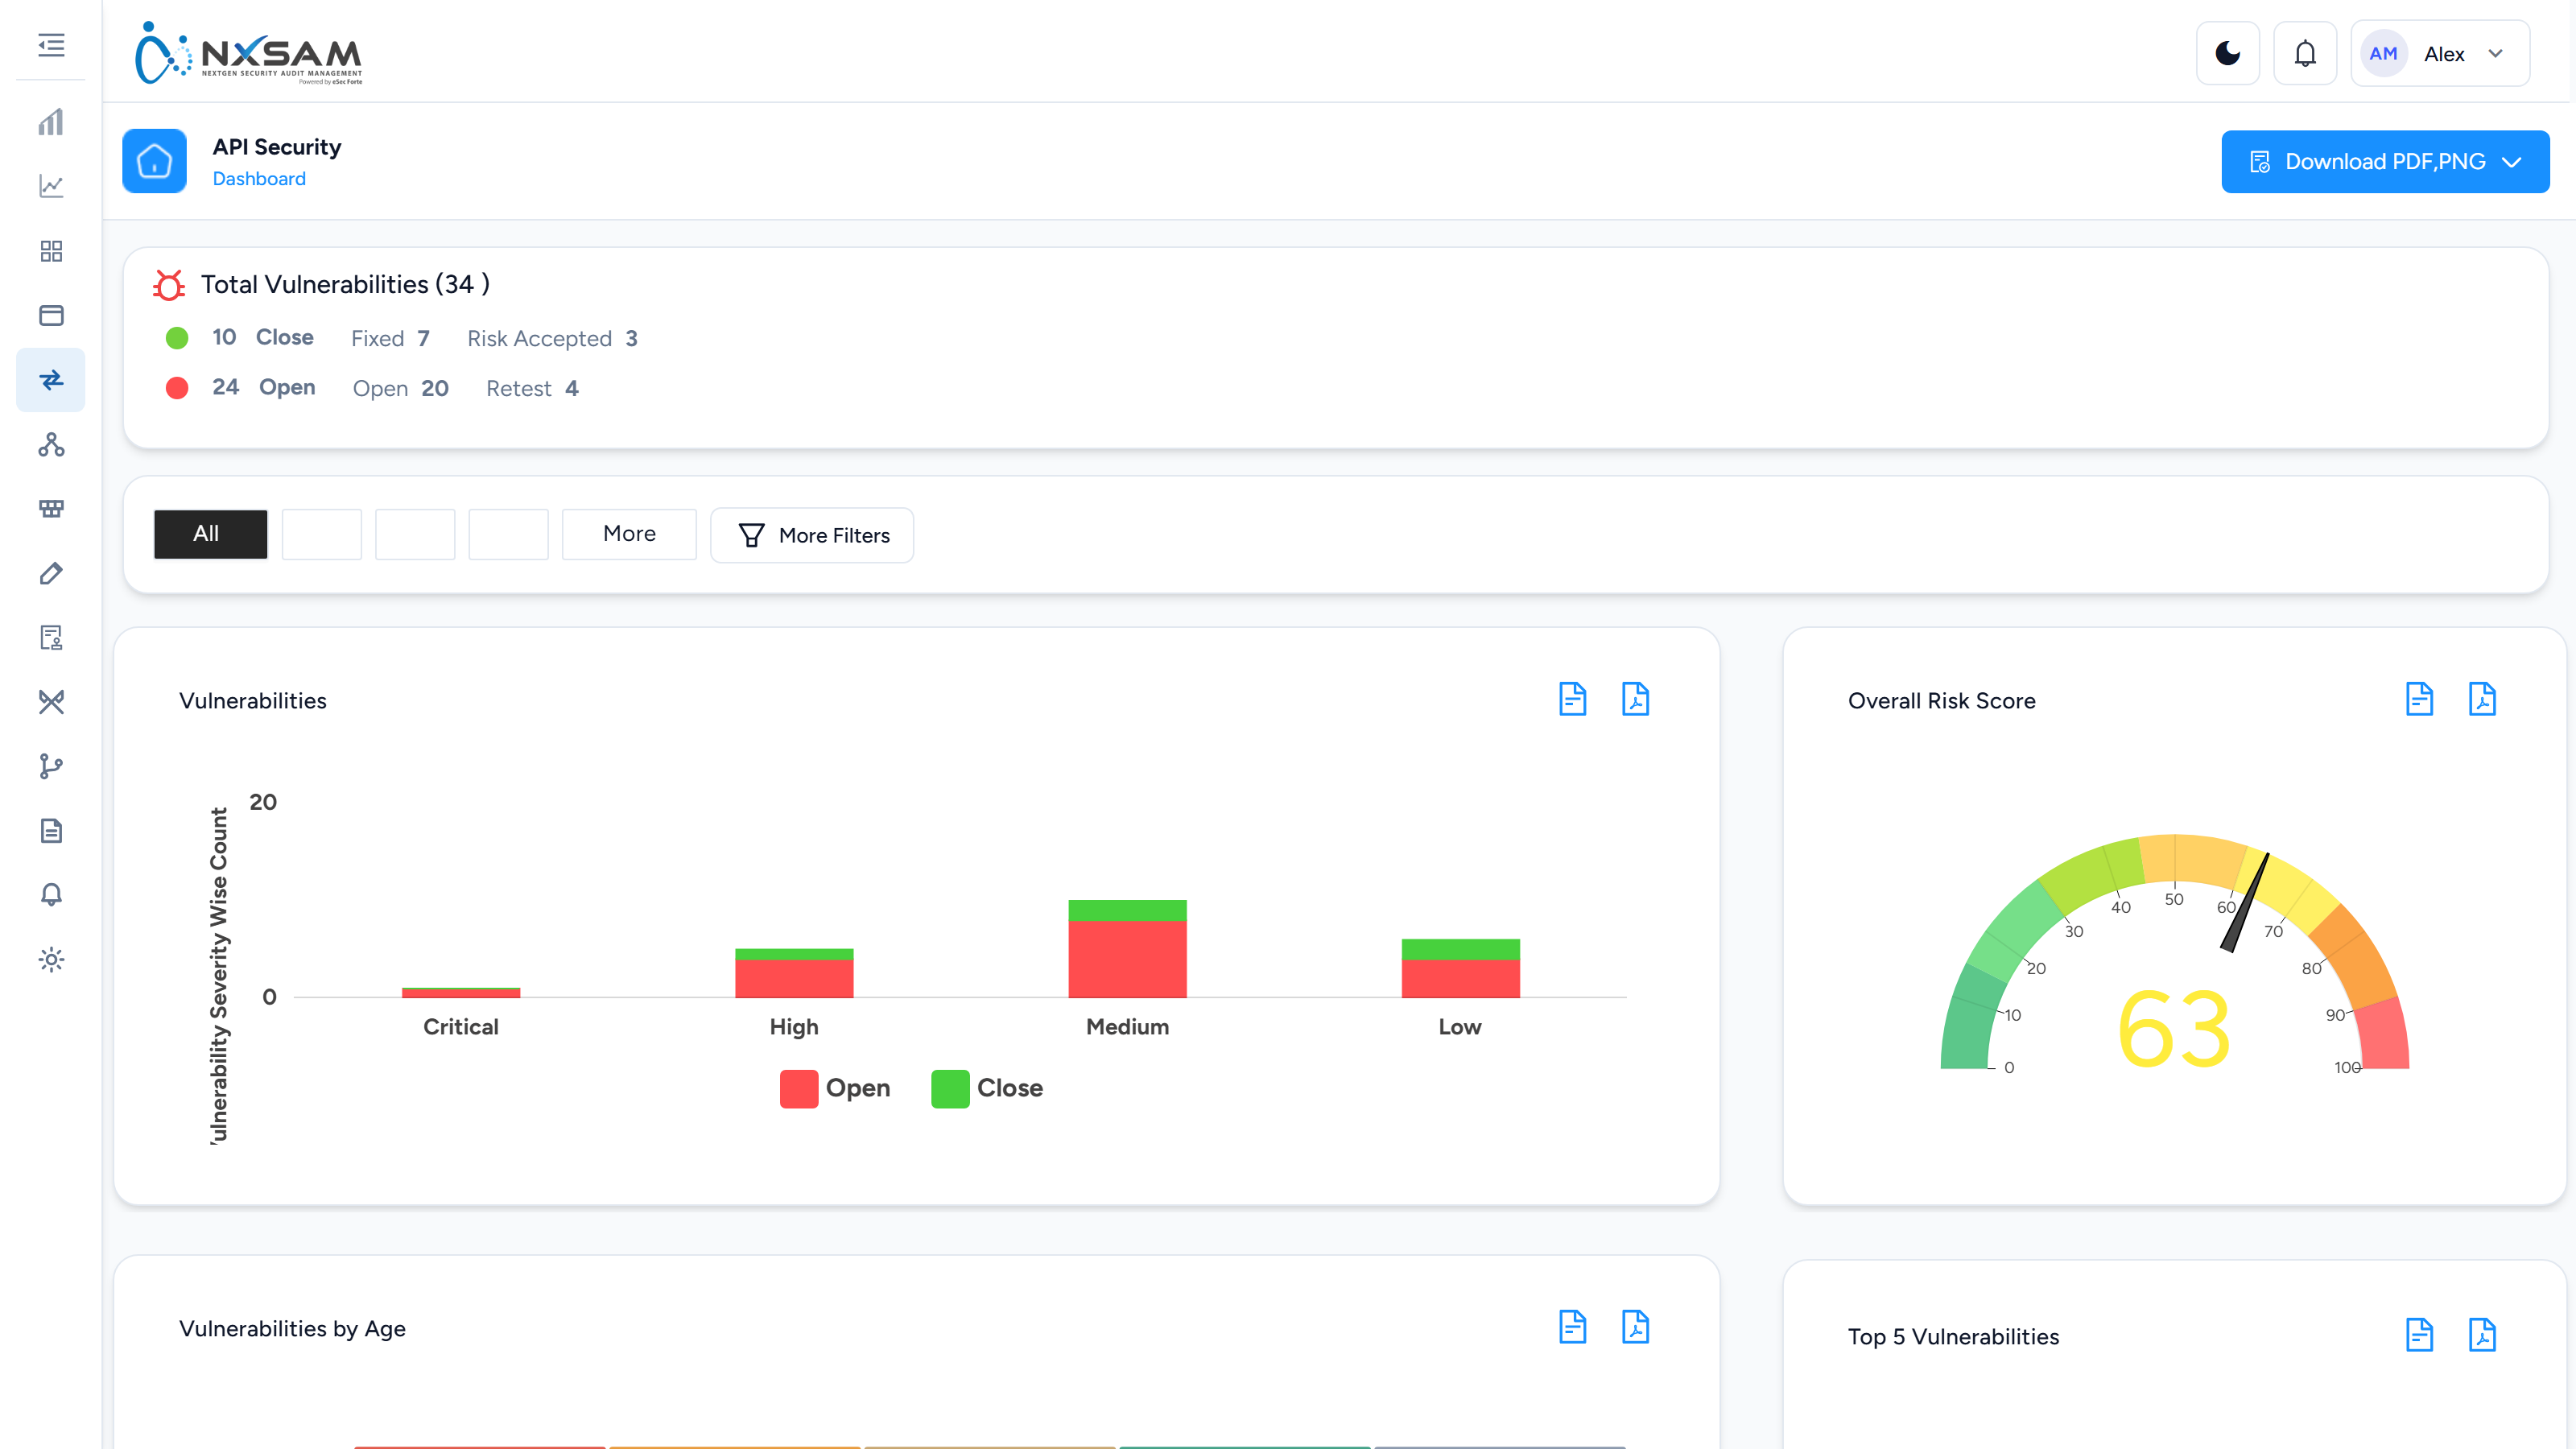
| Screen | Shows |
|---|---|
| Dashboard | API posture at a glance |
| Audits | Assessments performed against your APIs |
| Vulnerabilities | The findings from those assessments |
The lifecycle is the same as everywhere else in NxSAM: findings are discovered, approved, given an SLA by severity, remediated, then validated to close.
Identifying the asset
API assets are identified by their endpoint. Versioned APIs are normally separate assets —
/payments/v1 and /payments/v2 have different code, different findings and often
different owners.
This matters for the forgotten-version problem: if the old version is not registered as an asset, nothing assesses it, and nothing reports that it is still reachable.
Working with API findings
- Authorisation findings first. They are usually exploitable immediately, need no special access, and expose other customers' data.
- Check whether a finding is systemic. One endpoint missing an authorisation check often means a whole class of endpoints shares the pattern. Fixing the pattern is worth more than fixing the instance.
- Retest after fixing. Authorisation fixes are easy to get subtly wrong, and a fix that works for the tested case may not hold for adjacent ones.
Reading the API Security screens
API Security mirrors Application Security closely — same two-status model, same audit structure — with a handful of differences that matter when tracing a finding.
What is different from AppSec
| Application Security | API Security | |
|---|---|---|
| Asset | An application | An API asset — a collection of endpoints |
| Identified by | URL or package | Base URL, usually versioned |
| Finding attached to | The application | The API asset, and often a specific endpoint |
| Status column heading | Current Status | Current Status, under a different underlying name |
The last row is the practical one. The two modules hold the same concept under different names beneath the surface, so a report or export template built for one does not carry the other's status column — which is the usual reason an API export appears to be missing its status. Build the template against the module you intend to export.
The columns
| Column | Notes |
|---|---|
| Track ID | Quote in tickets; survives re-testing |
| Issue title | The finding, with its category |
| Risk | Severity, derived from the score |
| CVSS score | The raw score before context |
| Affected URL | The endpoint, not just the asset — the most useful column here |
| Validation status | Whether the finding is agreed |
| Client vuln status | What is being done about it |
| Discovered on | Last seen, not first |
| SLA duration / expiry | The window and the deadline |
| Creator | Who raised it — often a tester rather than a tool |
| Risk acceptance comment / date | Present inline where the finding was accepted |
Affected URL is where API findings differ in practice
An application finding says "this app has XSS". An API finding says "this endpoint accepts an unauthorised object reference" — and the endpoint is the actionable part.
Two consequences:
- The same weakness on two endpoints is two findings, correctly. Fixing one does not close the other, and a shared fix in middleware closes both only when the next assessment confirms it.
- Grouping by affected URL is usually more useful than grouping by severity, because it maps to the code that has to change.
Why API findings are often manual
Automated scanners struggle with APIs: they need a specification, valid authentication and realistic payloads to reach anything interesting. Much of what matters — broken object level authorisation, excessive data exposure, mass assignment — requires understanding what the endpoint is for.
So a higher proportion of API findings are raised by a tester than by a tool, which is why the Creator column is worth reading and why evidence attached to the finding carries more weight here than in a scanner-driven module.
Audits scope the list
Like AppSec, this screen always shows findings within an audit. A finding you expect and cannot see is usually in a different audit rather than missing — check the audit selector before treating it as absent.
API Security: every screen, column and action
API Security mirrors Application Security in structure and differs in several details that matter when tracing a finding — including two audit-table implementations whose menus are worded differently for the same operations.
The audit list
| Column | What it holds |
|---|---|
| Request Info | Who requested the audit, when, and the request ID |
| Audit Details | Audit name and the API asset it runs against |
| Vulnerabilities | Open counts with the severity split and the risk score |
| Audit Properties | The chips — type, cycle, category, scope, considered |
| Audit Status | A dropdown offering only the legal next steps |
Row actions — twelve
| Action | What it does |
|---|---|
| View Vulnerabilities | The findings for this audit |
| Vulnerability Overview | Severity and asset summary without leaving the list |
| Manage Audit Scope | Records what was in and out of scope |
| Manage Test Summary | A free-text description of what testing was performed |
| Assign Auditors | Who performs the work |
| Edit Audit Details | Name, cycle, dates, properties |
| Edit Tags | Labels for grouping and reporting |
| Update Audit Start Date | Changes the start date after creation |
| Re-Audit | Creates a follow-up audit against the same scope |
| View Audit Chain | The original and every re-audit in sequence |
| View Audit Status History | Every status change with who made it |
| Delete Audit | Soft delete |
Manage Test Summary is what makes an API audit defensible
APIs are largely tested by hand, so the summary is the record of what was actually attempted — which endpoints, which authentication, which abuse cases. An audit without one cannot be reviewed later, and an auditor asking "what did you test" is asking for this field.
Two audit tables, two vocabularies
The module ships two audit-table components. One labels its menu Assign Auditors, Edit Audit Details, Manage Audit Scope; the other labels the same operations Assign Api Auditors, Edit Api Audit Details, Manage Api Audit Scope, and View Api Audit Chain / View Api Audit Status History.
They do the same things. If a caller quotes a menu item you cannot find, this is why — ask which screen they reached it from rather than assuming a version difference.
The vulnerability list
| Column | Notes |
|---|---|
| Vulnerability | The finding and its category |
| Tool | Which scanner reported it, or Manual |
| Risk | Severity as derived from the score |
| Validation | Whether the finding is agreed |
| Current Status | What is being done about it. API Security keeps its own status list, separate from the AppSec one |
| Discovered On | Last seen, and blank until the finding is approved |
| SLA Details | Duration and expiry |
| Artifacts | Evidence attached to the finding |
Row actions — eight
| Action | What it does |
|---|---|
| Edit Vulnerability | The finding's own fields |
| Edit CVSS Metrics | The CVSS vector, component by component |
| View CVSS Metrics | The same, read-only |
| Edit Issue Master Details | Edits the underlying catalogue entry, not just this instance |
| Edit Sequence | Reorders findings within the report |
| View Vulnerability History | Every change to the finding |
| View Client Status History | Status changes specifically, with who made them |
| Delete Vulnerability | Removes the finding from the audit |
Edit Issue Master Details changes the catalogue, not the finding
The two edit actions sit next to each other and do different things. Edit Vulnerability changes this occurrence. Edit Issue Master Details changes the master entry — the title, description and remediation that every occurrence of that vulnerability inherits, across every audit and every asset.
Correcting a typo through the master is right. Recording something specific to one endpoint through it is not, and the effect is not obvious from the dialog.
Edit Sequence matters because API findings are usually presented as a narrative — a chain where one weakness enables the next. The sequence is the order they appear in the generated report, and it is set deliberately rather than by severity.
Artifacts
Evidence attached to a finding, structured as steps:
| Column | What it holds |
|---|---|
| Step | The position in the reproduction sequence |
| Description | What was done at this step |
| Images | Screenshots for that step |
This is the reproduction path. An API finding is often only demonstrable as a sequence — authenticate as A, obtain a token, alter an identifier, read B's data — and a single screenshot proves nothing. The step structure is what makes it re-testable by someone other than the original tester.
Vulnerability history
| Column | What it holds |
|---|---|
| Audit ID / Audit Details | Which audit the change belongs to |
| Risk | The severity at that point |
| Vulnerability Status | The status it moved to |
| Created On | When |
| Status Changed By | Who |
Because it spans audits, this is how you see that a finding was closed in one assessment and re-opened by the next — the single most common dispute on a re-test.
Add Old Vulnerabilities
Opened when creating a re-audit. It lists findings from previous audits — vId,
Vulnerability, Audit Name, Risk, Client Status — so the ones still
outstanding can be carried into the new audit rather than re-entered.
Carrying a finding forward preserves its history and its original discovery date. Entering it again creates a second finding with neither, and the two then age separately, which is why the option exists.
Edit Tags
Tag ID and Tag Name, multi-select. Tags are shared across audits, so renaming one here renames it everywhere it is applied.
The status models
API Security keeps its own master tables. The values overlap Application Security's without matching them, so a status list quoted from one module will not fit the other.
Audit status — fourteen values
In sequence: Saved, Reverted, Requested, Approved, Scheduled,
Work In Progress, Not Hold, Completed, Report Published, Aborted,
Review Requested, Processed, Changes Requested, PMO Verified.
- Closed types —
CompletedandAbortedonly. - Comment required —
Aborted,Changes RequestedandPMO Verified, and any other status the administrator has marked as needing a reason. Moving an approved audit to Hold asks for one. Report Publishedsits afterCompleted: the assessment is finished and the report has been issued, which are separately meaningful to a customer.Not Holdis the release from a hold rather than a hold itself, despite reading like one. Nothing is placed intoNot Holdto pause it.
Validation status — five values
Saved, Submitted, Approved, Closed, False Positive — the same five as
Application Security, and notably not the three Network PT uses.
Client status — fourteen values
New, Patch in progress, Patched, Not Patched, To be patched, On hold,
Reopen, Validated, Not Applicable, Risk accepted, Risk acceptance, Duplicate,
Exception Handled, Expired.
Closed types are Validated and Exception Handled. Not Applicable and Risk accepted
require a comment; Risk accepted, Risk acceptance and Expired display a date
alongside the status.
The dashboard
Each widget exports individually through Download PDF and Download PNG.
API Security: find the right screen
Every screen in this module, what each one is for, and where it lives. Use it to find the right screen quickly, and to confirm you are on the one a colleague means — several screens in this product have similar names and different jobs.
Screenshots come from a demonstration data set, so the figures are illustrative. Click any screenshot to open it at full resolution.
API Audits
Assessments against API assets. Reached the same way as AppSec audits, tracked separately.
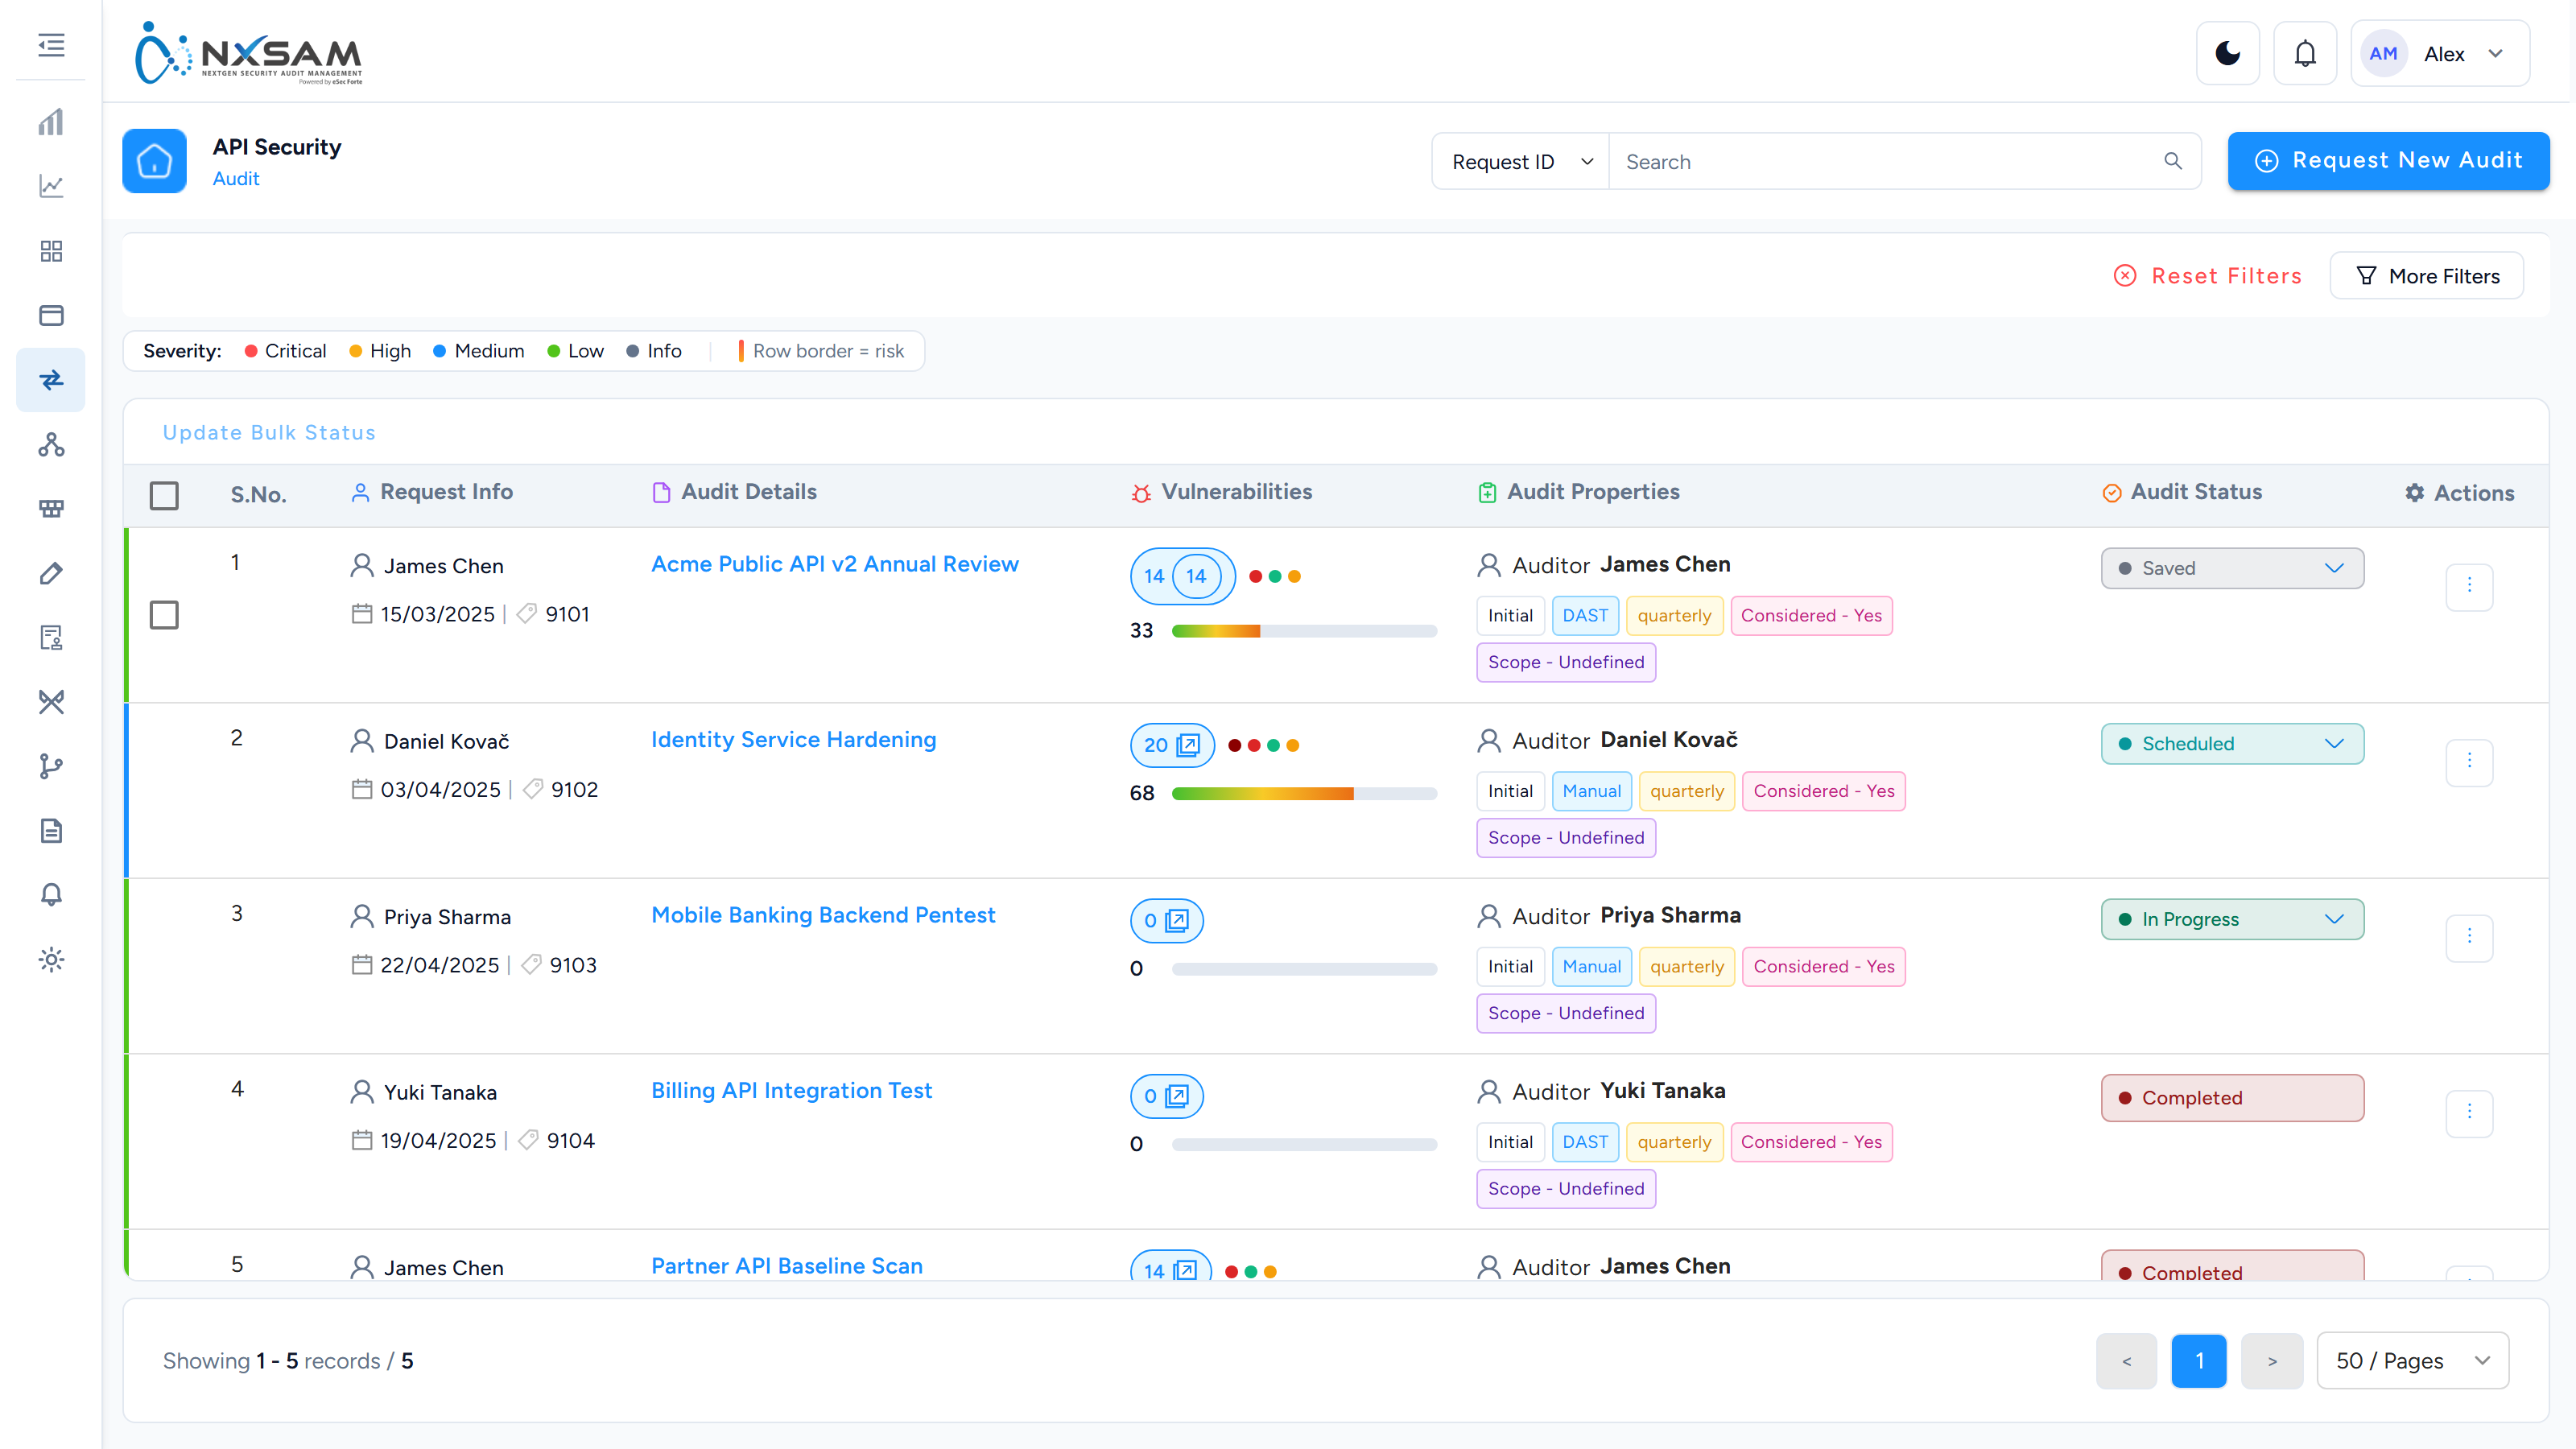
API Vulnerabilities
Findings within an API audit. Same two-status model as AppSec — validation and client status move independently.
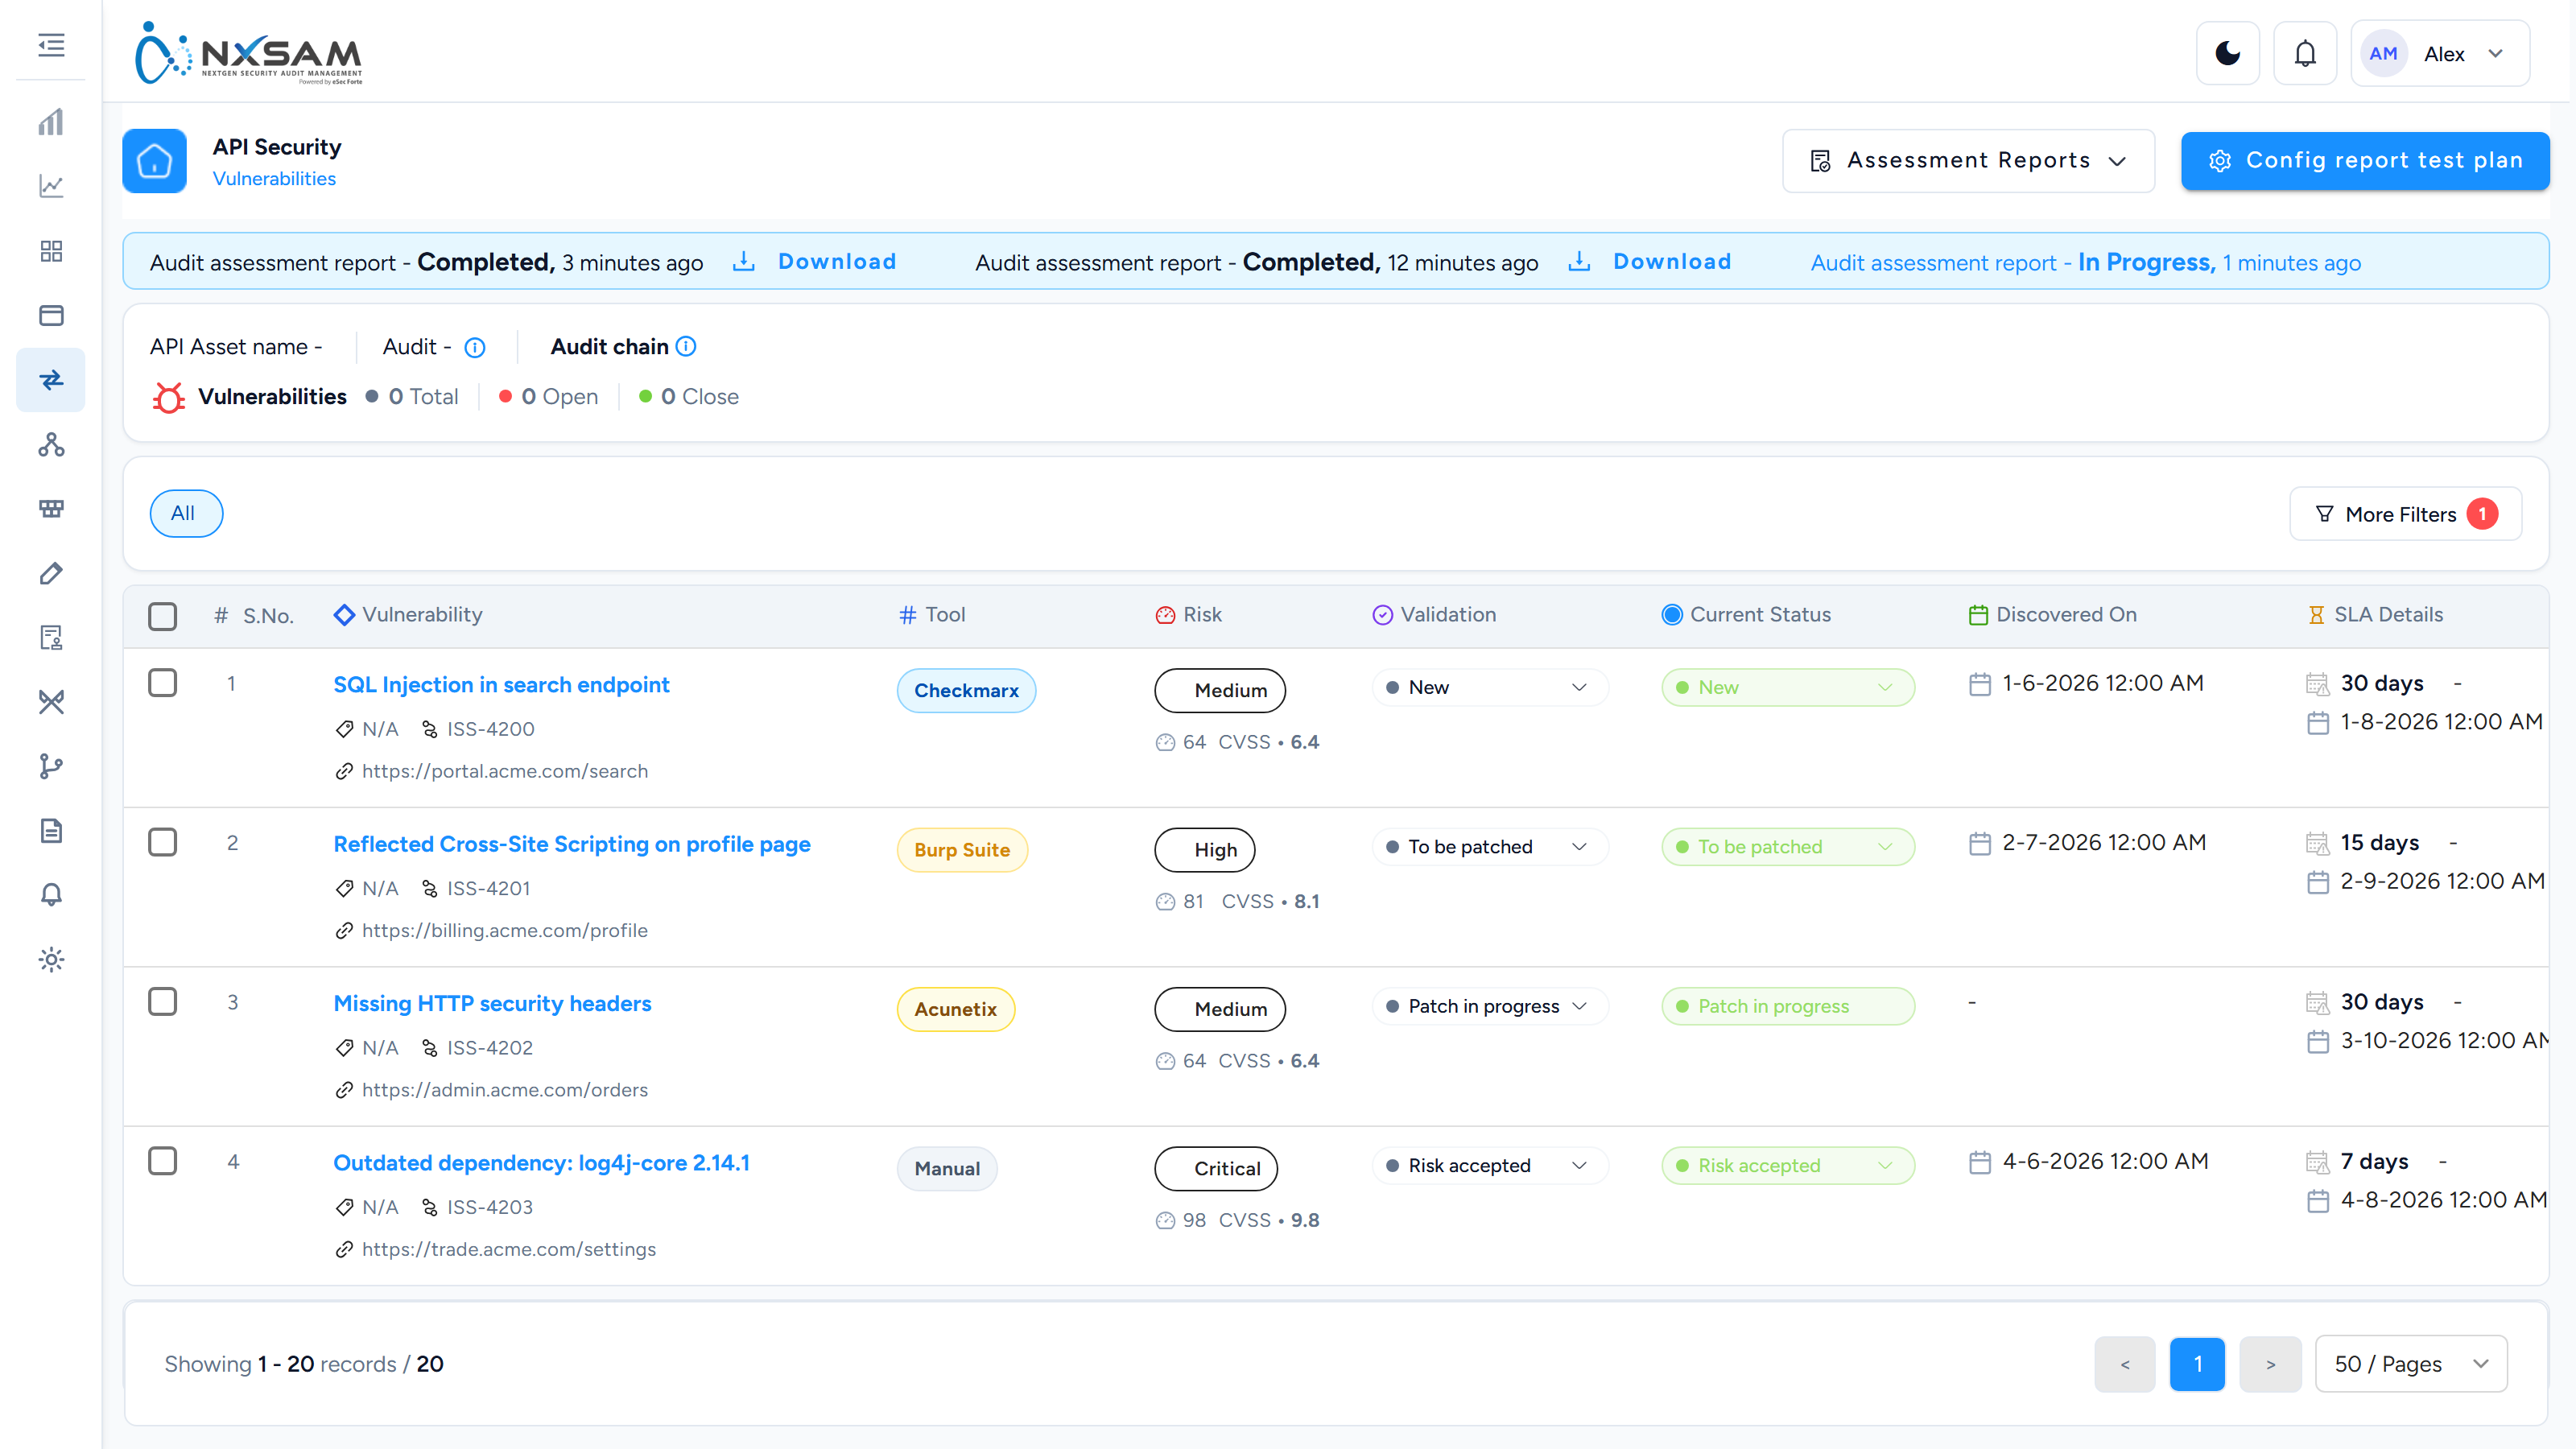
API Security: support reference
Internal. The customer-facing explanation is in Reading the API Security screens and the screen reference.
API Security looks like Application Security and is a separate module with its own masters. Assuming the two behave identically causes most of its tickets.
It is not Application Security with a different name
| Application Security | API Security | |
|---|---|---|
| Asset | An application | An API asset — a collection of endpoints |
| Identified by | URL or package | Base URL, usually versioned |
| Finding attached to | The application | The API asset, often a specific endpoint |
| Status lists | Its own | Its own, different ones |
The status masters are genuinely separate: API Security ships fourteen audit statuses, five validation statuses and fourteen client statuses, and they are not the same list as AppSec's. A support answer that quotes an AppSec status may name a value this module does not have.
Exports built for the wrong module
Because the two modules hold the same concept under different names beneath the surface, a report or export template built against Application Security does not carry API Security's status column, and vice versa.
"The export is missing its status" is nearly always a template built against the other module. Rebuild it against the module being exported rather than editing the output.
Versioned assets
An API asset is usually versioned, and v1 and v2 are separate assets. Findings do not move between them, and a customer who has "fixed it in v2" still has an open finding on v1 until v1 is decommissioned.
Counts that look duplicated across versions are usually correct.
Endpoint-level findings
A finding often names a specific endpoint rather than the whole asset. Two findings on the same asset with the same title and different endpoints are two findings, not a duplicate.
Artifacts are permission-gated
The Artifacts column shows a view control only to roles holding the API proof-of-concept permission. For everyone else the column is present and empty — the control is absent rather than disabled, so it reads as missing evidence rather than as a permission.
Confirm the caller's role before treating an empty Artifacts column as lost data.
The same platform rules apply
- Nothing counts until Validation reaches Approved; Discovered On is blank until then.
- Only considered audits reach dashboards.
- Only two statuses close a finding.
- An audit counts on the date it reached a final state.
What to collect before escalating
- Audit ID and API asset, including the version.
- The exact Validation and Current Status values — quoted, because this module's lists differ from AppSec's.
- Whether the audit is considered.
- For export complaints: which module the template was built against.
- For missing artifacts: the caller's role.
Network Security
Network Security
Network Security covers weaknesses in your infrastructure — servers, network devices and the services running on them. It holds three distinct kinds of assessment.
Three kinds of assessment
| What it is | |
|---|---|
| VA — Vulnerability Assessment | Automated scanning, usually on a schedule, usually high volume. Findings arrive from tools such as Qualys, Tenable, Nessus or Nexpose. |
| PT — Penetration Testing | Human-led testing. Lower volume, higher depth, and each finding is written by the tester. |
| Segmentation | Verification that networks that should be separated actually are — commonly a PCI DSS requirement. |
They are separated because they behave differently. A VA audit may carry thousands of machine-generated findings; a PT audit may carry a dozen carefully written ones. Reporting and workflow differ accordingly.
VA: the shape of the work
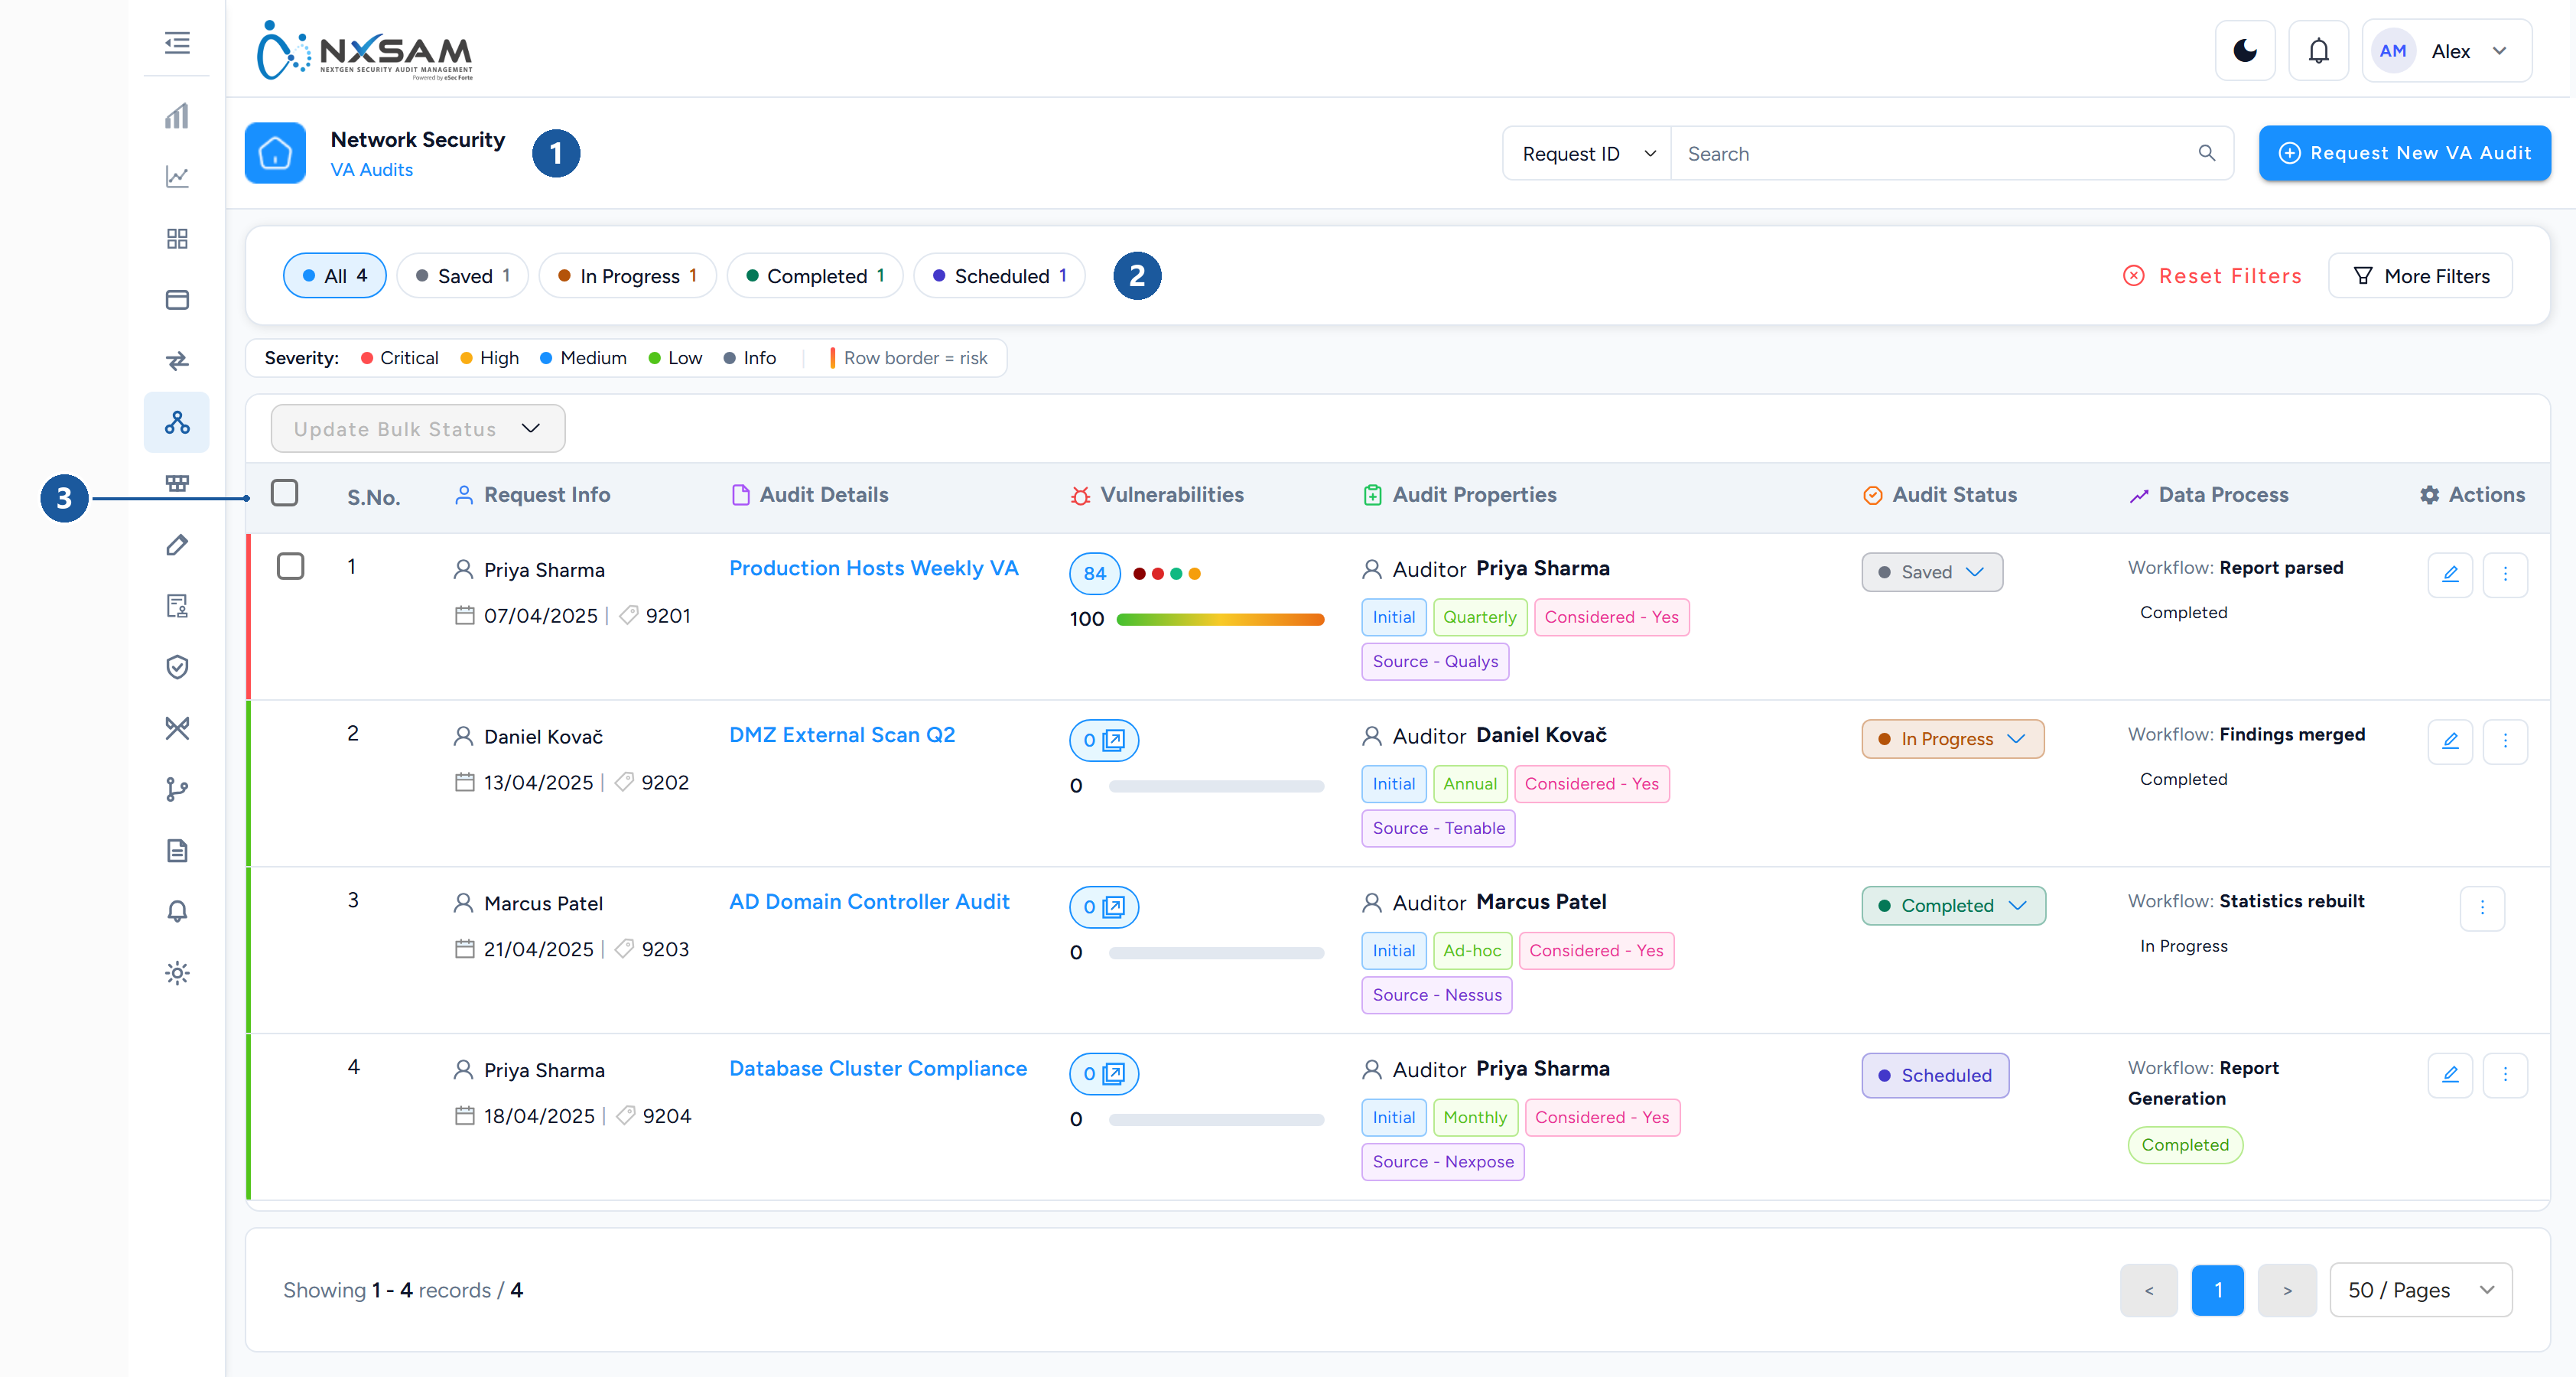
1 module and screen · 2 filter by status · 3 audit columns
- A scan runs in your scanning tool.
- Its results reach NxSAM, either by integration or by uploading the report.
- Findings are matched against what is already known, so a weakness seen before continues as the same record rather than becoming a new one.
- New findings are assigned SLAs by severity and become visible to asset owners.
- Owners remediate; a later scan confirms the fix; the finding is validated and closed.
The same weakness on ten hosts is ten findings
Network findings are per host. A missing patch across ten servers produces ten findings, because each host must be fixed and verified individually.
This is why VA counts are much larger than application counts, and why they move sharply when a widely-deployed component is patched.
Repeat scans and reopening
A finding fixed and validated, then seen again by a later scan, comes back as Reopen. Reopening is informative rather than a failure of process — it usually means a patch was rolled back, a host was rebuilt from an old image, or a configuration drifted.
Persistent reopening on the same host is worth investigating as a build or configuration problem rather than as a series of unrelated findings.
Working with high-volume findings
VA generates far more findings than anyone can address individually, so it is normally worked in groups:
- Filter by severity and by asset criticality together — Critical findings on production assets first.
- Group by vulnerability rather than by host when a single patch resolves many findings at once.
- Use SLA state to see what is genuinely urgent rather than merely numerous.
PT: what is different
Penetration test findings are written by people, so they carry narrative detail, reproduction steps and evidence. They are usually fewer, more severe, and more likely to need discussion before remediation.
The lifecycle is the same — findings are approved, assigned SLAs, remediated and validated — but the volume means each one is normally handled on its own merits.
Run a network VA assessment, end to end
This walks one assessment from request to closure, naming what you need at each step, what changes when you act, and where it commonly goes wrong.
Every screen shown here is illustrated with demonstration data.
Before you start
| You need | Why |
|---|---|
| The hosts in scope | Scope is a host list, and it settles later disputes |
| An audit type and cycle | They decide which properties are mandatory |
| An auditor account | An audit can be created without one and cannot be worked |
| Permission to request an audit | Controls you lack are hidden, not disabled |
1. Create the audit
Open Network Security → VA Audits and choose Request New Audit.
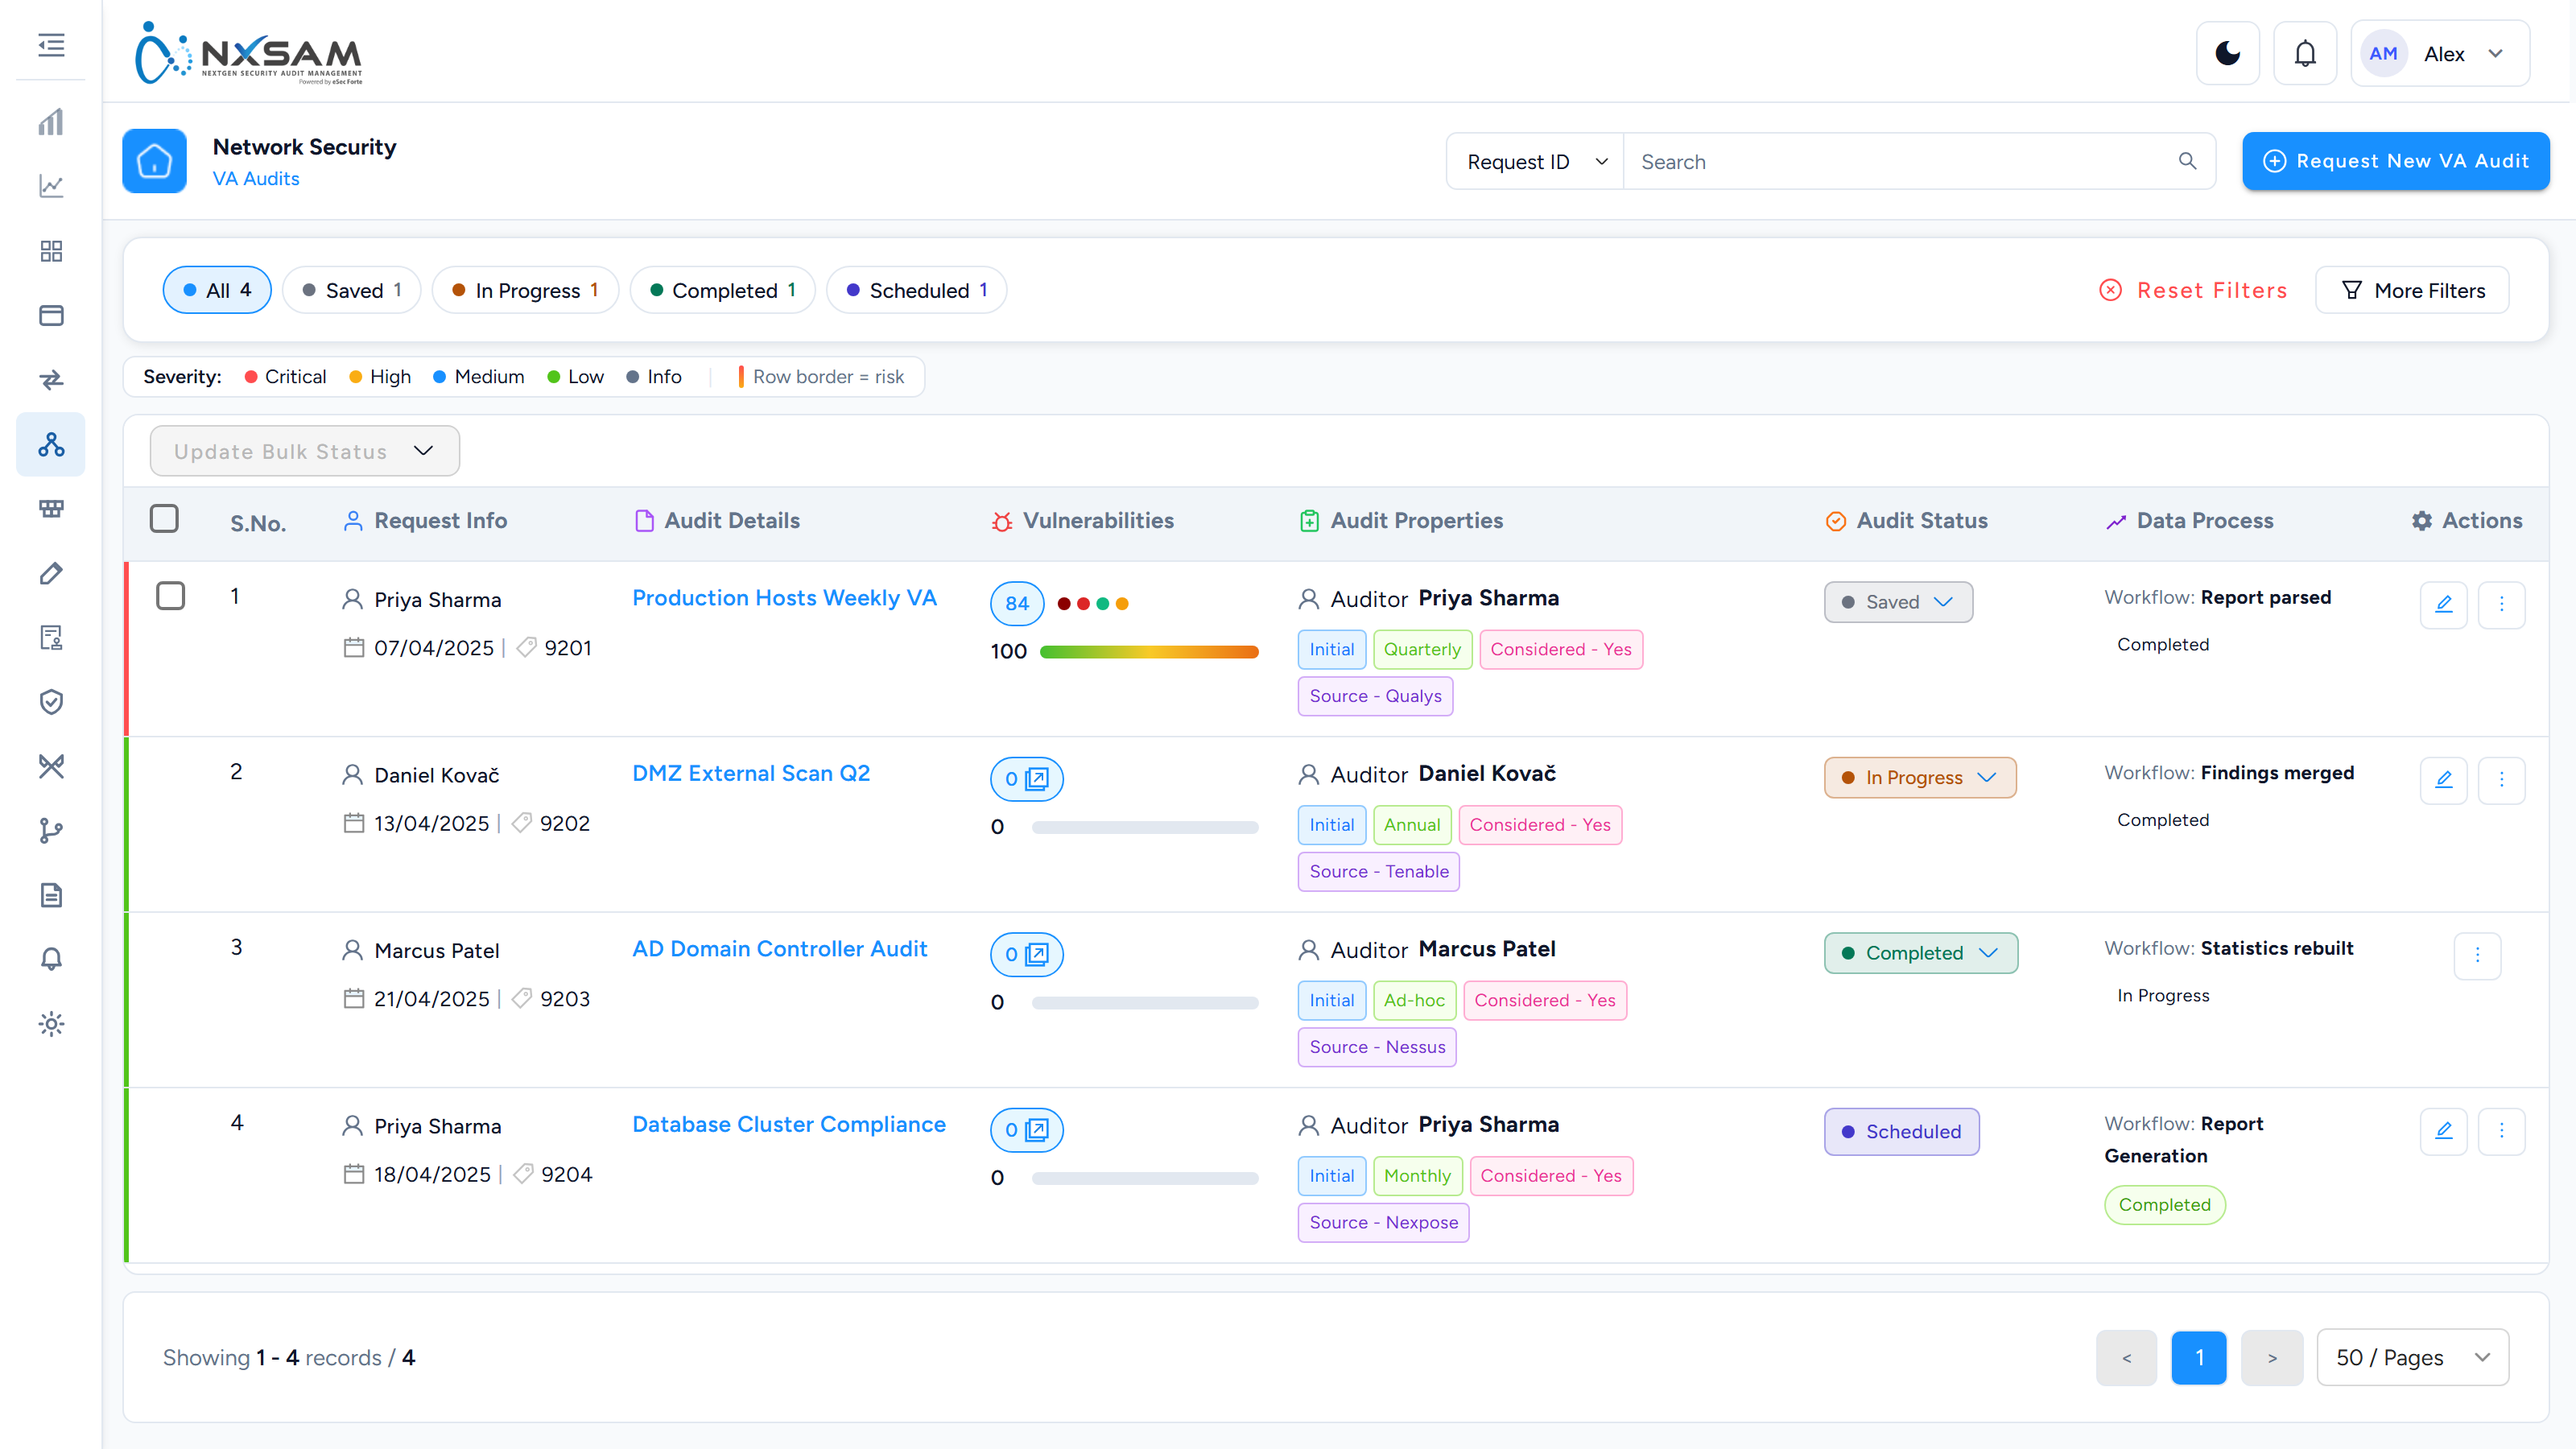
Fill the audit's name, type, category and cycle. Properties marked mandatory must be completed before the form will save — which properties are mandatory depends on the asset type and audit type together, so two audits can demand different fields.
After you save: the audit exists in its first status and appears in the list. It counts towards nothing yet.
One audit at a time per asset, where the platform is set that way
If an asset in your scope already has a VA audit in progress, the request may be refused with a message naming the rule — only one on-going VA audit per asset. That is a platform setting (System → System Settings) rather than a fault: two concurrent scans of one host would produce two sets of findings for one state. Wait for the running audit, or take the asset out of this one's scope.
Assign an auditor now
An audit can be requested and approved with no auditor assigned, and then cannot be worked. An audit sitting in an approved state with nothing happening is usually this.
2. Define the scope
Use Manage Audit Scope on the audit's row menu to set the hosts covered.
Export IPs downloads that list. Keep it: when the scanning team and the platform disagree about coverage later, comparing this export against the tool's own target list settles it in minutes.
3. Bring in the findings
Either upload a scan report, or let a configured integration collect it. Both are queued.
The Data Process column on the audit list shows how far a tool-fed audit has got. It is the difference between "the upload finished" and "the data is ready".
While it processes: counts move on every refresh. That is the job running, not the figures being wrong.
Counts that jump after an import
If totals appear to double, the identity rule changed — findings that were matched to existing records no longer match, so they arrive as new. Treat a change to the VA key configuration as a data migration, not a preference.
4. Work the findings
Open the audit to reach its findings.
Each row is a host with its severity split. Drill in for the individual findings on that host.
Two fields track two different things, and both are needed:
- Validation — has this been confirmed as a real finding?
- Current Status — what is being done about it?
5. Approve
Nothing is counted anywhere until Validation reaches Approved.
After approval: the finding appears in dashboards and reports, Discovered On is populated — it is deliberately blank before this — and its SLA clock starts from the severity and asset type.
This single step explains most "my finding isn't in the dashboard" questions.
6. Remediate and close
As work proceeds, move Current Status — to be patched, patch in progress, and so on. Some transitions require a comment; the confirmation dialog says so before you commit.
Only two statuses actually close a finding
Validated and Exception Handled. Everything else — including Risk accepted — still counts as open.
That is deliberate: accepting a risk is a decision about treatment, not a statement that the weakness is gone.
7. Complete the audit, and make it count
Move the audit to a final state.
After completion: the audit becomes eligible to be considered, and the date it reached that state is the date every aggregate view files it under — not the scan date, and not the import date.
A scan run in March, imported in April and completed in May is a May audit. If a customer says findings appear in the wrong month, this is almost always why.
8. Re-test
Create a Re-Audit against the same scope. It inherits the parent's scope and is marked as a follow-up rather than as an independent assessment, so the two are not counted as two rounds of testing.
When something looks wrong
| Symptom | First thing to check |
|---|---|
| Finding not in the dashboard | Is it approved? Is the audit considered? |
| Audit in the wrong month | The date it reached a final state |
| Numbers keep changing | Data Process — it is still running |
| Numbers doubled | The vulnerability key configuration changed |
| Action missing from a menu | Your role — hidden, not disabled |
| List looks empty | A filter is still applied from an earlier screen |
Reading the Network Security screens
VA and PT look similar and are structured completely differently, because they answer different questions. Knowing which is which saves most of the confusion in this module.
VA: a grid of counts, not a list of findings
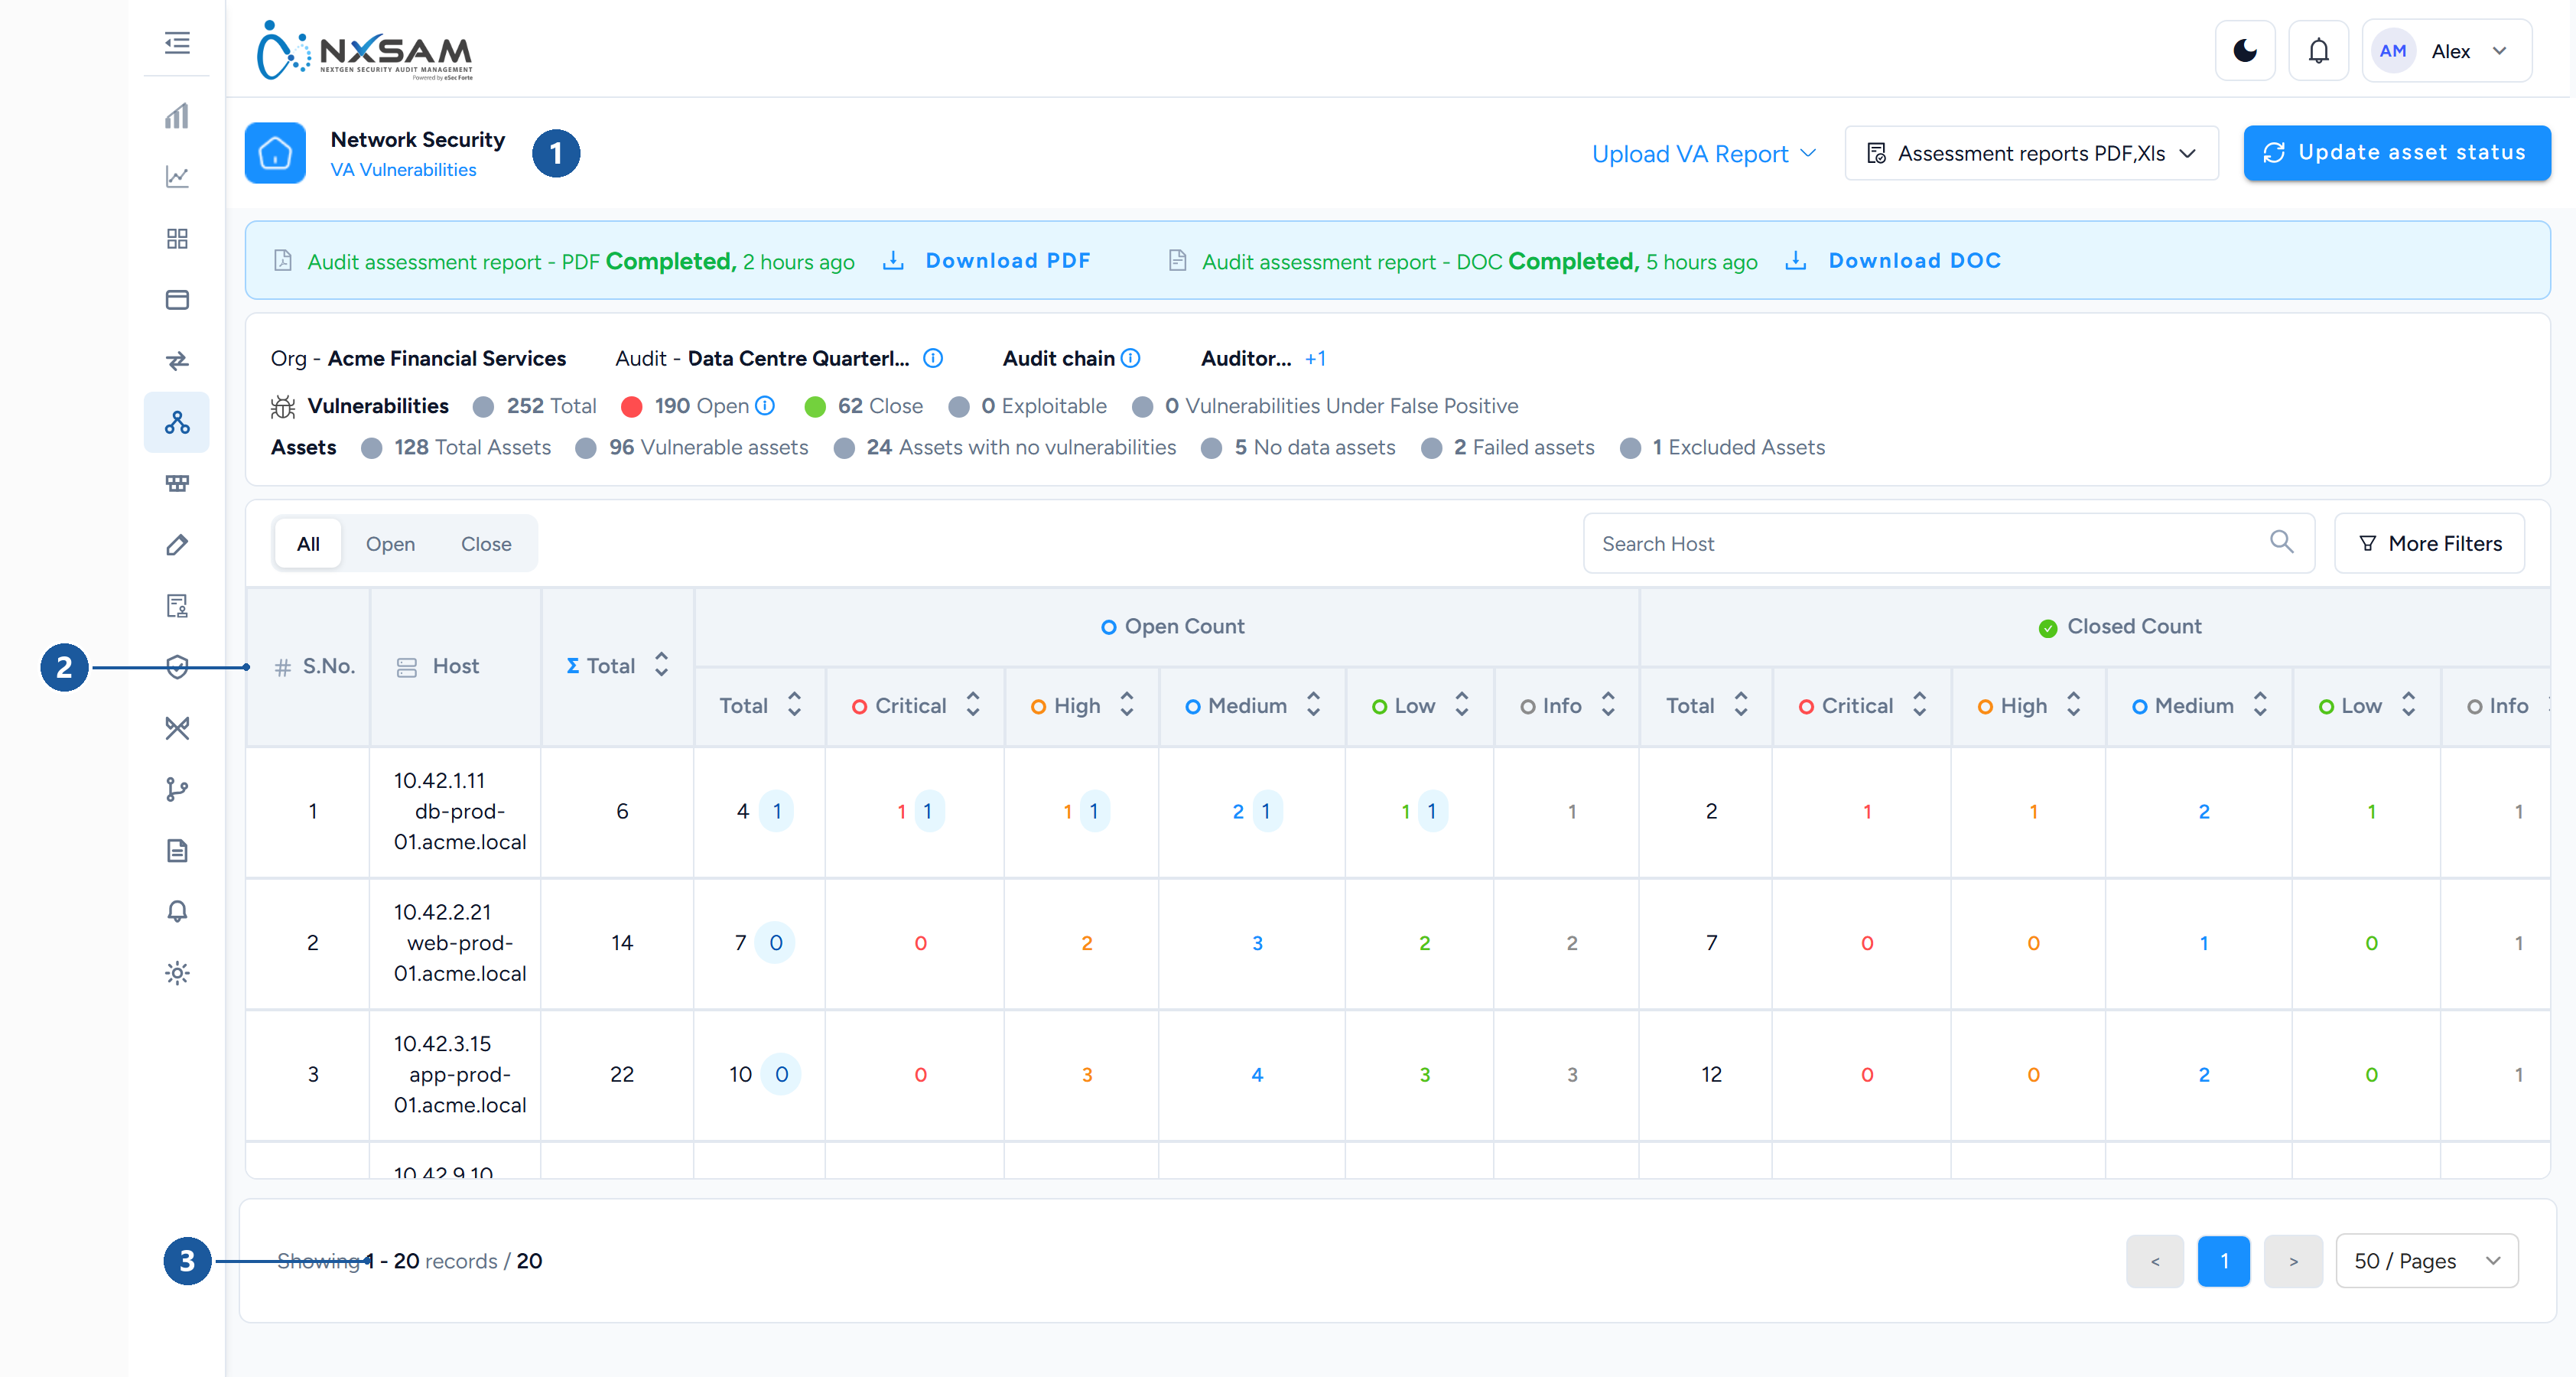
1 module and screen · 2 one row per host, counts per severity · 3 paging
The first thing to understand: one row is one host, not one finding. A scan of 200 machines produces 200 rows regardless of how many vulnerabilities it found.
The count columns
Each severity appears up to three times across the row, and the three mean different things:
| Column family | Meaning |
|---|---|
open_<severity> |
Currently open on this host at that severity |
closed_<severity> |
Closed on this host — fixed and confirmed by a later scan |
<severity>_exploitable |
Of the open ones, how many have a known exploit |
Plus Open, Closed and Total counts for the row.
The closed columns are hidden entirely when nothing on the screen is closed, so a column set that changes between two audits is the table adapting, not data disappearing.
Exploitable is the column to sort by
Severity says how bad the weakness is in theory. Exploitable says whether someone has already written the tool to use it. A host with two exploitable Mediums is a more urgent problem than one with six theoretical Highs, and the exploitable count is the only column that surfaces this.
Host name and IP
Both are shown because both are used for matching. If findings land against a host you did not expect, compare these two against the scanner's own record — short name against fully-qualified name is the usual cause.
Status, updated on, comments
Status is the host-level working state, Updated On is when it last changed, and Comments carries whatever the analyst recorded. Updated On moves when the status moves, not when the host was last scanned — those are different dates and are frequently confused.
PT: a list of findings with evidence
The penetration testing screen is closer to AppSec than to VA. One row is one finding, because a manual test produces tens of findings rather than thousands.
| Column | Notes |
|---|---|
| Track ID | Quote this in tickets |
| Issue title | What the tester found |
| Host and port | Where — a manual finding is usually specific to a port |
| Risk | The tester's rating, not a tool's score |
| Validation status | Whether the finding is agreed |
| Status | What is being done about it |
| Observation added | Whether the tester attached evidence |
| Document | The evidence itself |
Why PT has evidence and VA does not
A scanner finding is reproducible by re-running the scanner. A manual finding often is not — it may depend on a sequence of steps, a particular account, or timing. The observation and the attached document are the proof, and a PT finding without them cannot be verified by anyone but the original tester.
If a PT finding is disputed, the first question is whether an observation was recorded.
Risk acceptance on PT findings
The acceptance's comment and date appear directly on the row. A PT finding that has been accepted shows why and until when, without leaving the screen — useful during a review, and the reason accepted findings are not simply hidden.
Segmentation: neither of the above
Segmentation audits test whether network separation holds — whether a source can reach a
destination on a port it should not. Findings are about paths, not hosts or software, so
a finding reads as a source, a destination, a port and a protocol, with UDP Added and
TCP Added recording what became reachable.
The useful question here is not "how severe" but "was this path supposed to exist" — which is why the screen shows source and destination side by side rather than ranking by severity.
Which screen answers which question
| Question | Screen |
|---|---|
| Which machines are worst? | VA vulnerabilities |
| Which single patch helps most? | Overall vulnerability status |
| What exactly is this finding? | Vulnerability detail |
| What did the tester actually do? | PT vulnerabilities, with the observation |
| Did segregation hold? | Segmentation findings |
| Has the scan finished loading? | VA import queue |
The last one is worth checking before any of the others. A partly loaded scan looks identical to a complete smaller scan.
Network Security: every screen, column and action
This module has more screens, more row actions and more status values than any other, and it does not share its status model with Application Security even where the words look the same. Everything below is taken from the product's own tables and templates.
The status models — four of them, all different
Network Security does not reuse the AppSec statuses
The words overlap and the sets do not. Quoting an AppSec status list to a VA caller will not match what they see.
Audit status — twelve values
Saved → Requested → PMO Verified → Approved → Scheduled → IN PROGRESS →
Completed, with Failed, Aborted, Review Requested, Changes Requested and
Reverted as the exceptions.
Two properties decide behaviour:
- Comment required —
Failed,Changes Requested,Reverted,PMO VerifiedandAbortedwill not save without one. The others save silently. - Closed type — only
CompletedandAborted. An audit sitting inReview Requestedis still open however finished it looks.
PMO Verified sits between Requested and Approved and exists for organisations
running a project-management gate before scanning starts. Where that gate is not used the
status is simply never selected.
VA vulnerability status — eleven values
New, Patched, False Positive, In Progress, Reopen, Exception Applied,
Verified, Validated, Risk Accepted, Risk acceptance, Expired.
Closed types are Exception Applied, Verified and Validated — three, where the
AppSec side has two, and Patched is again not one of them.
False Positive, Reopen and Risk Accepted require a comment.
PT vulnerability statusThe same eleven names in a separate table, so a status renamed for VA does not change for
PT. Risk accepted and Risk Acceptance additionally display a date.
PT validation status — three values
Saved, Submitted, Approved. Three, not the five Application Security uses —
there is no Closed and no False Positive at validation level here, because a PT
false positive is recorded through the vulnerability status instead.
VA Audits
The busiest screen in the module.
Columns
| Column | What it holds |
|---|---|
| Request Info | Who requested the audit, when, and the request ID to quote in tickets |
| Audit Details | Audit name and the assets or scan target it covers |
| Vulnerabilities | Open counts with the severity split, and the audit's risk score |
| Audit Properties | The chips — cycle, type, tool, scope and whether the audit is considered |
| Audit Status | A dropdown offering only the legal next steps from the current status |
| Data Process | Whether imported scan data has finished processing for this audit |
Data Process is the one people miss. An audit can be Completed while its data is
still being processed, and counts will keep moving until that finishes. Check this column
before investigating a total that will not settle.
Row actions — twelve
| Action | What it does |
|---|---|
| View Vulnerabilities | Opens the findings for this audit — the normal drill-down |
| Vulnerability Overview | A summary by severity and host without leaving the list |
| Add More Assets | Extends the audit's scope to further hosts after it was created |
| Export Assets | Downloads the asset list in scope, for reconciling against the scanner |
| Manage Audit Scope | Records what was in and out of scope, with a description and an optional image |
| Manage Severity Config | Overrides how this audit's severities are derived |
| Assign Auditors | Sets who performs the work |
| Edit Audit Details | Name, cycle, dates and properties |
| Edit Tags | Free-form labels used for grouping and reporting |
| Re-Audit | Creates a follow-up audit against the same scope |
| View Audit Chain | Shows the original and every re-audit in sequence |
| View Status History | Every status change, with who made it and any comment |
| Delete Audit | Soft delete — the record is hidden, not destroyed |
Manage Severity Config changes this audit's numbers only
It overrides the derivation for the audit it is opened from. Two audits of the same hosts can therefore report different severities for the same finding, legitimately. If two scans disagree and nothing else explains it, check this first.
View Audit Chain is the answer to "why do we have four audits for the same subnet" — they are a chain of re-audits, and the chain view shows which is current.
Launching or uploading a scan
The upload dialog is a full scan-configuration form, not a file picker. What it asks for depends on the tool:
| Field | Applies to |
|---|---|
| Tool | Which scanner this data comes from or runs on |
| Type | Upload an existing report, or launch a scan |
| Credential type / Credentials | The account the scan authenticates with |
| Scanner | Which scanner appliance runs it |
| Policy / Option Profile | The scan policy — what is checked |
| Template / Template type | Report template for the output |
| Repository / Scan zone / Folder | Where the scanner stores results |
| Work flow | How results are processed on arrival |
| Schedule at | Run now or at a set time |
| Upload document | The report file, when uploading rather than launching |
Nessus and Tenable expose the largest set — scanner, policy, template, template type, repository, scan zone and folder — because those are the objects their APIs organise scans around. A field left empty that the tool requires is the usual cause of a launch that reports success and never produces data.
What each choice actually decides
Three of these change the result, not just the mechanics, and they are the ones worth deliberating over:
Type — upload or launch. Uploading parses a report the scanner already produced; launching asks the scanner to run now. An upload can be repeated and re-checked without touching the estate. A launch cannot be undone, and on a fragile production host that distinction matters.
Upload Type — how incoming rows meet existing ones. The single most consequential choice on the form:
| Upload type | Effect |
|---|---|
| Merge | Adds new findings, leaves existing ones as they are |
| Closure | Anything absent from this report is treated as fixed and closed |
| Limited Closure | Closes only within the scope this report covers |
| Ignore | Records the upload without changing finding states |
Closure on a partial report closes findings that were never re-tested
A report covering ten of your two hundred hosts, uploaded as Closure, marks findings on the other hundred and ninety as fixed — because they are absent from the file, which is exactly what closure means.
Limited Closure exists for this case: it confines the closing to the hosts actually in the report. When in doubt, that is the safer of the two, and Merge is safer still.
Work flow — how results are processed on arrival. Decides whether findings arrive already approved or require validation first. It is the difference between a scan that immediately moves your published numbers and one that waits for a person.
Policy / Option Profile decides what was checked, and therefore what an absence in the report means. A finding missing because the policy never tested for it is not a finding that was fixed — which is why the policy is worth recording alongside the result.
Schedule at runs the scan later. A scheduled scan that never appears to run is usually scheduled in a different timezone from the person looking for it.
Cancel Scan stops a launched scan that has not completed. It does not remove data already collected.
The upload queue
Reached from the audit, and the first place to look when imported data is questioned.
| Column | What it tells you |
|---|---|
| Report Type | Which kind of report was uploaded |
| Upload Type | Whether this run merged with existing data or replaced it |
| Workflow | The processing path applied |
| Status | Where the job is |
| Initiated By / Initiated At | Who started it and when |
| Queue File | The file itself, for confirming what was actually uploaded |
| Queue Summary | What the job did — rows processed, rows rejected |
Upload Type is the one to check on any "the numbers changed unexpectedly" question. A merge and a replace produce very different totals from the same file, and the difference is invisible once the job has finished.
Row actions: Queue File, Queue Summary, Cancel Scan. A failed job additionally offers a re-check, which re-runs the import without re-uploading the file.
Host selection, and App Code
Defining an audit's scope opens a host list carrying Host IP, Host Name,
Application Name and App Code.
App Code is your organisation's own identifier for the application — from the CMDB, the change process or the finance system — not something NxSAM generates. It appears here because VA scope is agreed per application while the scan runs per host, and the code is what connects the two conversations.
It is also what survives a rename. Asset names drift; the code usually does not, which is why it is the field to quote when reconciling a scope disagreement with an application team.
Queue Summary — why the numbers differ from the file
This is the most useful dialog in the module, and the one most people never open. A report of 900 findings landing as 640 is not data loss; it is the sum of these counters, and the summary is the only place they are shown.
Hosts
| Figure | Means |
|---|---|
| Mapped hosts on report | Hosts in the file that matched an asset in NxSAM |
| Unmapped hosts | Hosts in the file with no matching asset — their findings had nowhere to land |
| Invalid hosts | Rows whose host could not be read at all |
| Ignored hosts | Hosts deliberately excluded from this audit's scope |
| Overridden hosts | Hosts whose existing data this upload replaced |
Findings
| Figure | Means |
|---|---|
| Total instances added | What actually landed |
| Duplicate instances | The same finding on the same host more than once in the file |
| Invalid instances | Rows that could not be parsed into a finding |
| Ignored instances on merge | Existing findings the merge left untouched |
| Severity ignored | Findings filtered out by the severity configuration |
| Vulnerability type ignored | Findings filtered out by type |
Unmapped hosts is the number to act on
An unmapped host means the scanner assessed something NxSAM does not know about. Those findings are not hidden or filtered — they were never created, because there was no asset to attach them to.
A steadily growing unmapped count is an inventory problem surfacing as a scanning problem, and it is invisible everywhere else in the product.
Severity-ignored and type-ignored are configuration, not defects
Both counters reflect filters your organisation set deliberately — commonly dropping informational findings at import to keep volumes manageable. A customer asking why their scanner reports more findings than NxSAM is usually looking at these two lines.
They apply at import. Changing the filter does not retrospectively bring back findings that earlier uploads discarded.
VA Vulnerabilities
One row is a host, not a finding. The count columns are described in Reading the Network Security screens.
Viewing one host's findings
Opened from a host row.
| Column | Notes |
|---|---|
| Vulnerability Details | The finding, its plugin and description |
| Port/Protocol | The same weakness on two ports is two findings |
| Severity/Risk | Both the scanner's severity and the derived risk |
| Status | One of the eleven VA statuses |
| Discovered On | First seen on this host |
| Last Observed Date | Most recent scan that still saw it — the pair is what tells you whether a fix has landed |
| SLA Details | Duration and expiry |
| POC | Proof of concept, where a tester attached one |
Discovered On and Last Observed Date together are the most useful pair on this screen. A finding discovered in March and last observed in March is fixed but not yet re-scanned; one last observed yesterday is still present.
Row actions here are Vulnerability History and View Status History — what changed about the finding, and who changed its status.
Overall Vulnerability Status
Groups by vulnerability instead of by host, which is what makes it worth using.
| Column | Notes |
|---|---|
| Vulnerability | The weakness itself, once |
| Port/Protocol | Where it appears |
| Severity | As derived |
| Status | Aggregate state across the hosts it affects |
| Audit | Which audit reported it |
| Open/Close Date | When it opened, and closed if it has |
A scan returning four thousand findings across two hundred hosts is often sixty distinct vulnerabilities. This screen shows those sixty, and one of them patched everywhere may close a third of the total.
PT Audits
Same shape as VA with a smaller action set: Vulnerability Overview, View Vulnerabilities, Manage Audit Scope, Assign Auditors, Edit Tags, View Status History, Delete Audit, plus Download Audit Status Report, which takes a start and end date and produces a status summary for that window.
PT Vulnerabilities — three views of one audit
By asset
| Column | Notes |
|---|---|
| Asset ID / Asset | The host tested |
| Accessibility | External or Internal — the only two values |
| Port | Where the tester worked |
| No. of Vulnerabilities | Found on this asset |
| Info Gathered | Reconnaissance recorded against the asset, separate from findings |
Accessibility drives prioritisation more than severity does. A Medium on an external host is usually more urgent than a High on an internal one, and this is the column that says which is which.
Info Gathered is what the tester learned that is not itself a weakness — versions, banners, enumerated accounts. It is uploaded separately, has its own type and document, and is worth reading before disputing a finding: it is often the evidence that the finding was reachable.
Grouped
Title and No. of Vulnerabilities — findings collapsed by name, for seeing that one issue affects nine hosts.
Flat
| Column | Notes |
|---|---|
| Vulnerability | The finding |
| Host / Port | Where |
| Risk | The tester's rating |
| Validation | Saved, Submitted or Approved — three values only |
| Status | One of the eleven PT statuses |
| Artifacts | Screenshots and files the tester attached as proof |
Row actions: Edit Vulnerability, Delete Vulnerability, Vulnerability History.
Artifacts are the difference between a PT finding and a scanner finding. A scanner finding is reproducible by re-running the scanner; a manual one often is not. If a PT finding is disputed and has no artifacts, there is nothing to review.
Segmentation
Tests whether network separation holds.
By source — Host Name, Host, Info.
By destination — Hosts ID, Destination Host, Source Host (Host Name), Port,
Info.
A finding is a path: this source reached this destination on this port. Info carries
what was observed. The question is not how severe it is but whether the path was supposed
to exist, which is why the tables pair source and destination rather than ranking by
severity.
The segmentation audit list itself carries Audit Details, Business Unit, Status, Auditor, Source Hosts and Requested By. Business Unit matters more here than elsewhere: segmentation is usually tested because two business units are meant to be separated from each other, so the column names the boundary being verified.
The Nmap report view
Where a scan was run with Nmap, its raw output is viewable per host:
| Column | What it holds |
|---|---|
| Port / Protocol | The port and whether TCP or UDP |
| State | open, closed or filtered |
| Reason | Why Nmap concluded that — which packet it saw back |
| Service | What Nmap believes is listening |
| Product / Version | The software and version it fingerprinted |
| Extra Info | Anything further the fingerprint returned, such as an OS hint or a module list |
Version and Extra Info are the two worth reading. A finding that says "outdated service" is confirmed or refuted by what the fingerprint actually reported, and a disagreement between the two usually means the service was patched without a restart — the running binary is still the old one.
The dashboard
Its two row actions are Download PDF and Download PNG, per widget — the charts are exportable individually for putting into a report or a deck without recreating them.
Working a VA result
Network VA produces the highest finding volumes in the platform, and the screens are structured around reducing that volume to something actionable. Knowing which view answers which question saves most of the time spent in this module.
Three views of the same data
| View | Groups by | Answers |
|---|---|---|
| Vulnerabilities | Host | Which machines are worst? |
| Overall vulnerability status | Vulnerability | Which single fix helps most? |
| View vulnerability | One finding | What exactly is this, and where? |
The second is the one people miss, and it is usually the most useful. A scan reporting 4,000 findings across 200 hosts is often 60 distinct vulnerabilities — and one of them patched everywhere might close a third of the total.
Working host by host through a large VA result is the slowest available approach.
The queue view
Network VA imports are large, so they are processed in batches. The queue shows those batches and their state.
Its practical use is answering "is the scan still loading?" A partly loaded scan looks exactly like a complete scan with fewer findings — there is no marker on the module screen distinguishing the two. Before investigating why a host has fewer findings than expected, confirm the import finished.
Reading a single finding
The detail view carries the evidence: the plugin or check that fired, the affected port and protocol, the scanner's output, and remediation guidance.
Two things worth checking before assigning it:
- Port and protocol. The same vulnerability on two ports is two findings against one host, and they may have different fixes.
- Whether an exploit is known. Exploit availability, not severity alone, is what distinguishes urgent from important. A Medium with a public exploit on an internet-facing host outranks a High that requires local access.
Why a host's count changed without a new scan
Three causes, in order of likelihood:
- SLA states moved. Nothing about the finding changed; a date passed. Overdue counts in particular change daily with no scan activity at all.
- A severity mapping was edited. Severity is derived from the score, so changing the boundaries re-classifies existing findings in bulk.
- The asset's grouping changed. Move a host between groups and it leaves one report's scope and enters another's — both are then correct and different.
Why a closed finding is open again
The host was scanned again and the vulnerability was still there. NxSAM re-opens the existing finding rather than creating a new one, so its history is preserved.
The common misreading is treating this as the platform failing to record the fix. It recorded it; the next scan disagreed. Either the fix did not take, it was reverted, or — frequently on VA — it was applied to one host in a group and not the rest.
Check whether the re-opened findings are on the same hosts as before or on different ones. Different hosts means the fix worked and the rollout was incomplete, which is a distribution problem rather than a remediation one.
Network Security: find the right screen
Every screen in this module, what each one is for, and where it lives. Use it to find the right screen quickly, and to confirm you are on the one a colleague means — several screens in this product have similar names and different jobs.
Screenshots come from a demonstration data set, so the figures are illustrative. Click any screenshot to open it at full resolution.
Network Security Dashboard
VA and PT posture together — severity mix, ageing, top hosts and the risk score trend.
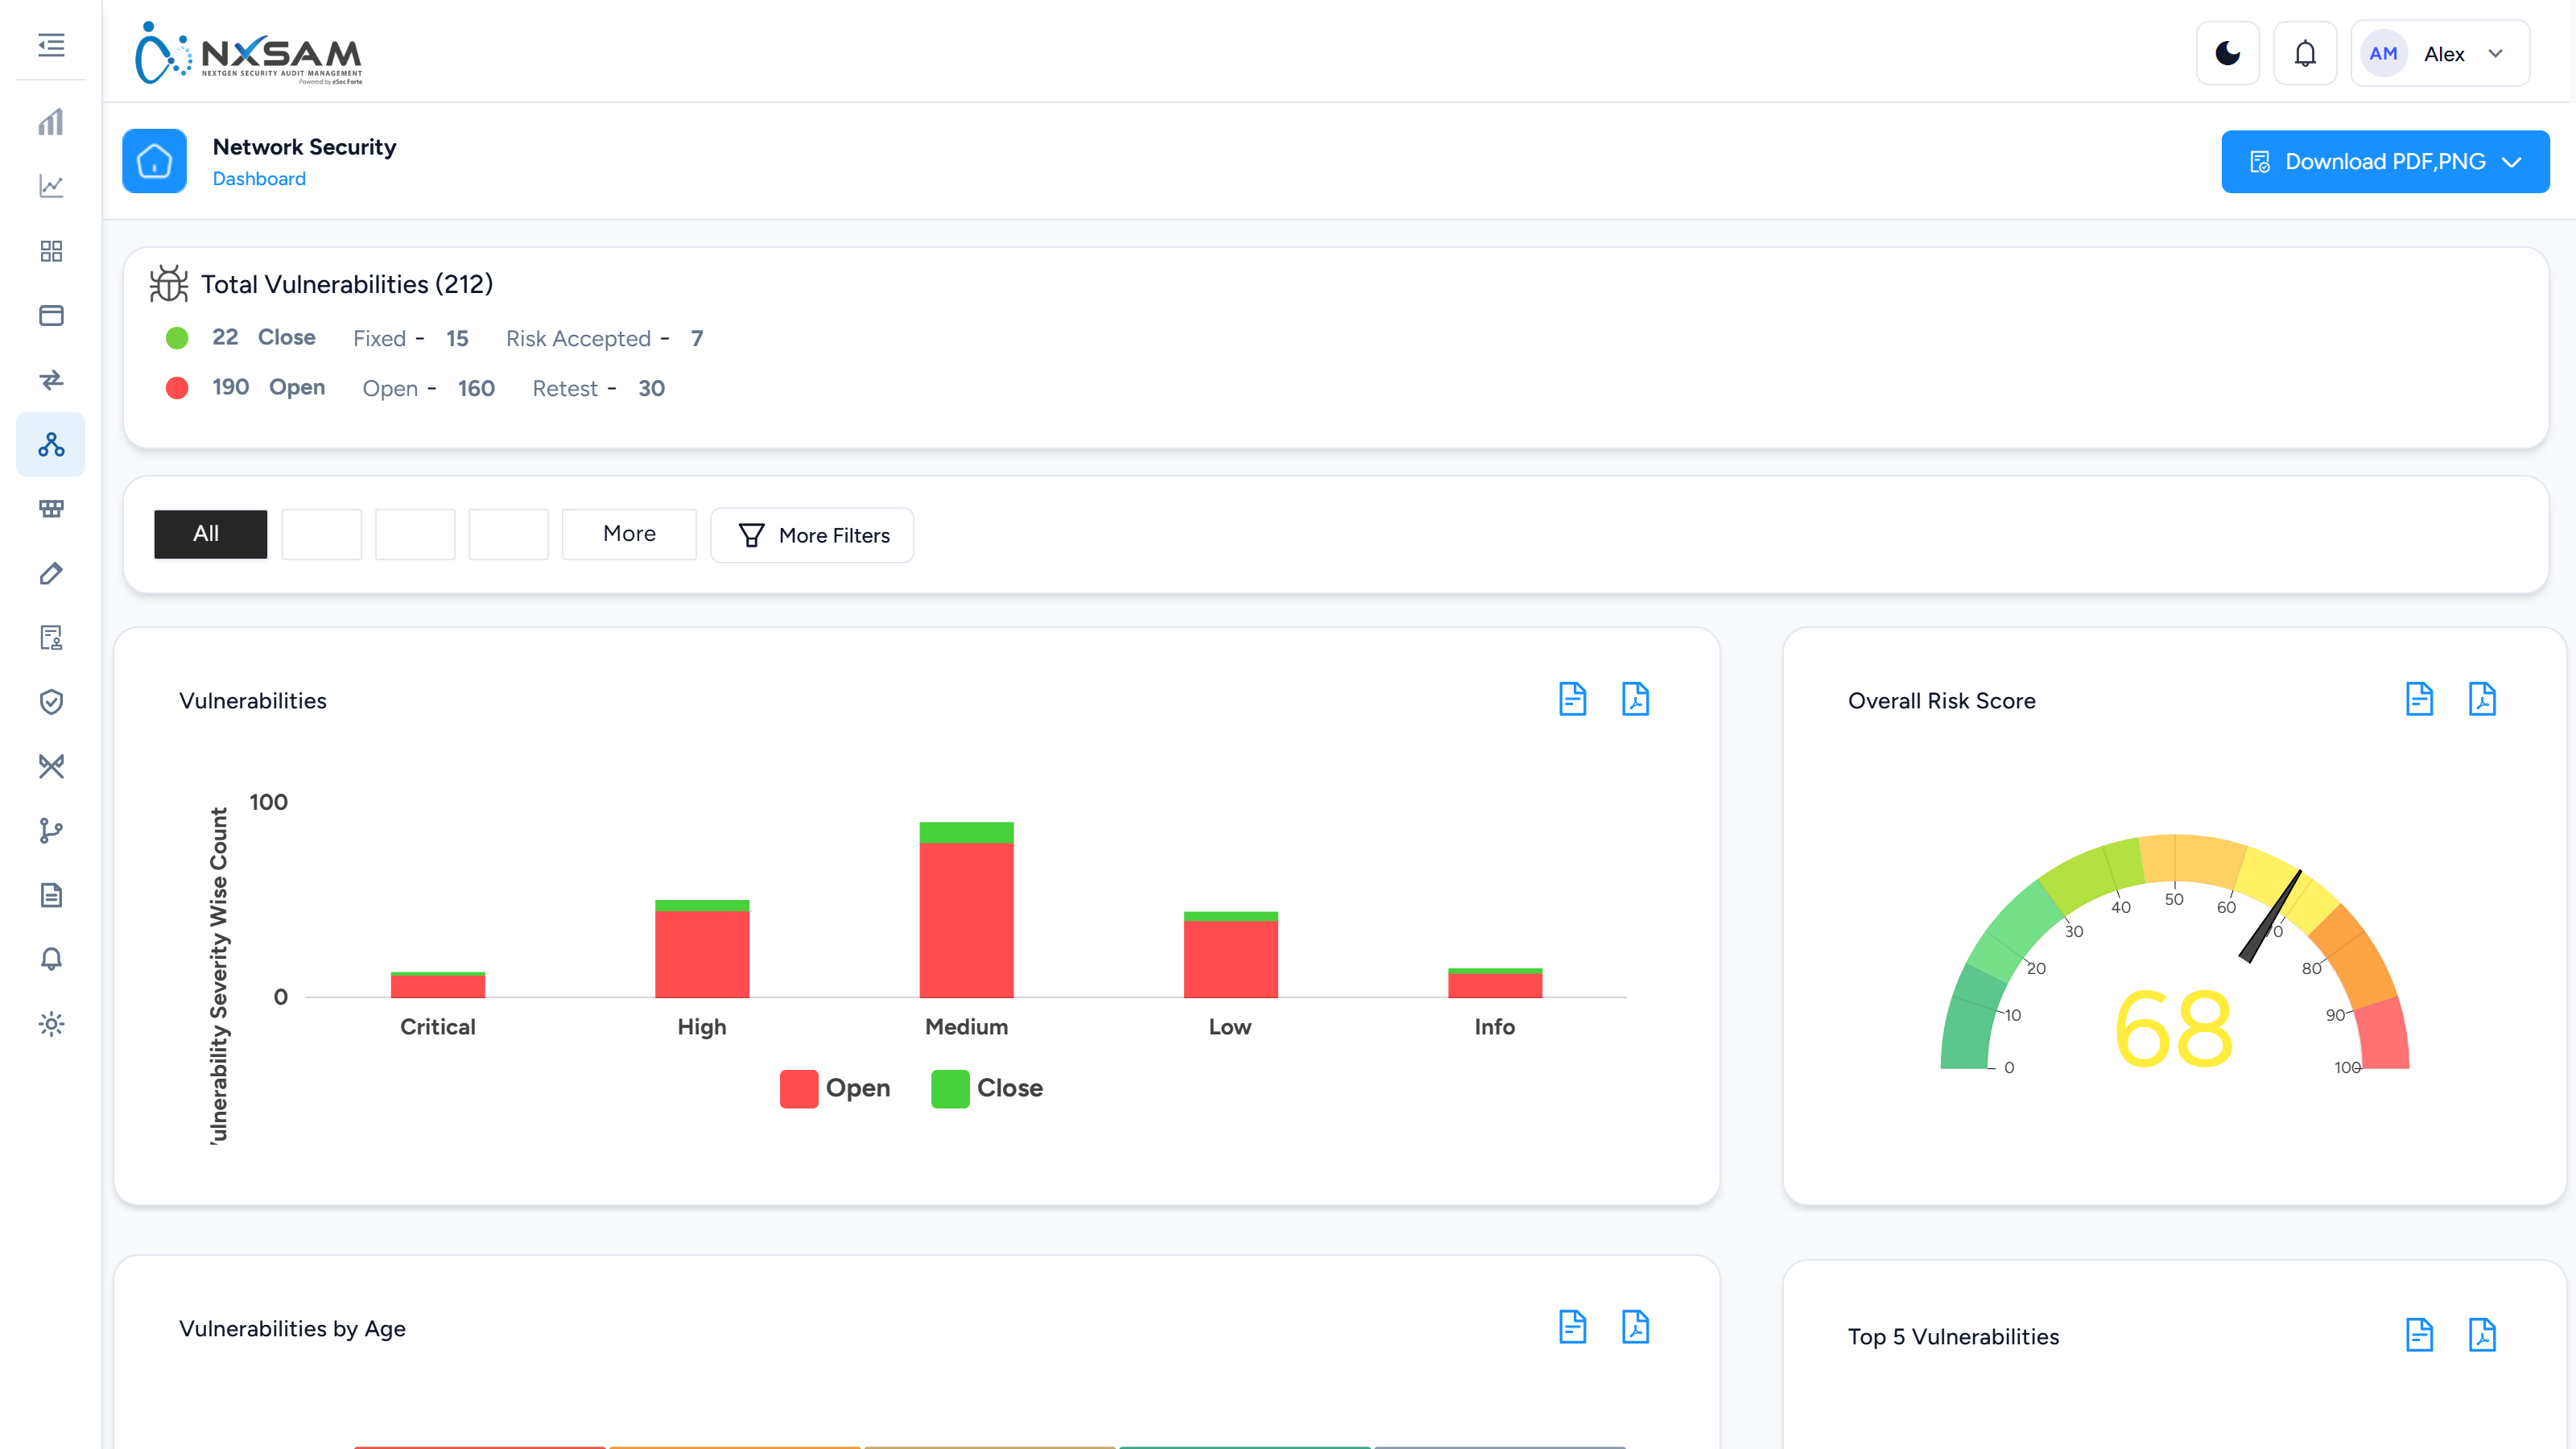
Overall Vulnerability Status
One host's whole history — everything ever found on it, across every audit that covered it, with what is still open.
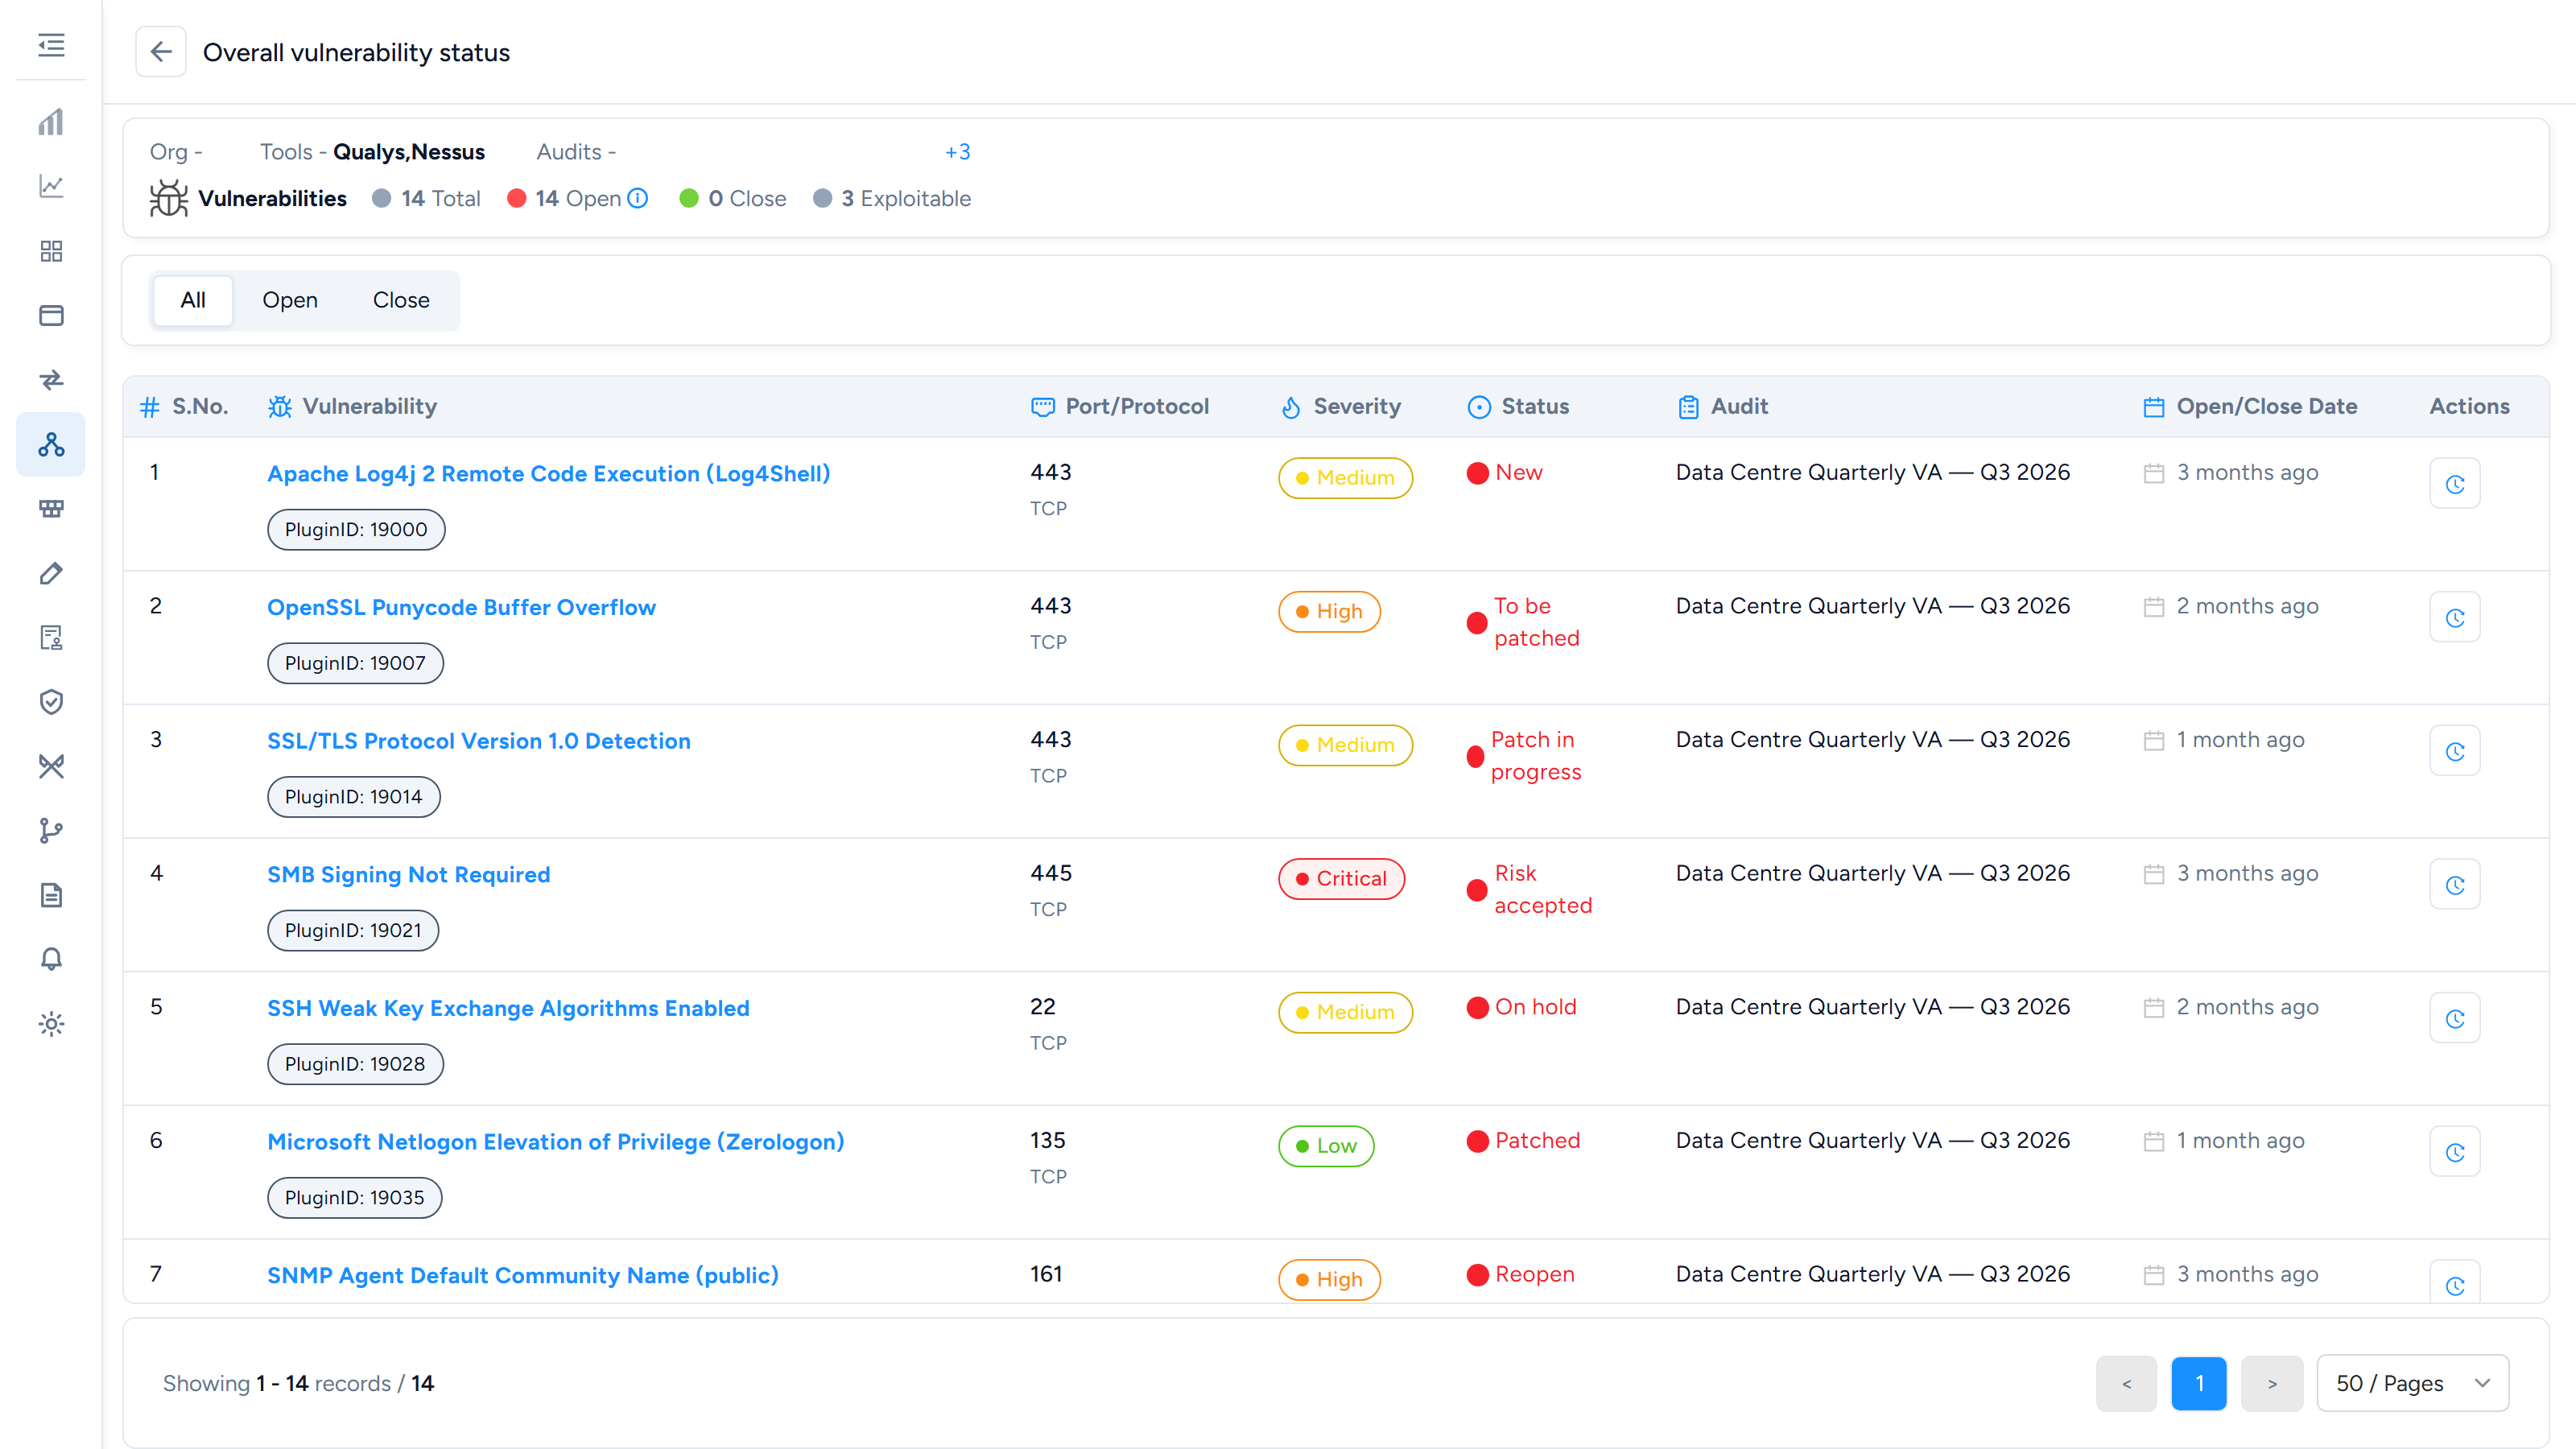
PT Findings
Findings written by a penetration tester, each with its own validation and current status. The status menu opens only once validation reaches Approved.
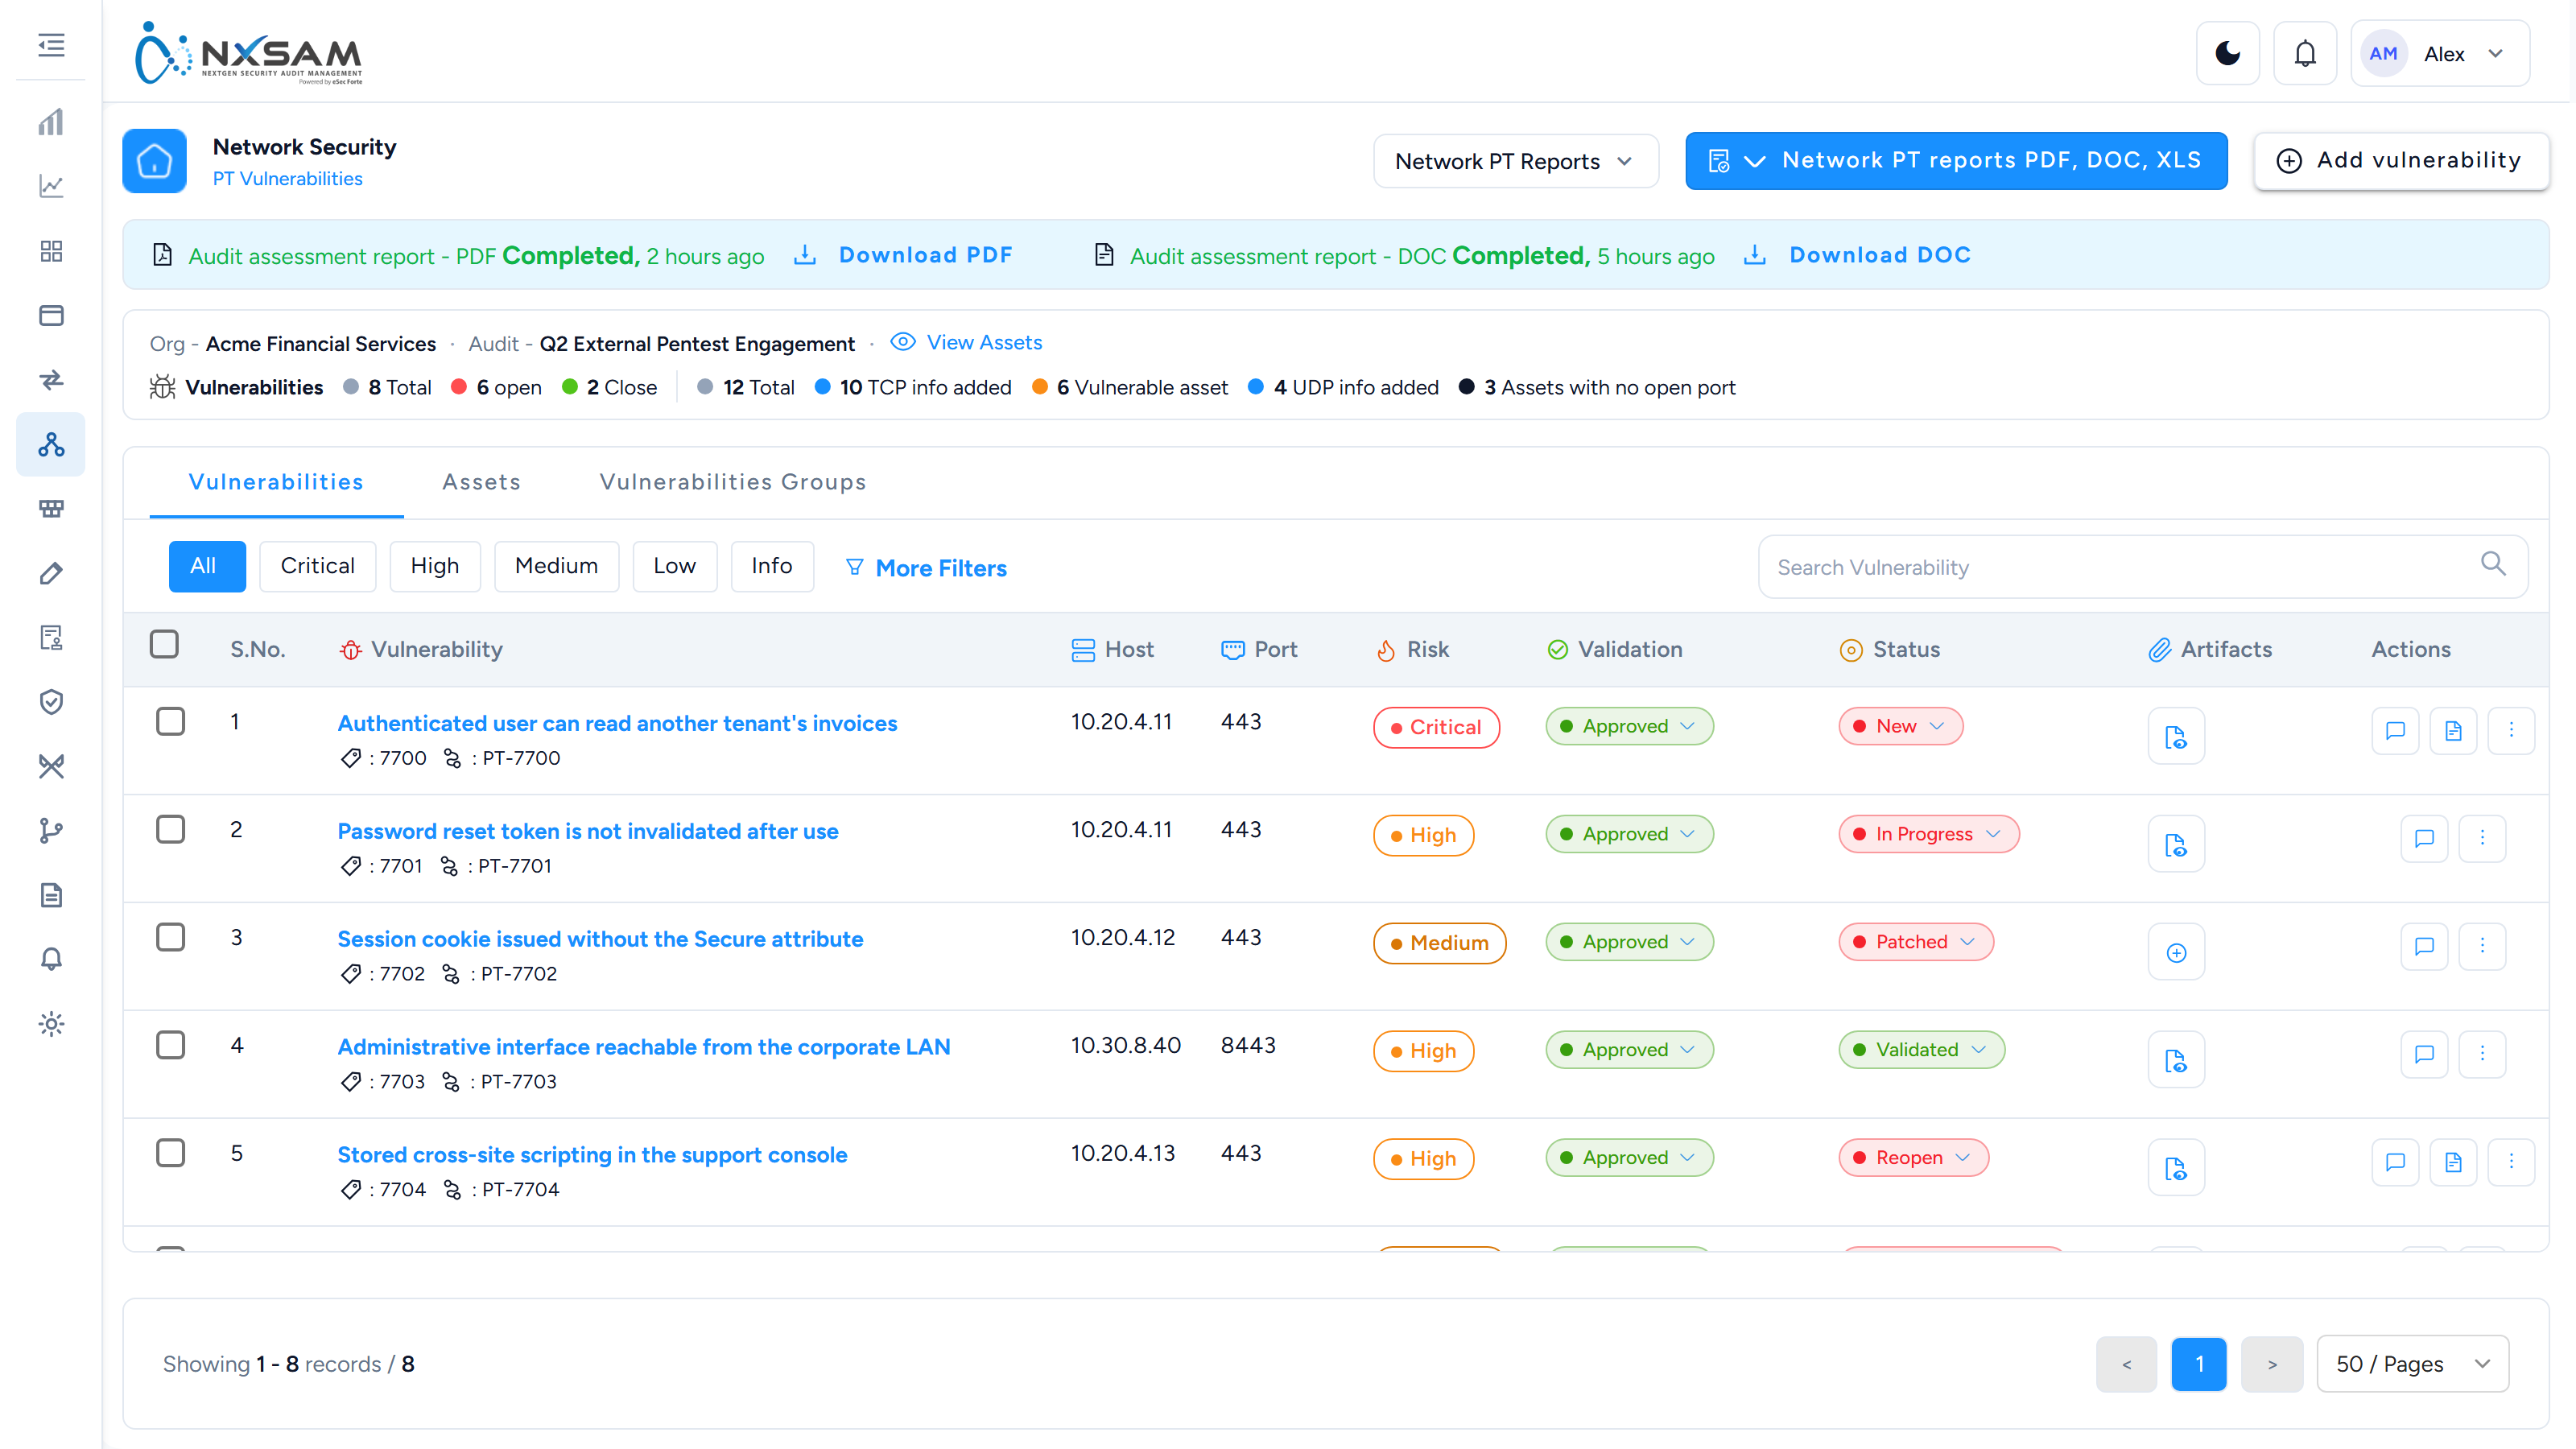
Penetration Test Audits
Manual penetration tests, tracked as audits with their own findings and evidence.
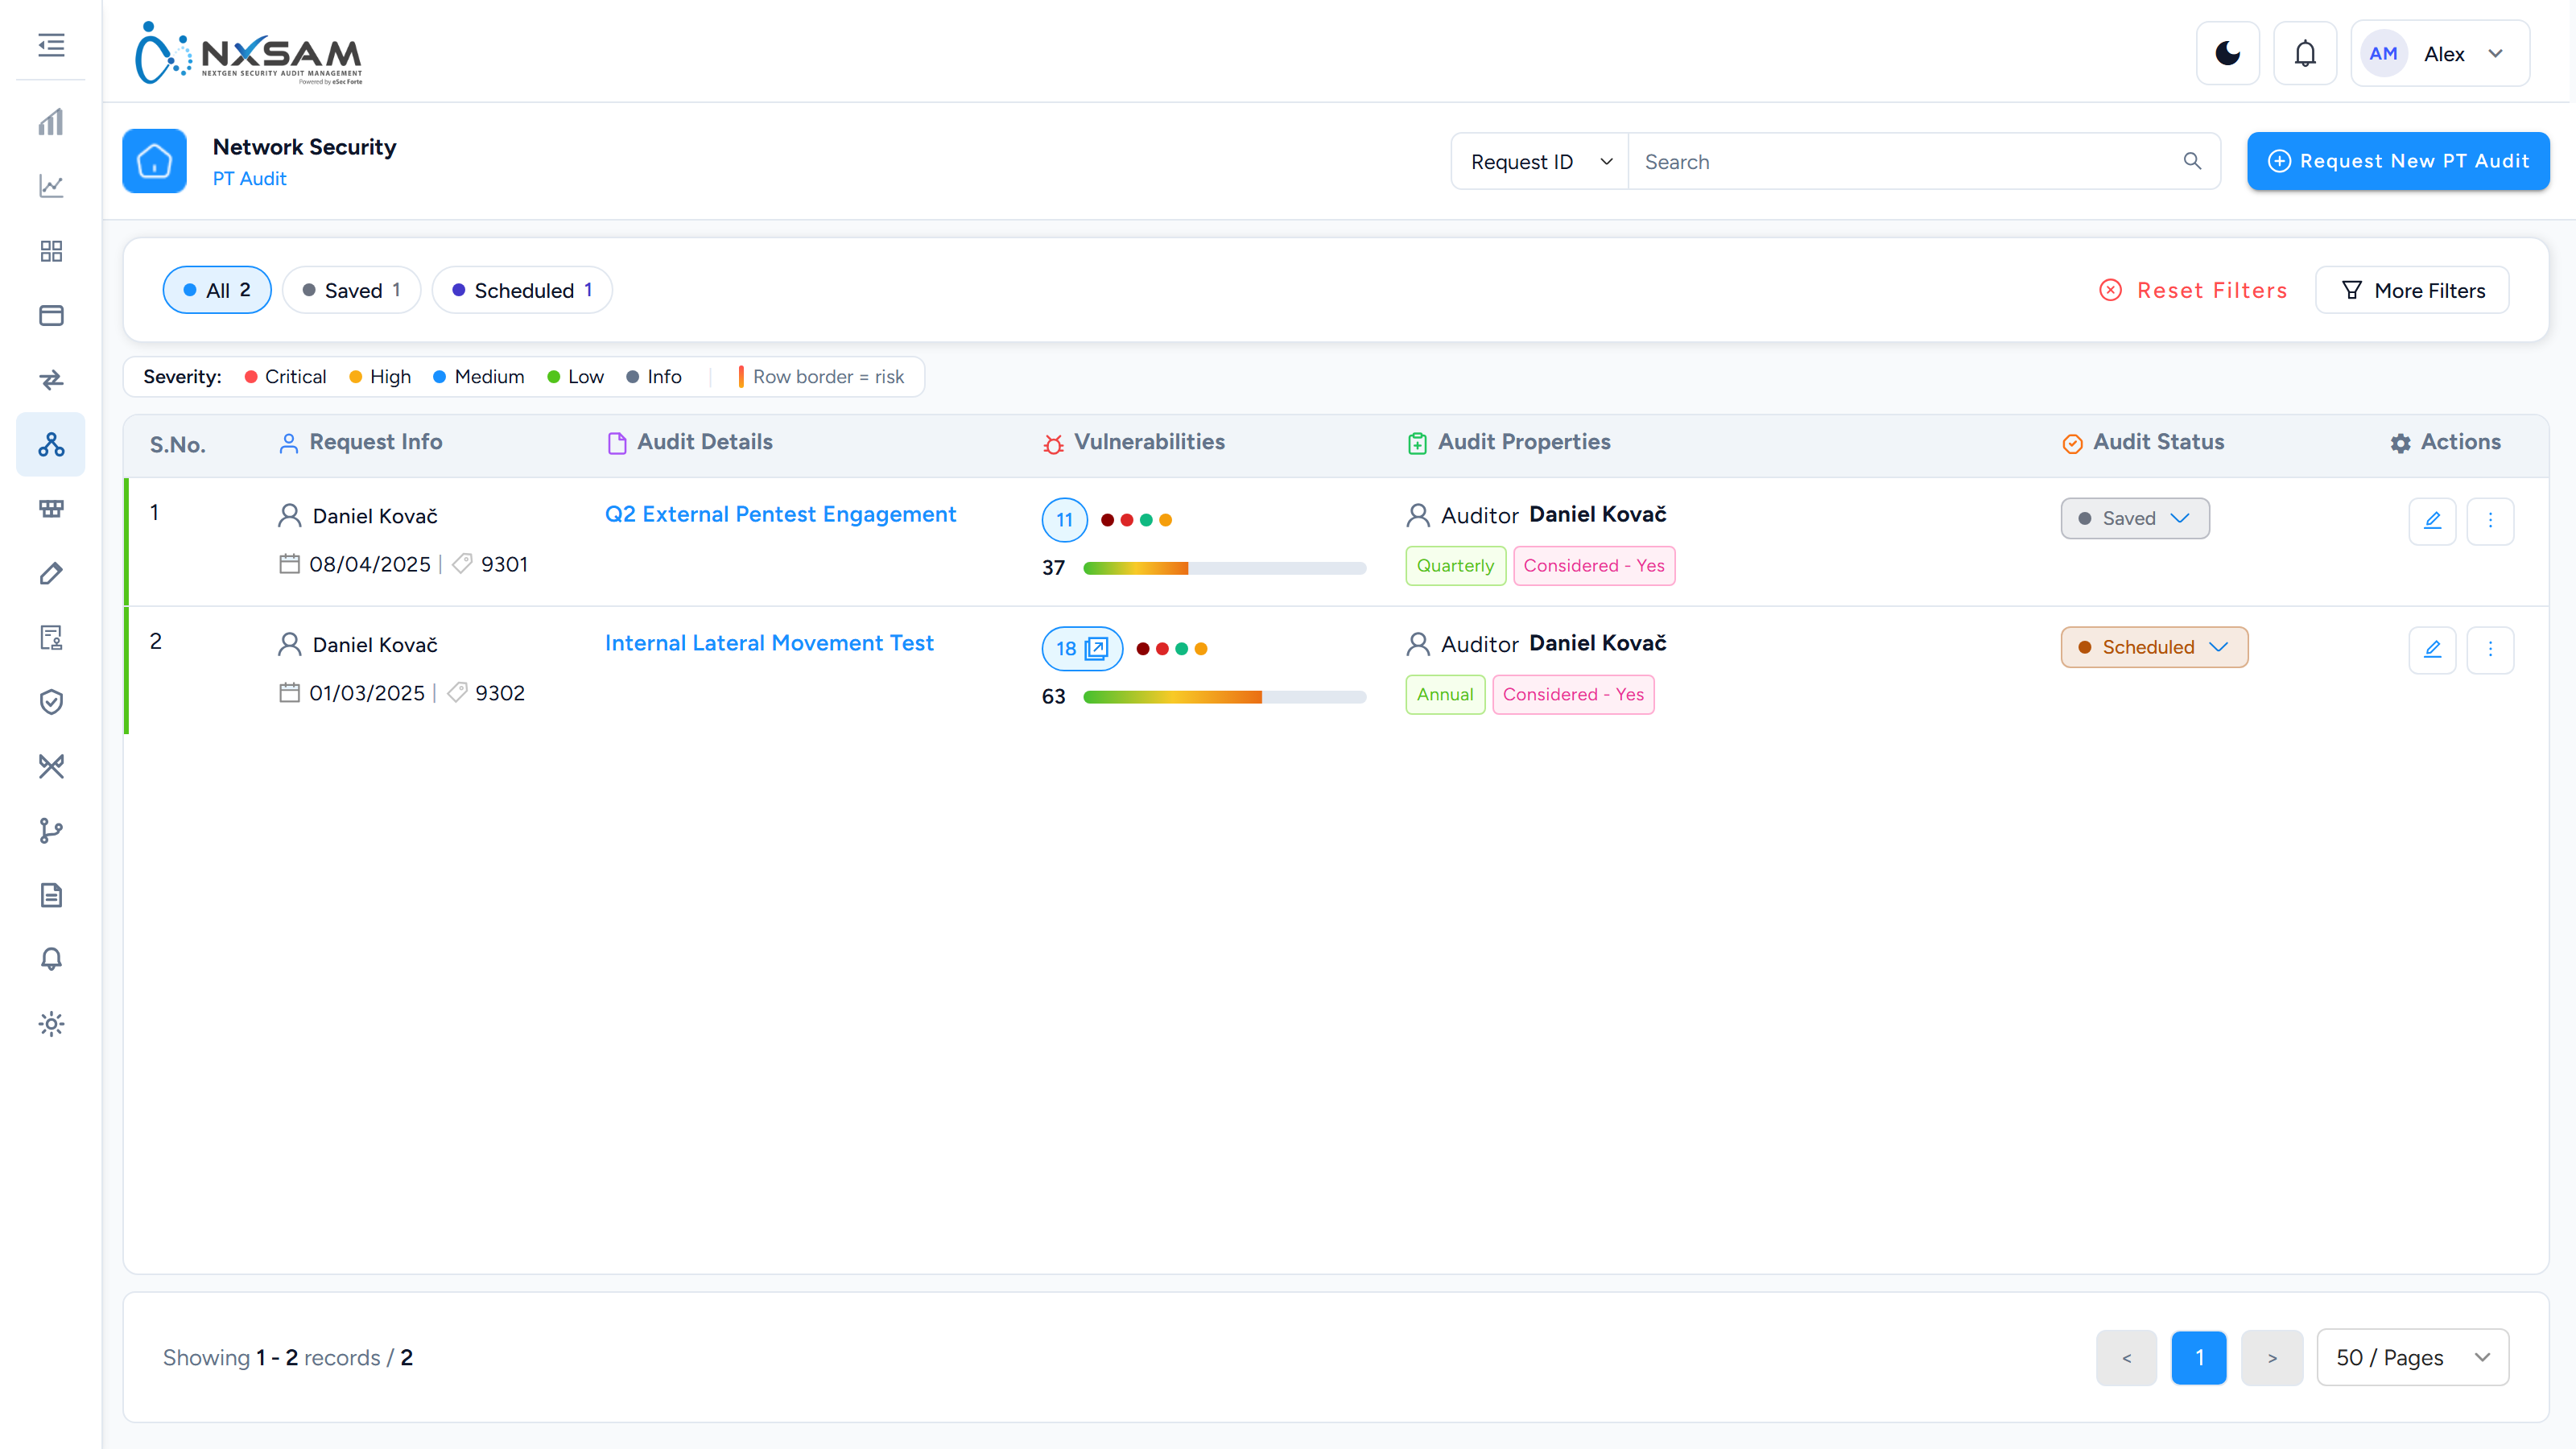
Segmentation Audits
Tests that network segregation holds — which source can reach which destination on which port.
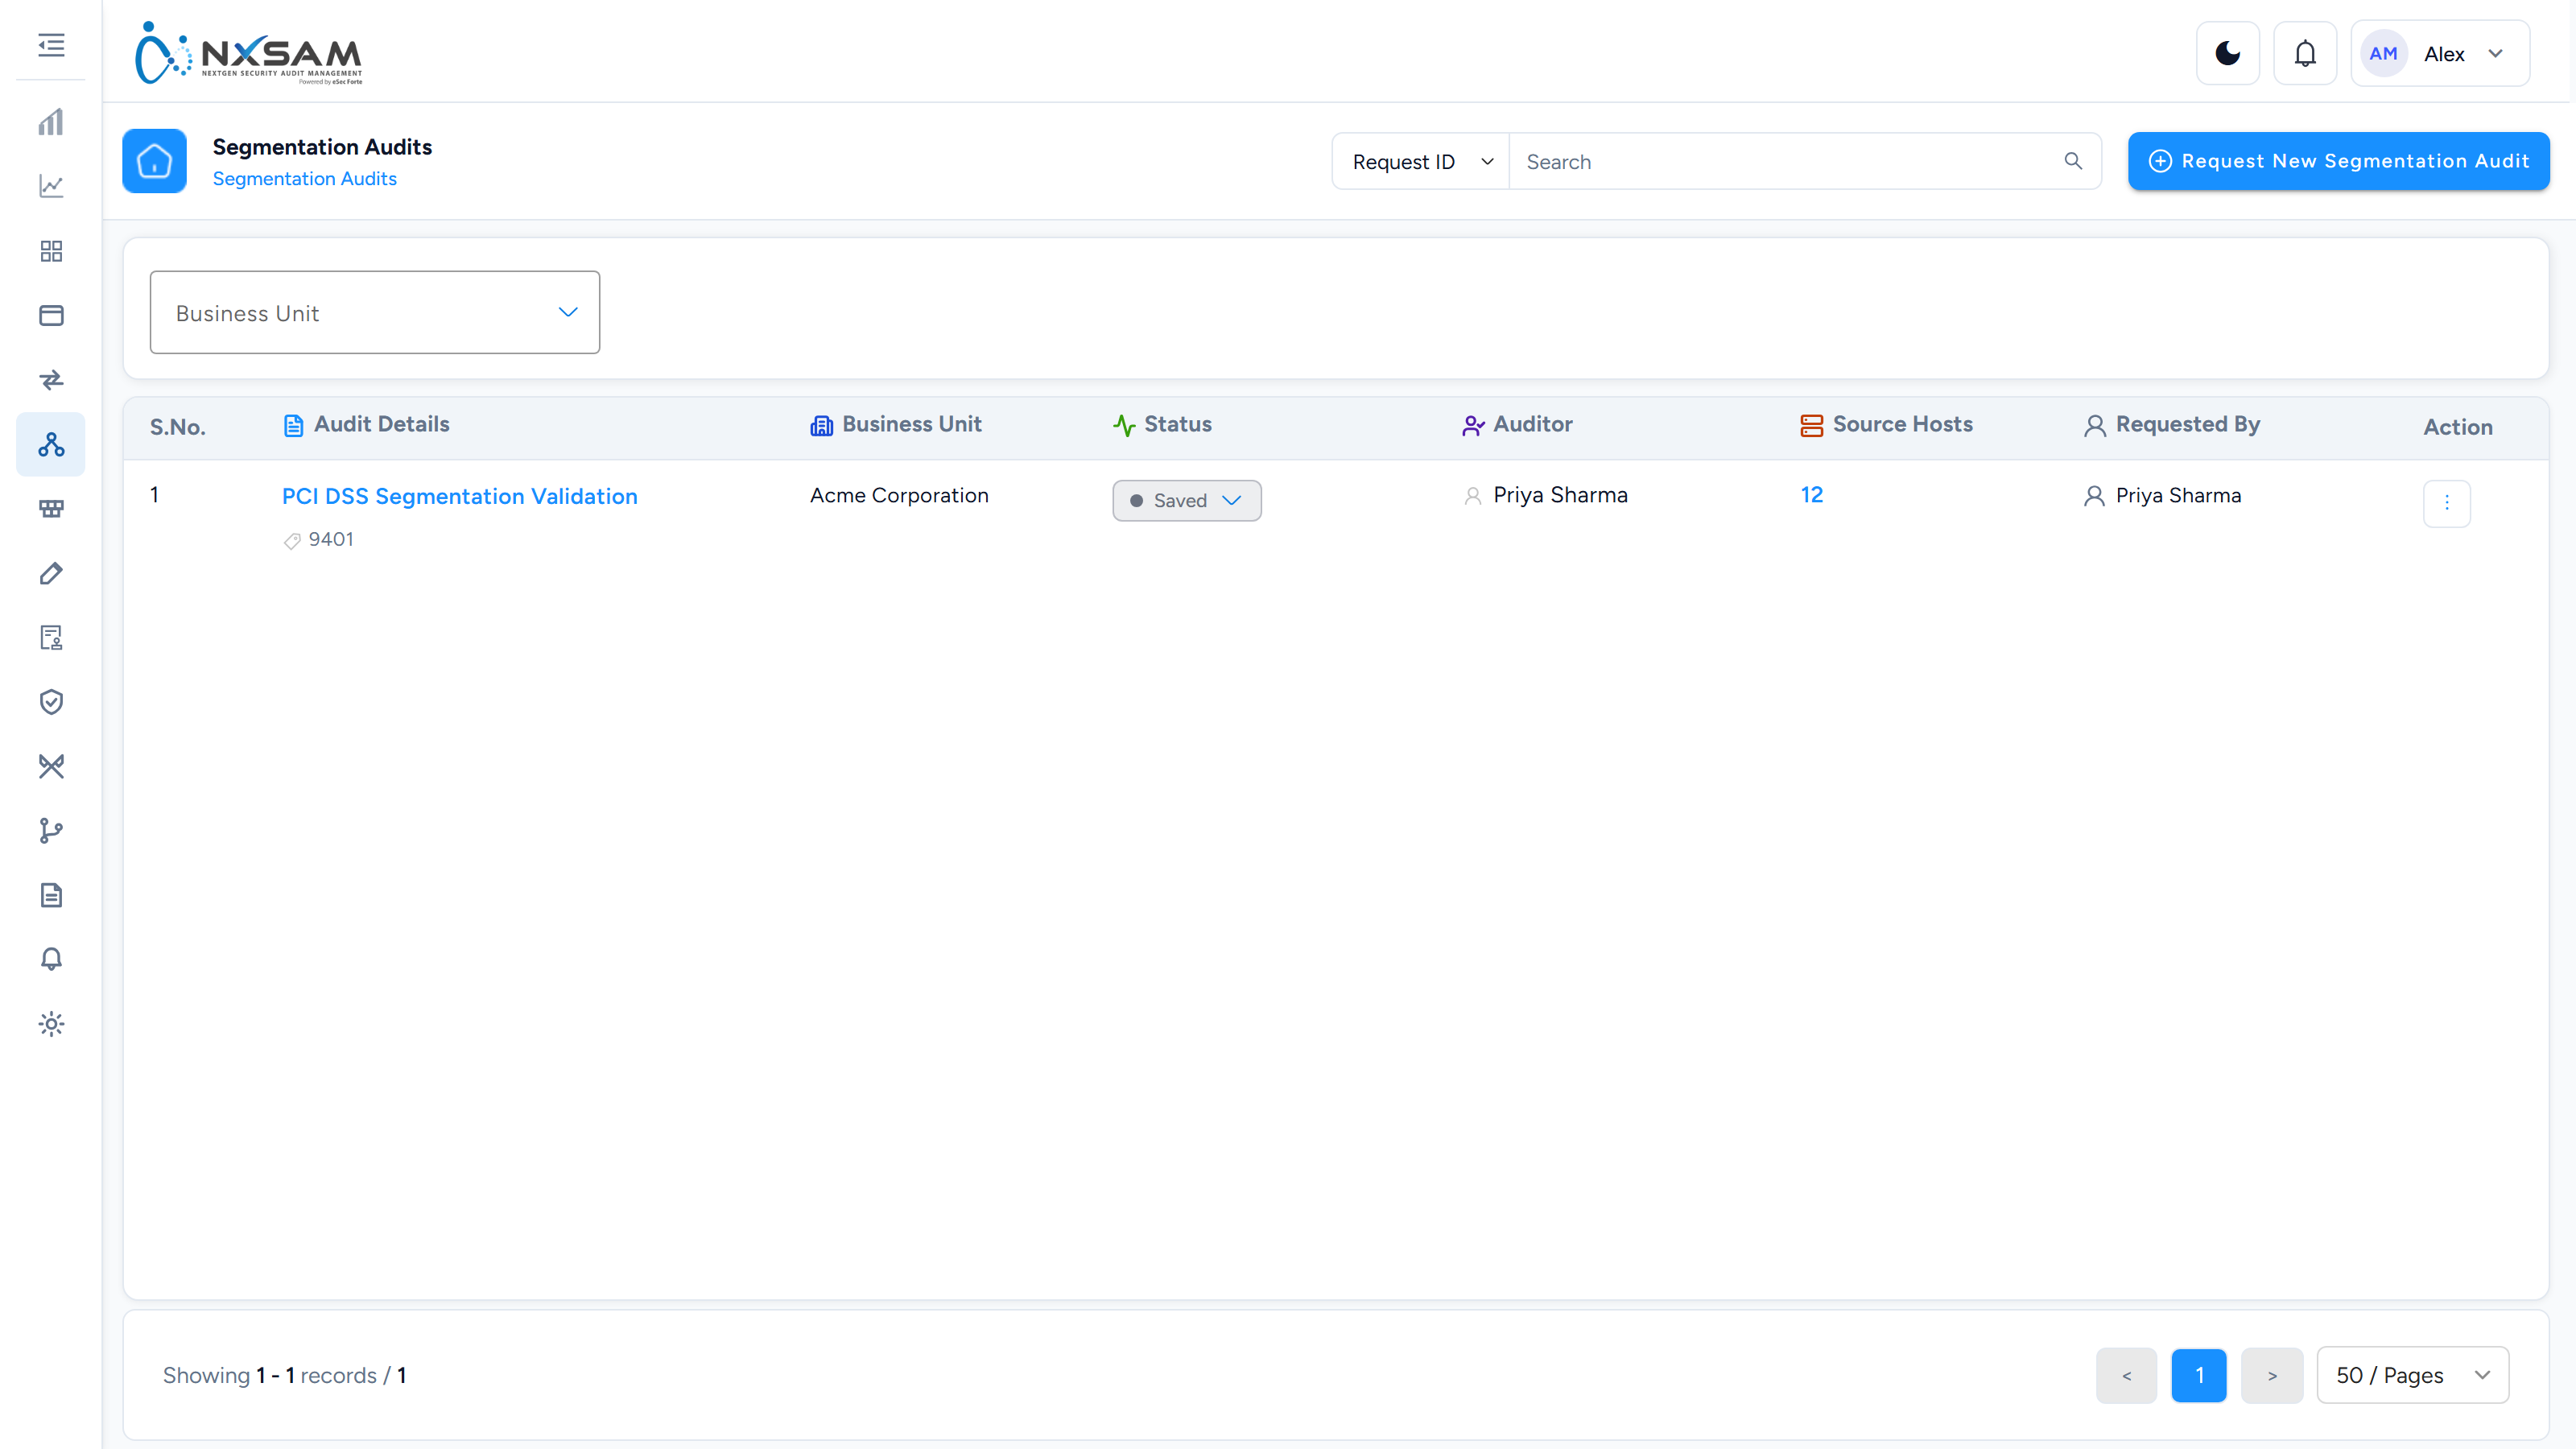
Segmentation Findings
Which source host reached which destination, and on which ports. A row where a service answered across a boundary is a segmentation failure.
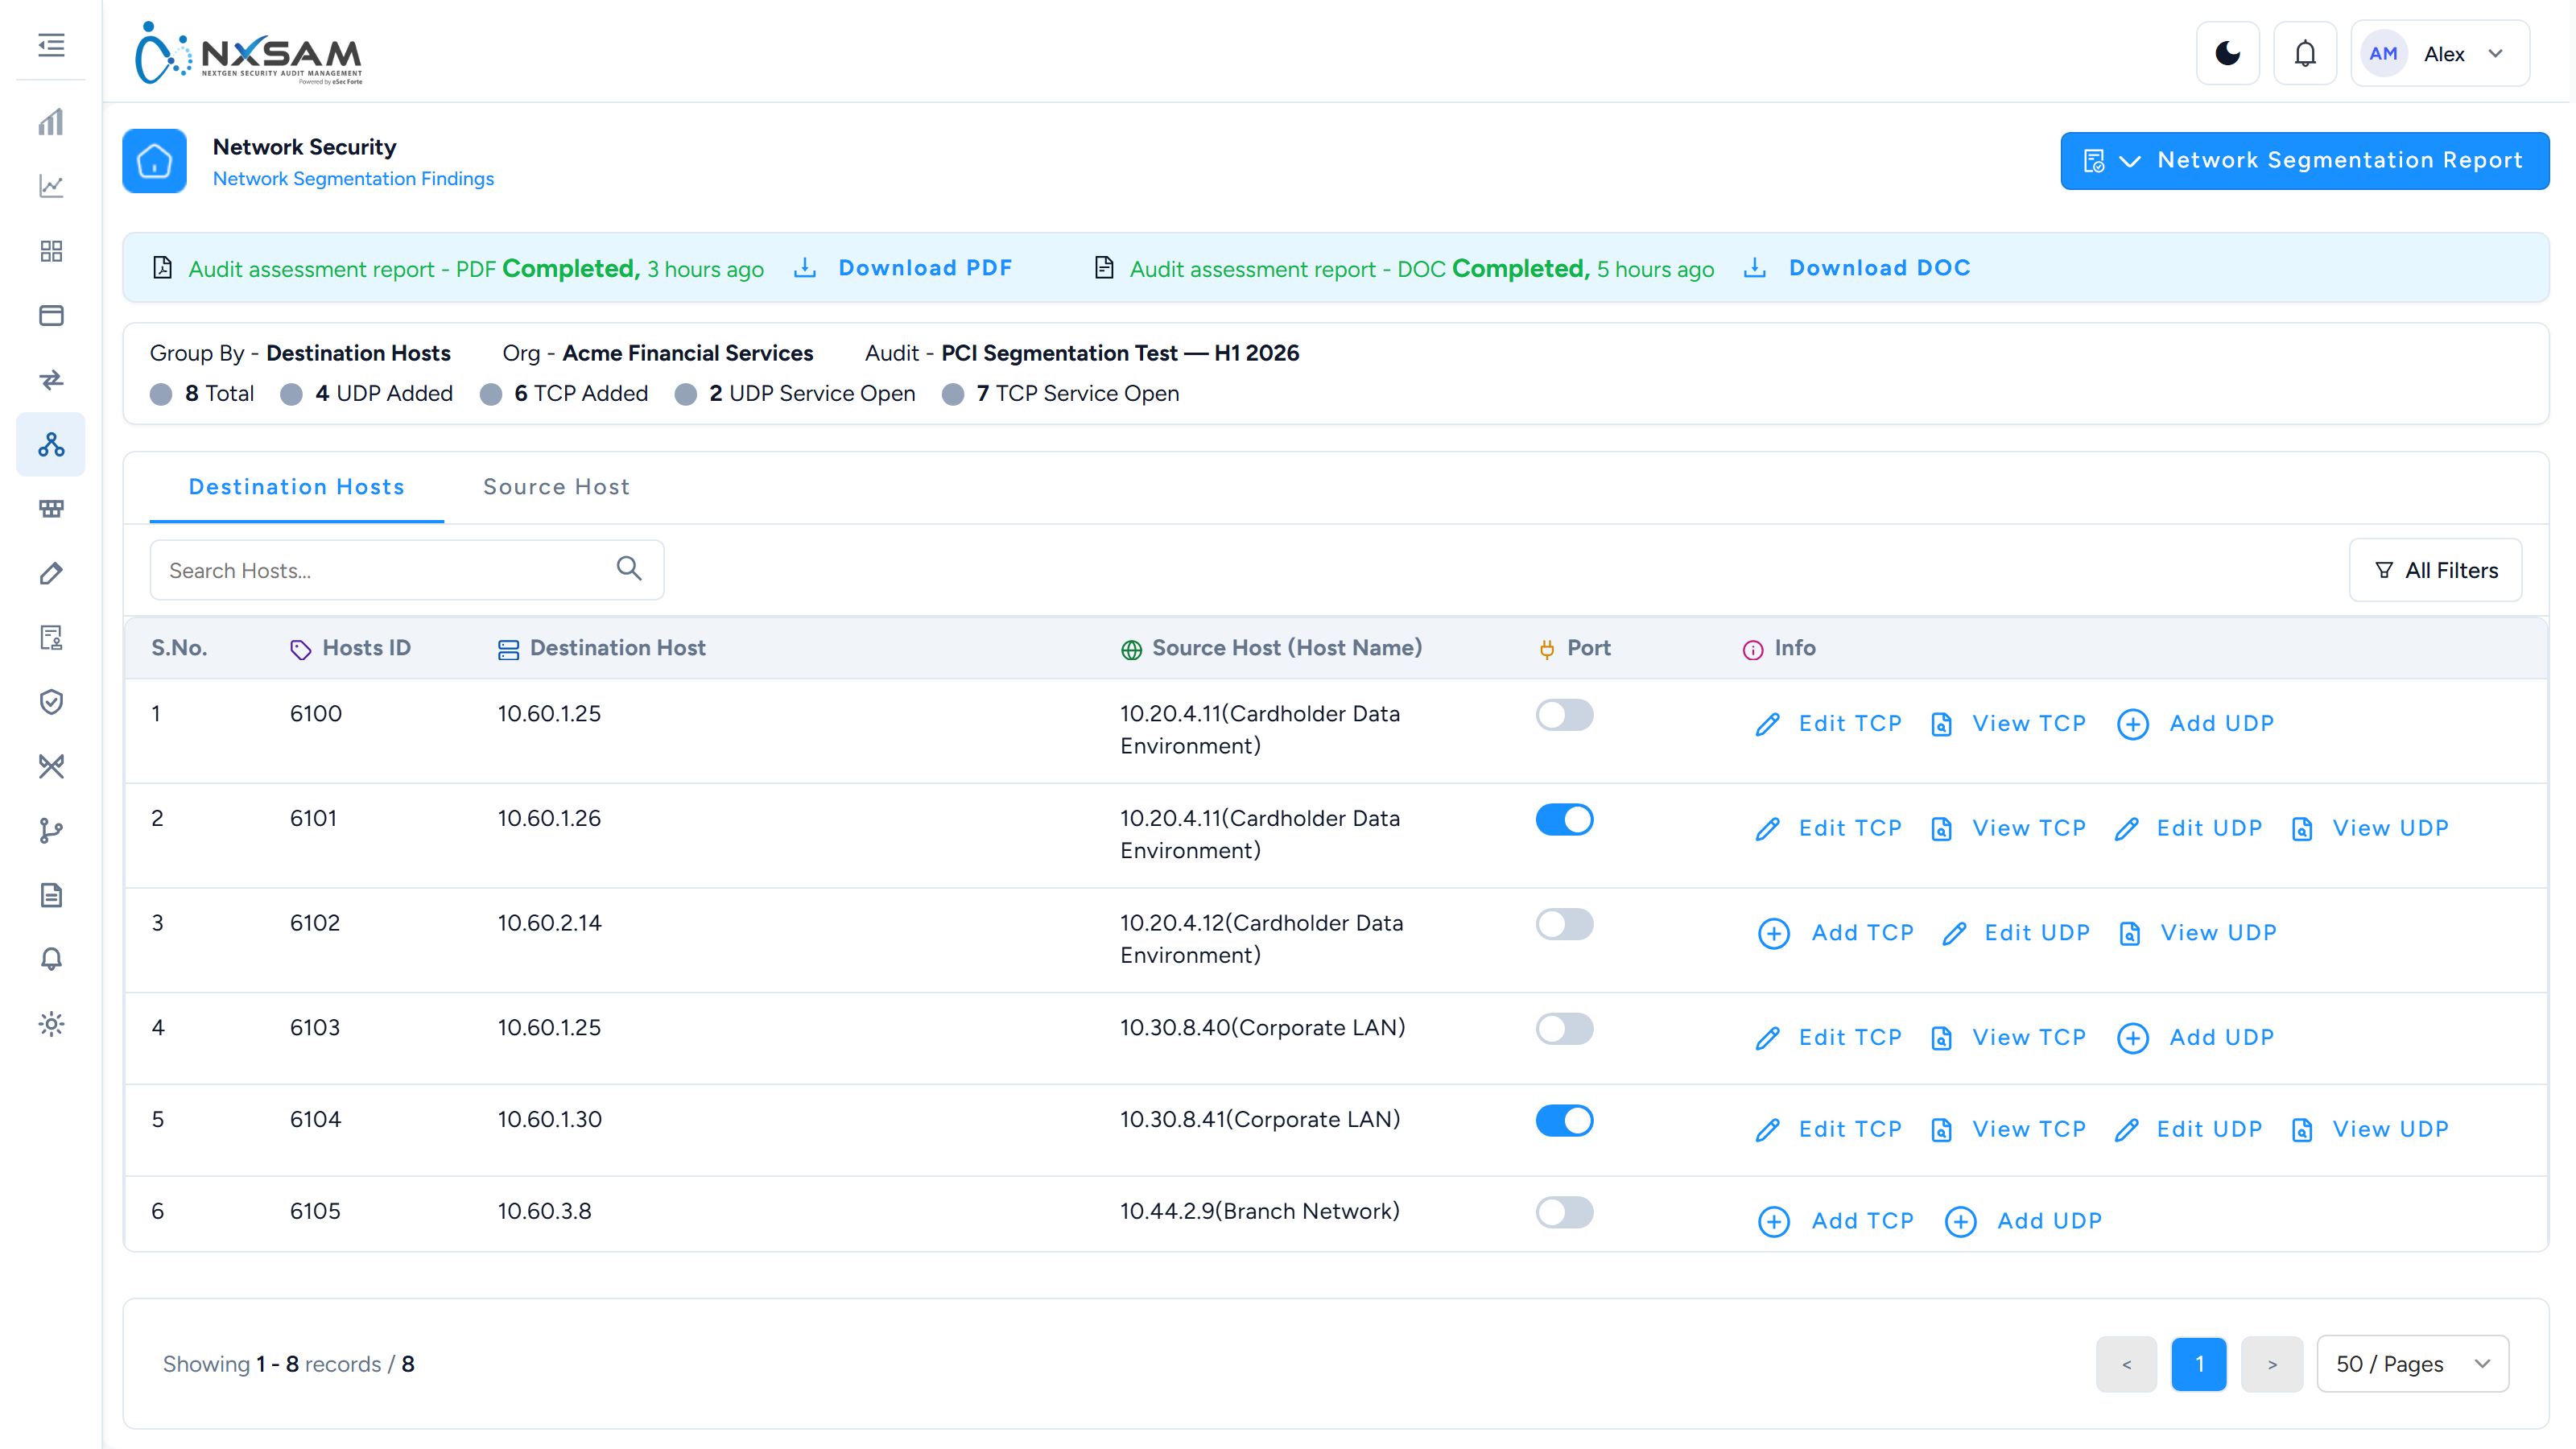
VA Import Queue
Batches of a VA import and their state. A partly loaded scan looks like a complete smaller scan on the module screen.
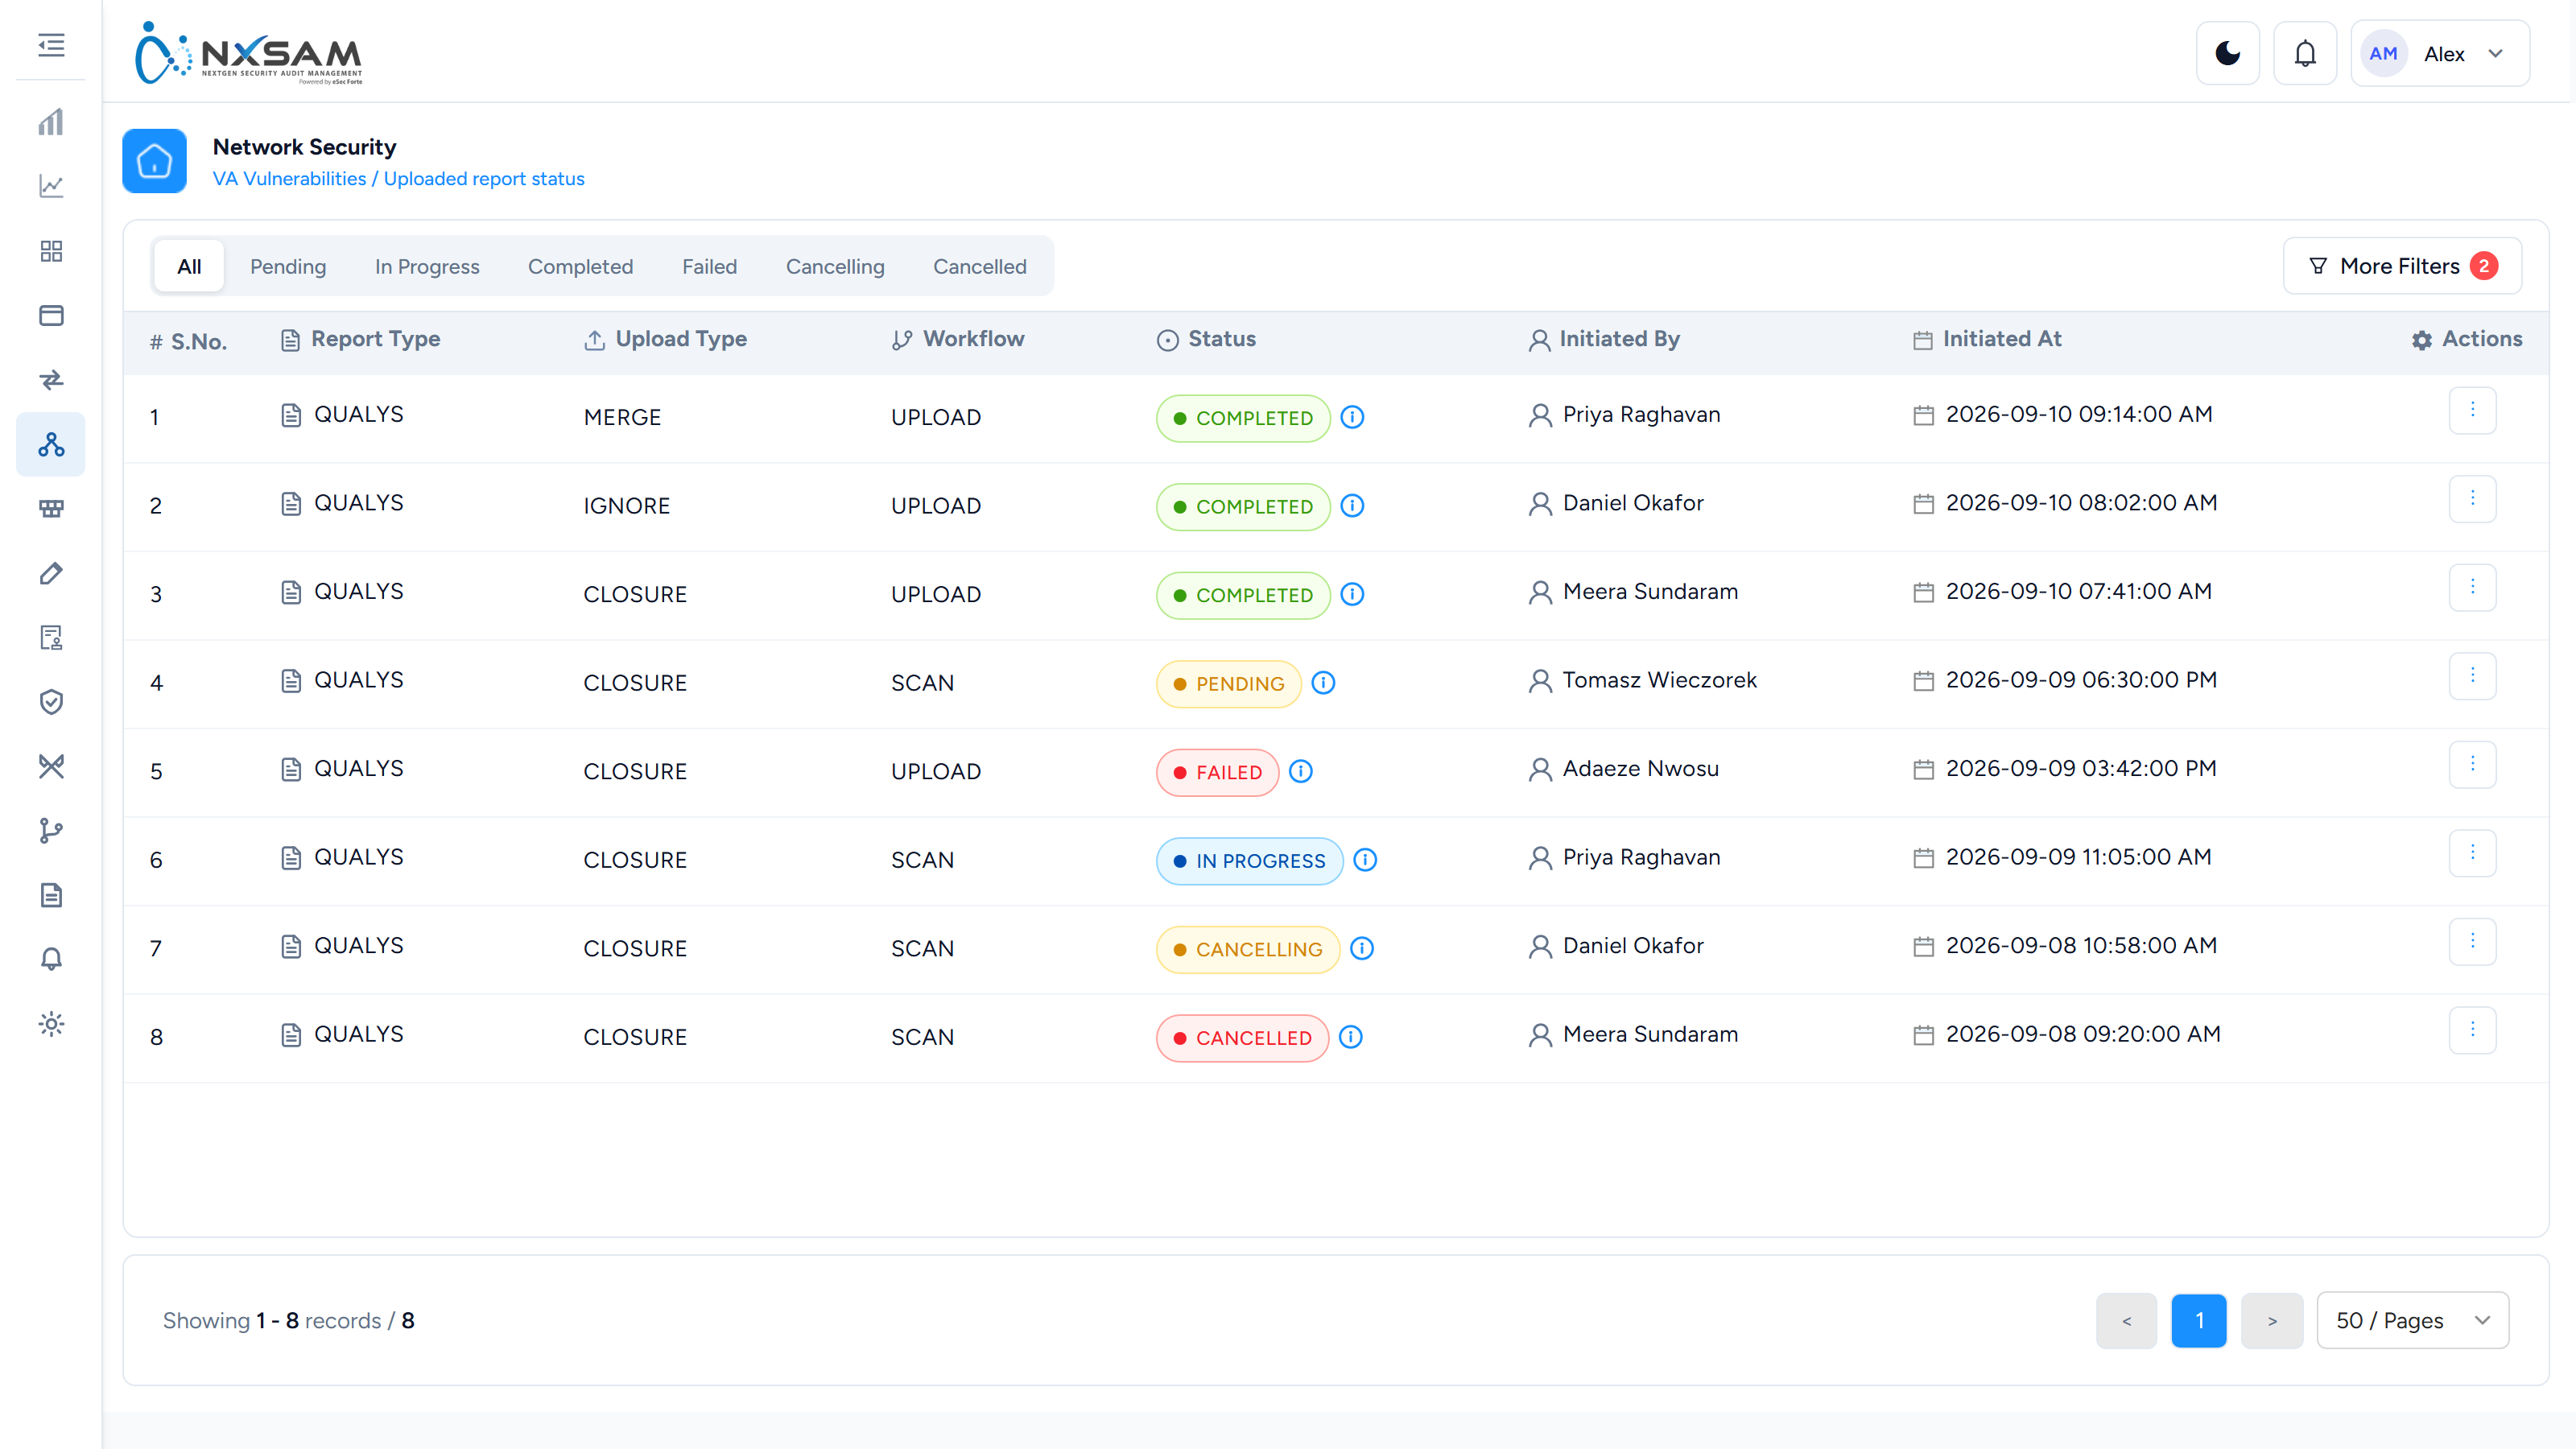
Vulnerability Detail
One finding in full — the check that fired, affected port and protocol, scanner output and remediation guidance.
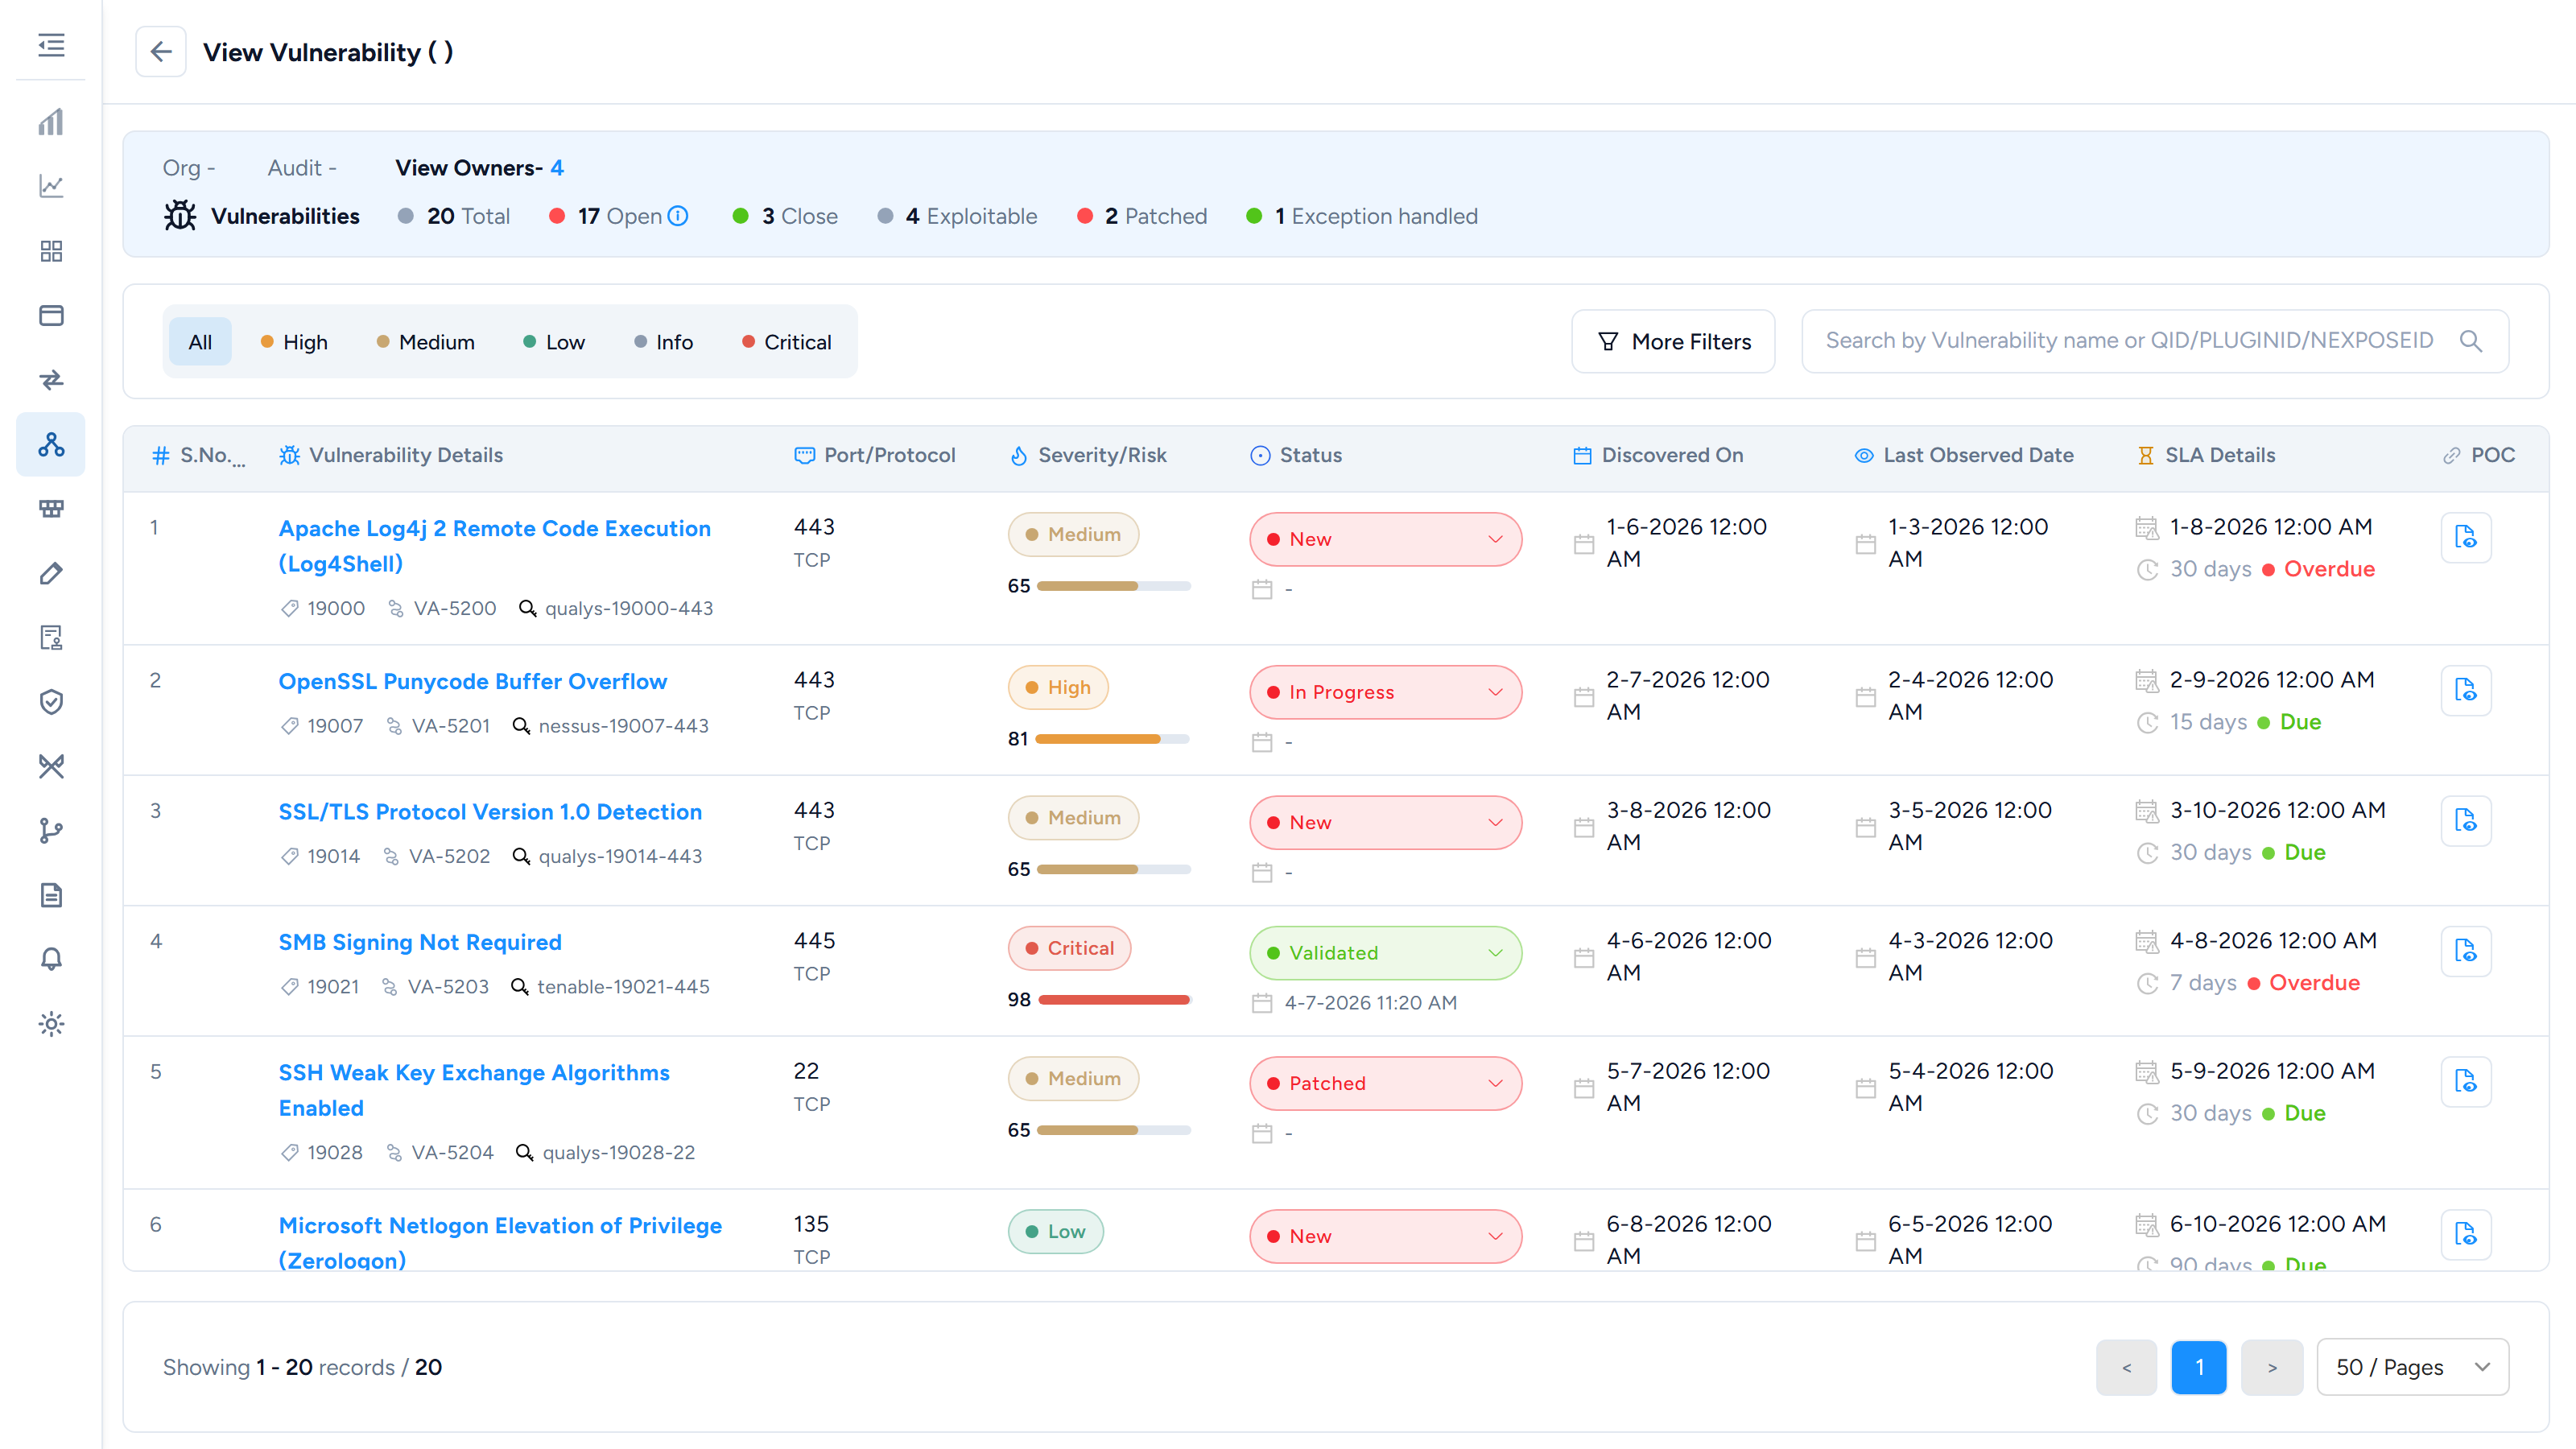
Network Security: support reference
Internal. The customer-facing explanation of these screens is in Reading the Network Security screens and the screen reference. This page is what you need in addition to those when handling a ticket.
Network VA carries the highest finding volumes in the platform, so almost everything here is a consequence of scale: queued processing, pre-computed counts, and identity decided at import.
Controls that depend on permission, not on state
A caller reporting "the button isn't there" is usually describing a permission, and the product does not say so — a control the role cannot use is absent rather than disabled.
| Control | Needs |
|---|---|
| Approve / reject a finding | The approval permission for the module |
| Edit vulnerability master details | Master-data permission, separate from editing the finding |
| Delete an audit or finding | Delete permission, granted separately from edit |
| Export | Export permission — a role can read a screen and not export it |
| Bulk status change | The same approval permission, plus the checkbox column |
Before investigating a missing action as a defect, have the caller read out what they can see on the row menu, and compare it against their role.
Status transitions
An audit's status dropdown offers only the transitions legal from its current state, and only those the caller's role may perform. A missing option is one of those two things.
Changing status opens a confirmation dialog rather than applying immediately. It states
the audit, the transition, and whether a comment is required — which is a property of the
target status, not of the screen. Comments accept letters, numbers and _ - . & up to
5000 characters, so text pasted from a ticketing system is often rejected for characters
rather than length.
Counting rules
These four decide almost every "the numbers are wrong" ticket:
- A finding is not counted until it is approved. Discovered On is blank before approval for the same reason.
- Only considered audits reach dashboards and reports. The module screens show everything; the dashboards do not.
- An audit counts on the date it reached a final state, not the date it was created or the date the scan ran.
- Only two statuses close a finding. Everything else — including Risk accepted — still counts as open. See platform limitations.
Asynchronous processing
Uploads and syncs are queued. The Data Process column on the audit list shows how far a tool-fed audit has got, and it is the difference between "upload finished" and "data available".
A count that changes each time the caller refreshes is still processing. A count that has been static and wrong is not — check the queue for a failed job before assuming the data is bad.
Identity, and why counts jump
VA findings are matched either by the scanner's own identifier or by a composite key built from columns you configure. Changing that configuration redefines what "the same finding" means: existing findings stop matching, so they stay open with no new sightings while fresh copies arrive with no history, and totals appear to double.
Full detail, including the coercion rules that can collapse two findings into one, is in how findings are identified on import.
Deletion
Deleting an audit or a finding hides it; it does not remove it. A deleted audit's name still appears on historical findings and on reports already generated. That is the design, and it is the answer to "I deleted it but it is still in the report".
What to collect before escalating
- The audit ID and the client, not just the audit name — names repeat across clients.
- Whether the audit is considered, and the date it reached a final state.
- The Data Process state, and whether any queue job for it failed.
- For count disputes: the same number from two places — the module screen and the dashboard — because the difference between them is usually the answer rather than the problem.
- For import disputes: the source file, and whether the key configuration changed since the previous import.
Policy Compliance
Policy Compliance
Policy Compliance checks that your systems are configured the way your standards require. Where vulnerability assessment asks "is anything broken here", policy compliance asks "is this built the way we said it should be".
Configuration, not vulnerabilities
The distinction matters because the two are fixed by different people in different ways.
| Vulnerability | Policy compliance | |
|---|---|---|
| Typical finding | A missing patch, an exploitable flaw | A setting that does not meet the standard |
| Typical fix | Apply an update | Change a configuration |
| Typical source | A vulnerability scanner | A benchmark check |
| Usually owned by | Application or platform teams | Infrastructure and platform teams |
A server can be fully patched and still fail policy compliance — password rules too weak, logging not enabled, an unnecessary service running.
Controls and postures
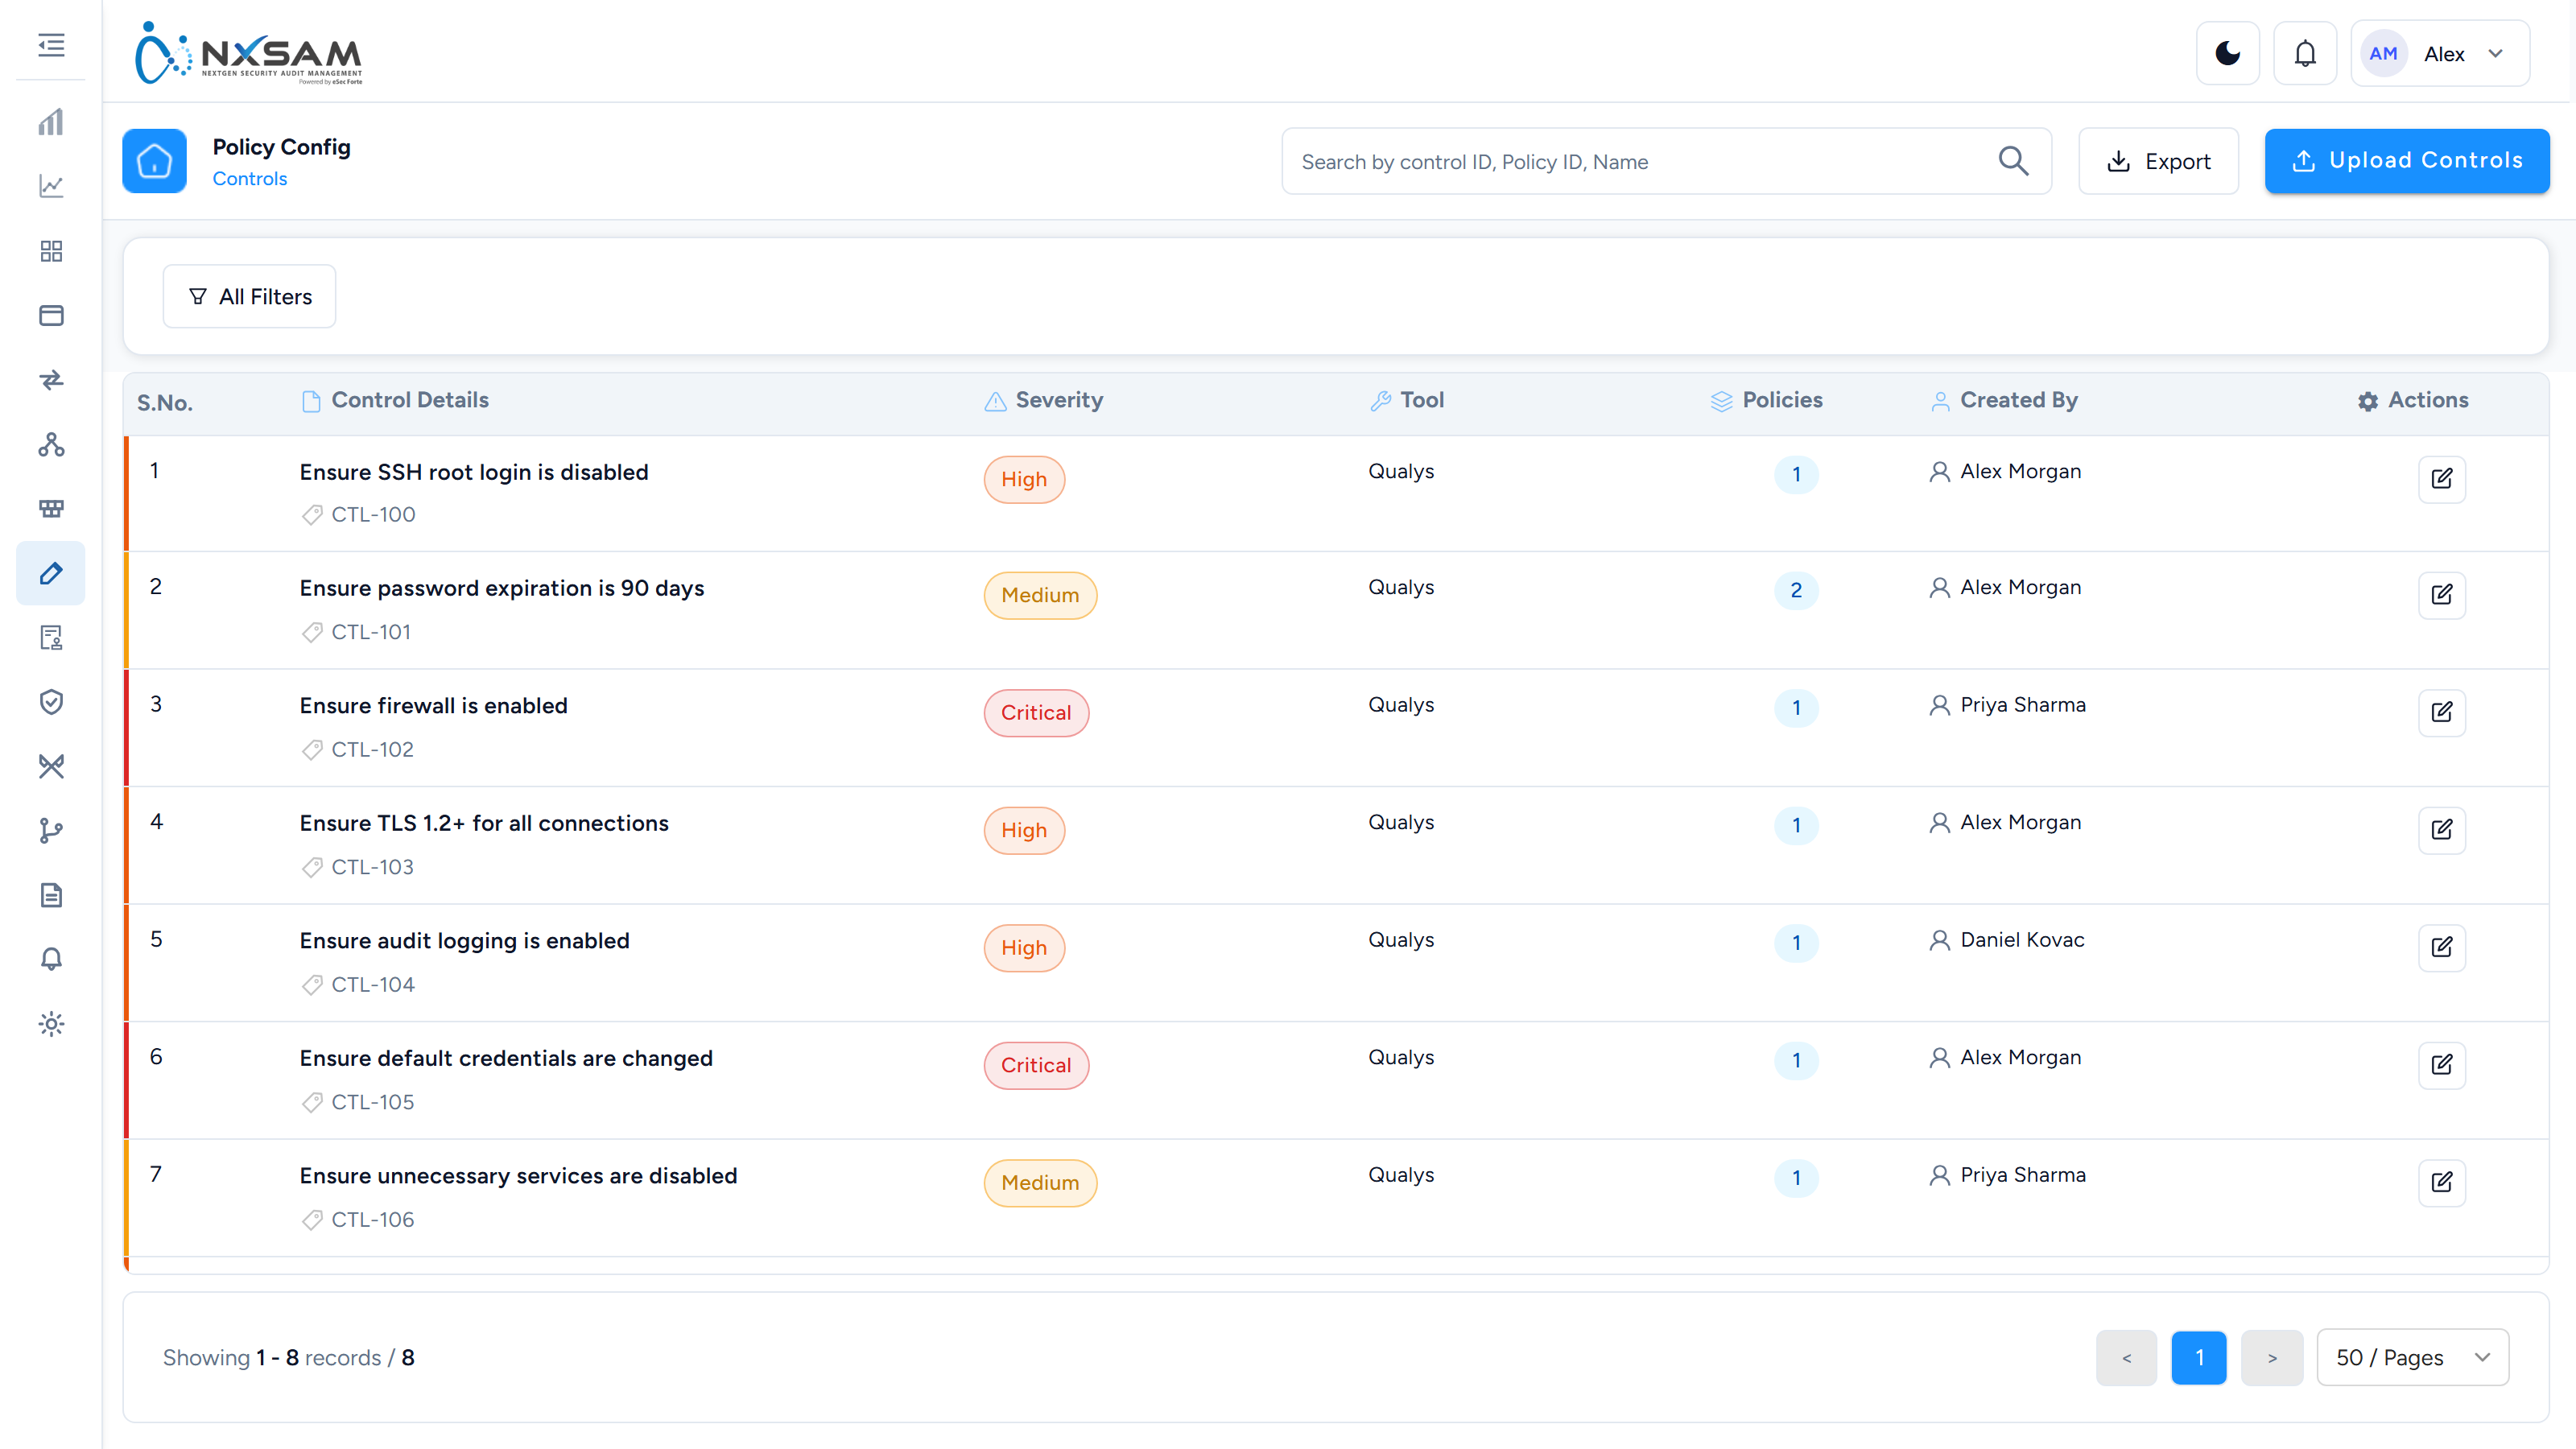
A control is a single requirement: "password minimum length is 14". A posture is the observed state of that control on a particular system — met, or not met.
So one control assessed across two hundred servers produces two hundred postures. This is why policy compliance volumes are so much larger than vulnerability volumes, and why the module is built around bulk assessment rather than individual findings.
How assessment works
- Controls are defined, usually derived from a benchmark such as CIS.
- An audit applies those controls to a set of systems.
- Results are imported from the tool that performed the checks.
- Each control-on-system produces a posture: compliant or not.
- Non-compliant postures are remediated and reassessed.
Reading the numbers
Compliance is usually expressed as a percentage — compliant postures over total postures. Two things to keep in mind when reading it:
- The denominator moves. Adding systems or controls changes the total, so the percentage can fall without anything getting worse.
- Not all controls matter equally. A high overall percentage can still hide failures on the controls that matter most. Read the failures, not only the ratio.
Reassessment is what changes a posture
Fixing the configuration does not update NxSAM. The system must be checked again and the result imported. Between the fix and the next assessment, the posture legitimately still shows as non-compliant.
Working effectively
- Group by control rather than by system when one setting fails widely — that is a single configuration-management fix, not hundreds of separate ones.
- Prioritise by the sensitivity of the systems affected, not by count alone.
- Where a control genuinely cannot be met on a given system, record the exception deliberately rather than leaving it perpetually failing.
Run a compliance audit, end to end
Policy Compliance counts differently from every other module, and the differences matter from the first step. Read how the numbers work alongside this if the counting is new to you.
Before you start
| You need | Why |
|---|---|
| The benchmark being assessed | It decides which controls apply |
| The host list in scope | Scope here is hosts, not applications |
| Working scanner credentials on those hosts | A failed check returns error, not fail |
1. Create the audit
Policy Config → PC Audit → Request New Audit.
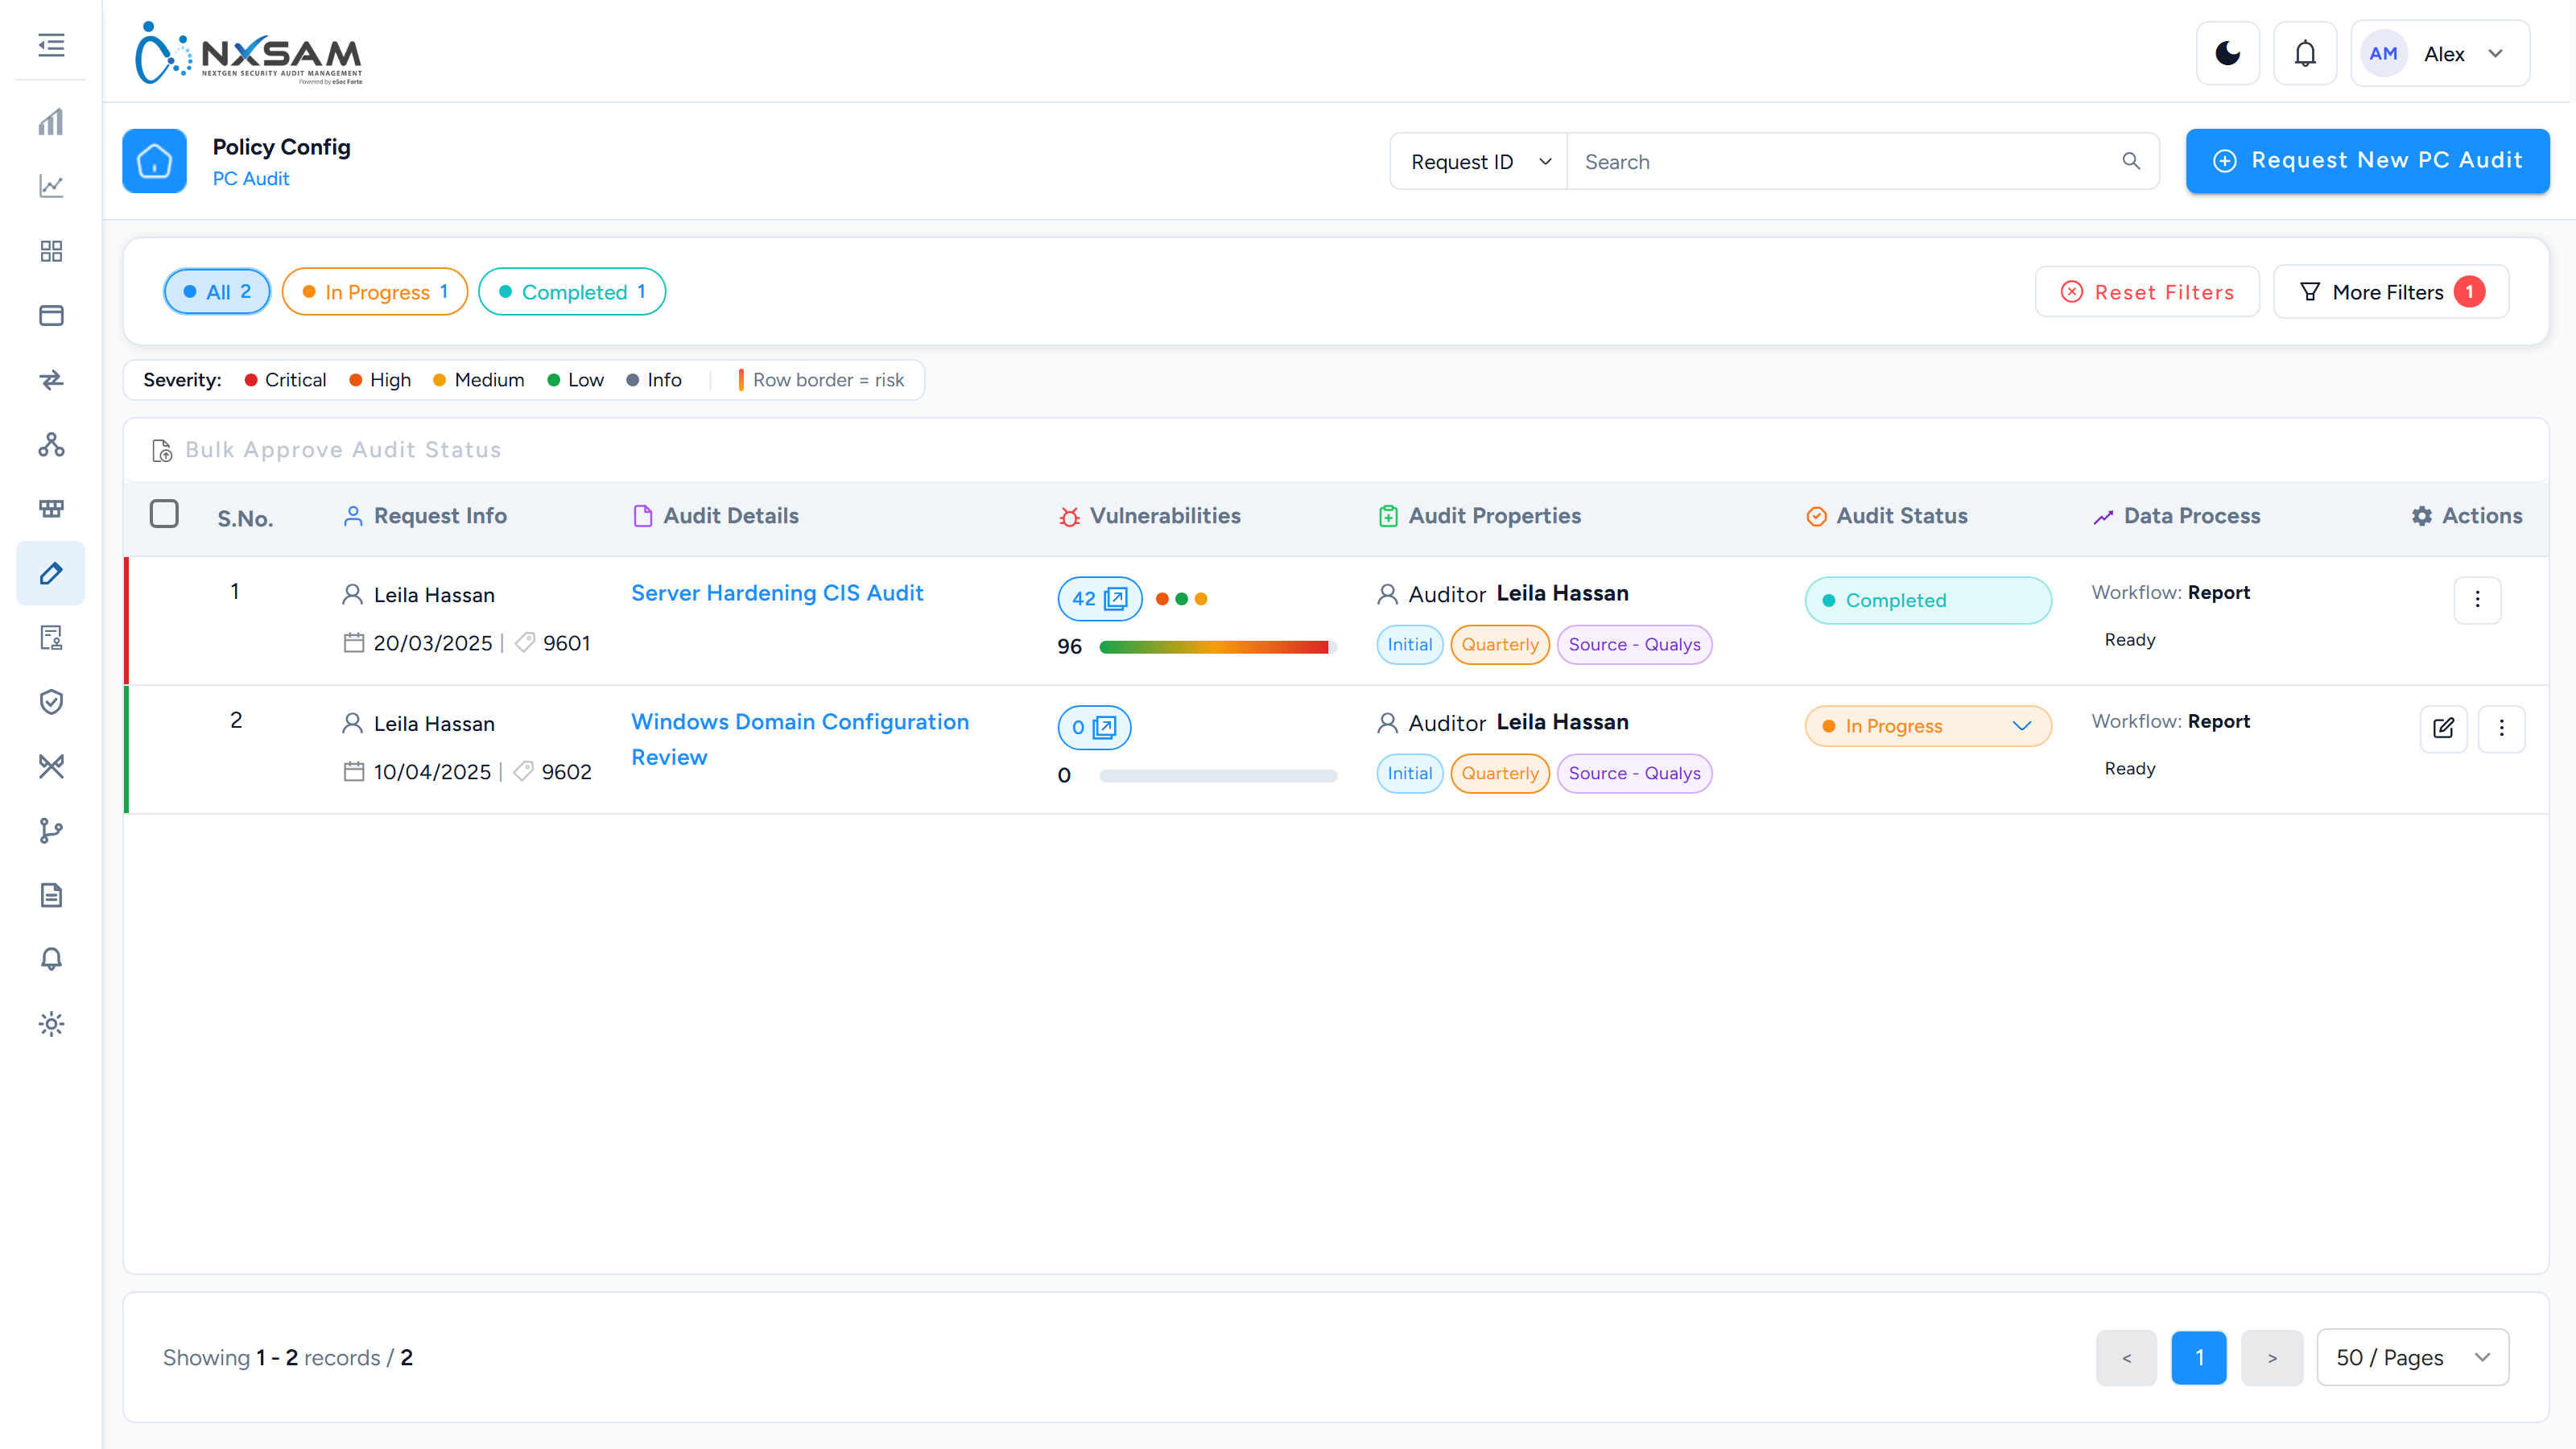
2. Set the scope
Add the hosts through host selection. Export IPs downloads the list — keep it, because compliance scope disputes are settled by comparing it against the benchmark tool's own target list.
Hosts that genuinely do not apply belong in excluded assets, each with a Comment giving the justification. An exclusion without one is the first thing an external auditor questions.
3. Upload the results
Uploads are queued rather than applied immediately.
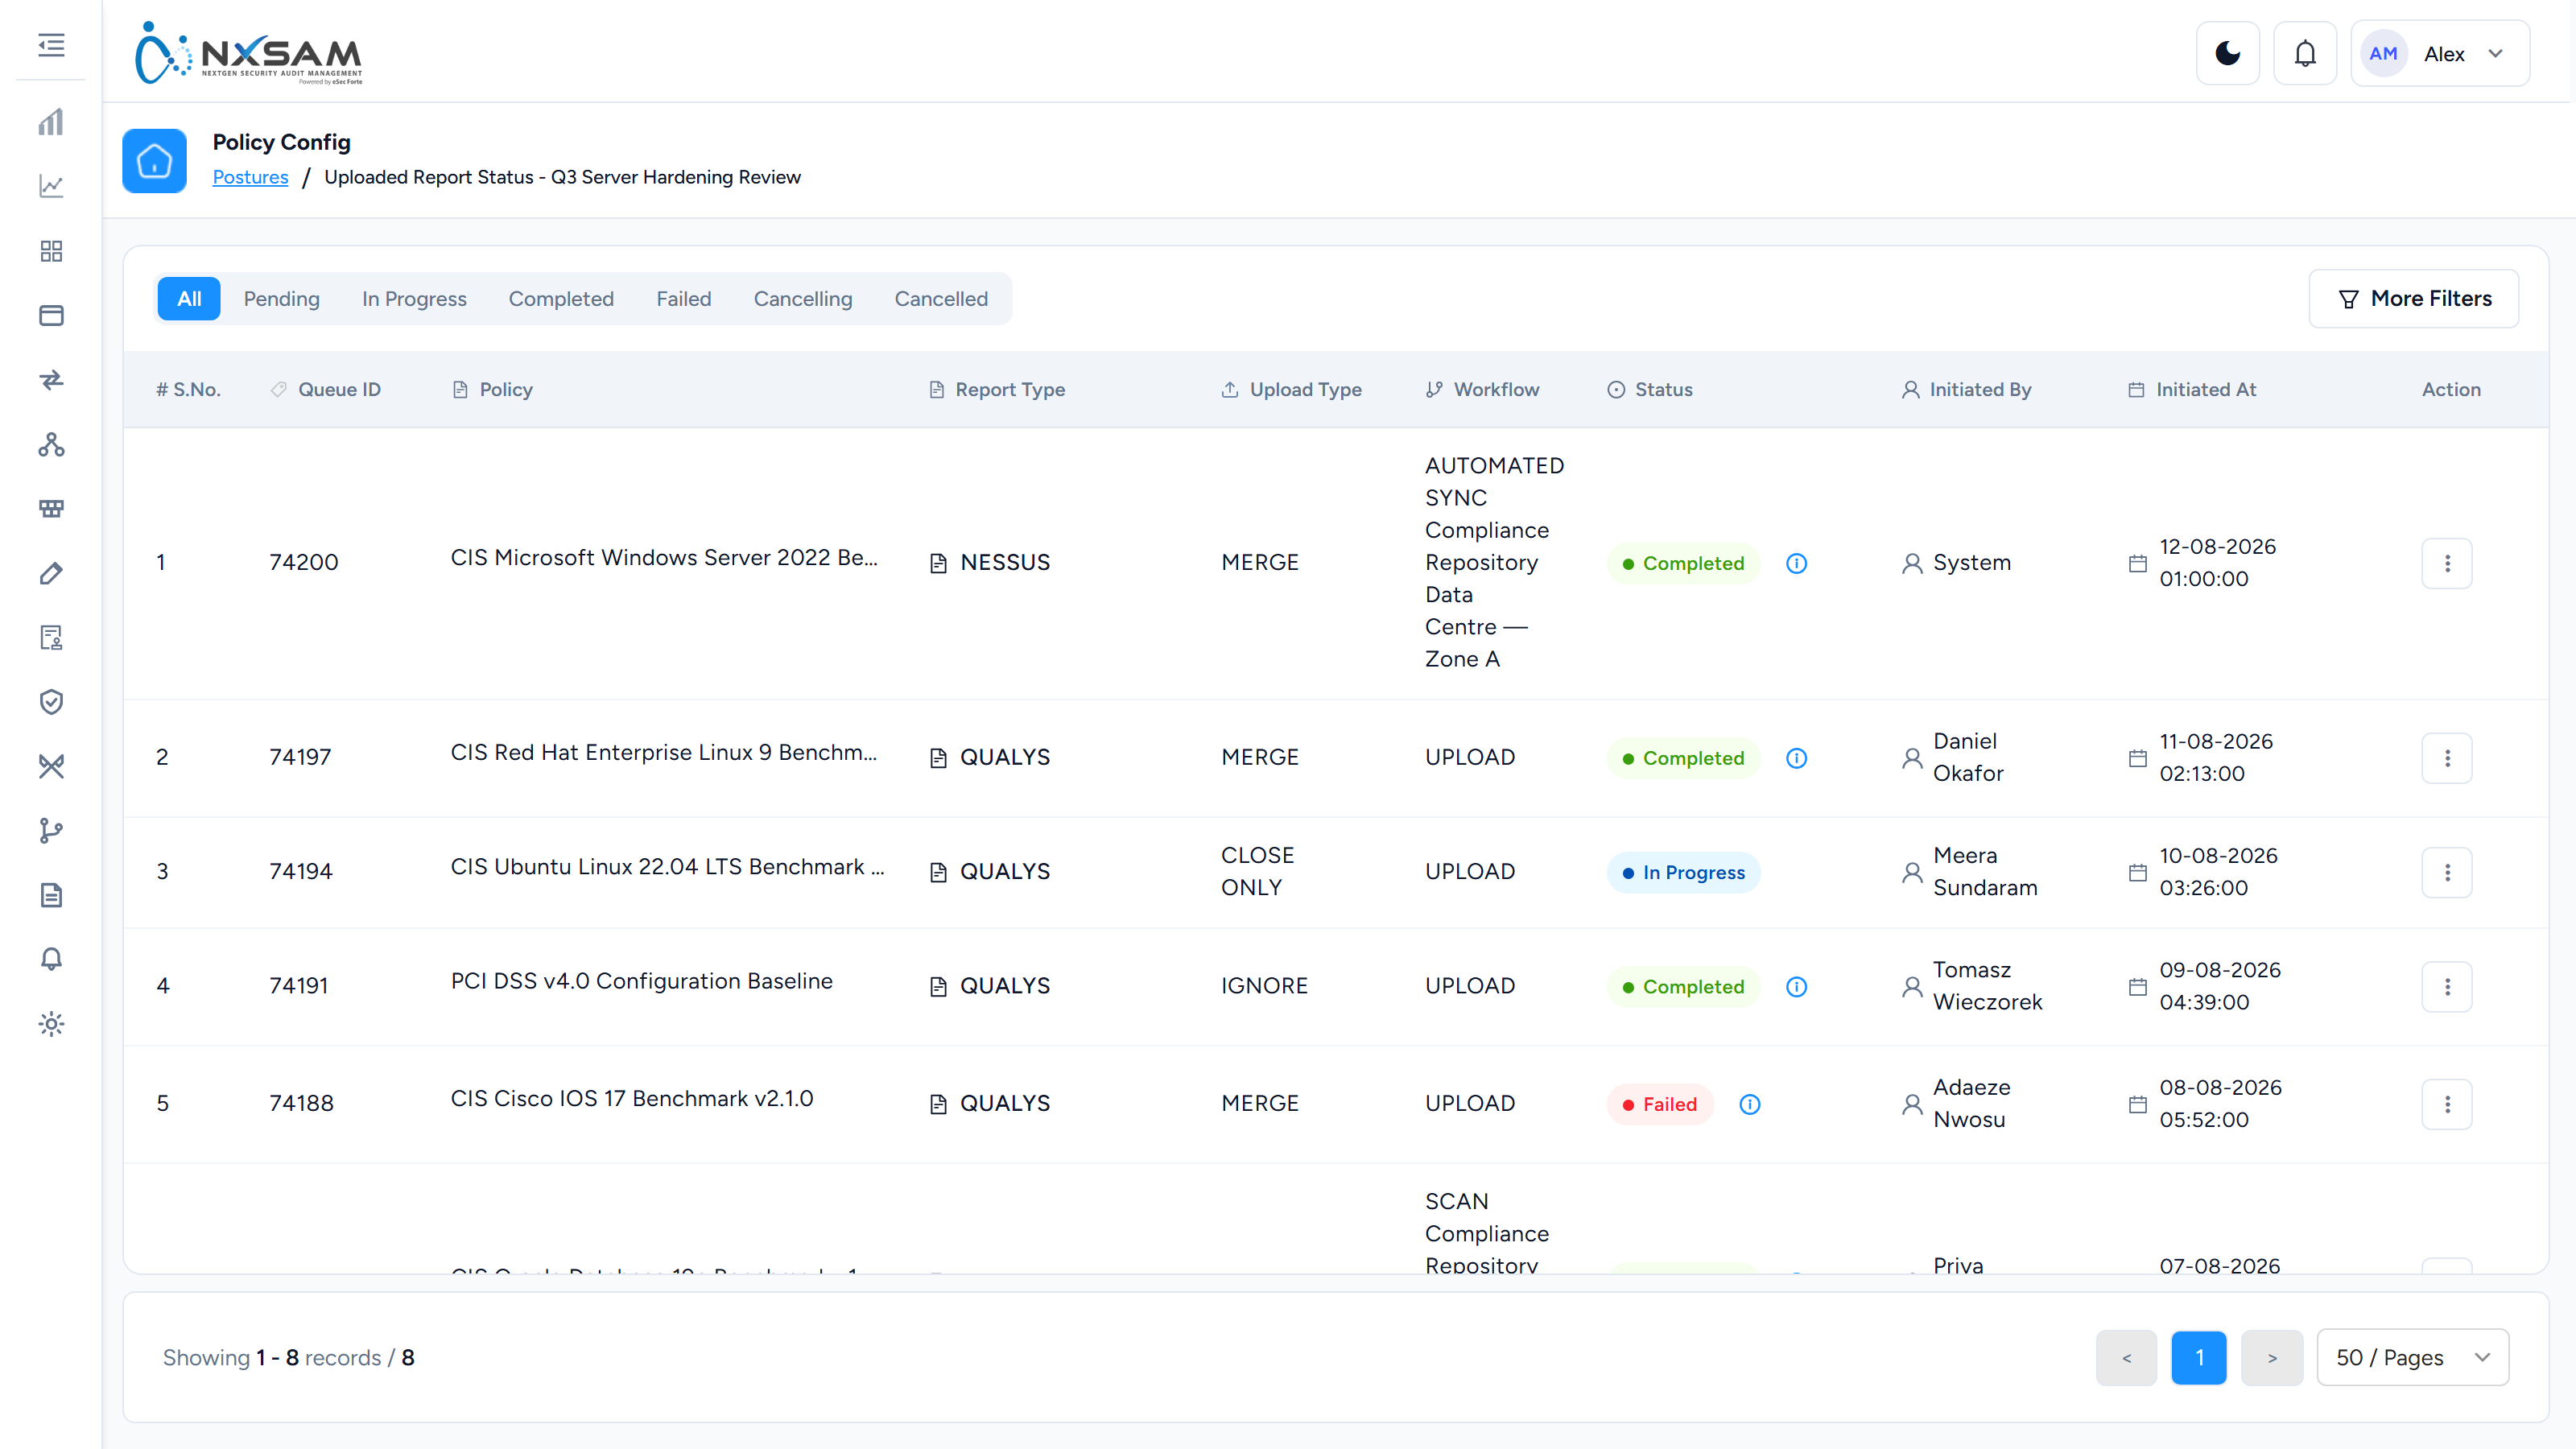
Choose the upload type carefully: it decides how incoming rows meet the existing ones — merge, closure, limited closure or ignore. The wrong choice is not a parsing error and produces no warning; it produces the wrong result quietly.
While it processes: the queue shows Pending or In Progress, and counts move. A failed job carries a per-row reason — most often a host in the file that is not in the audit's scope.
4. Read the results
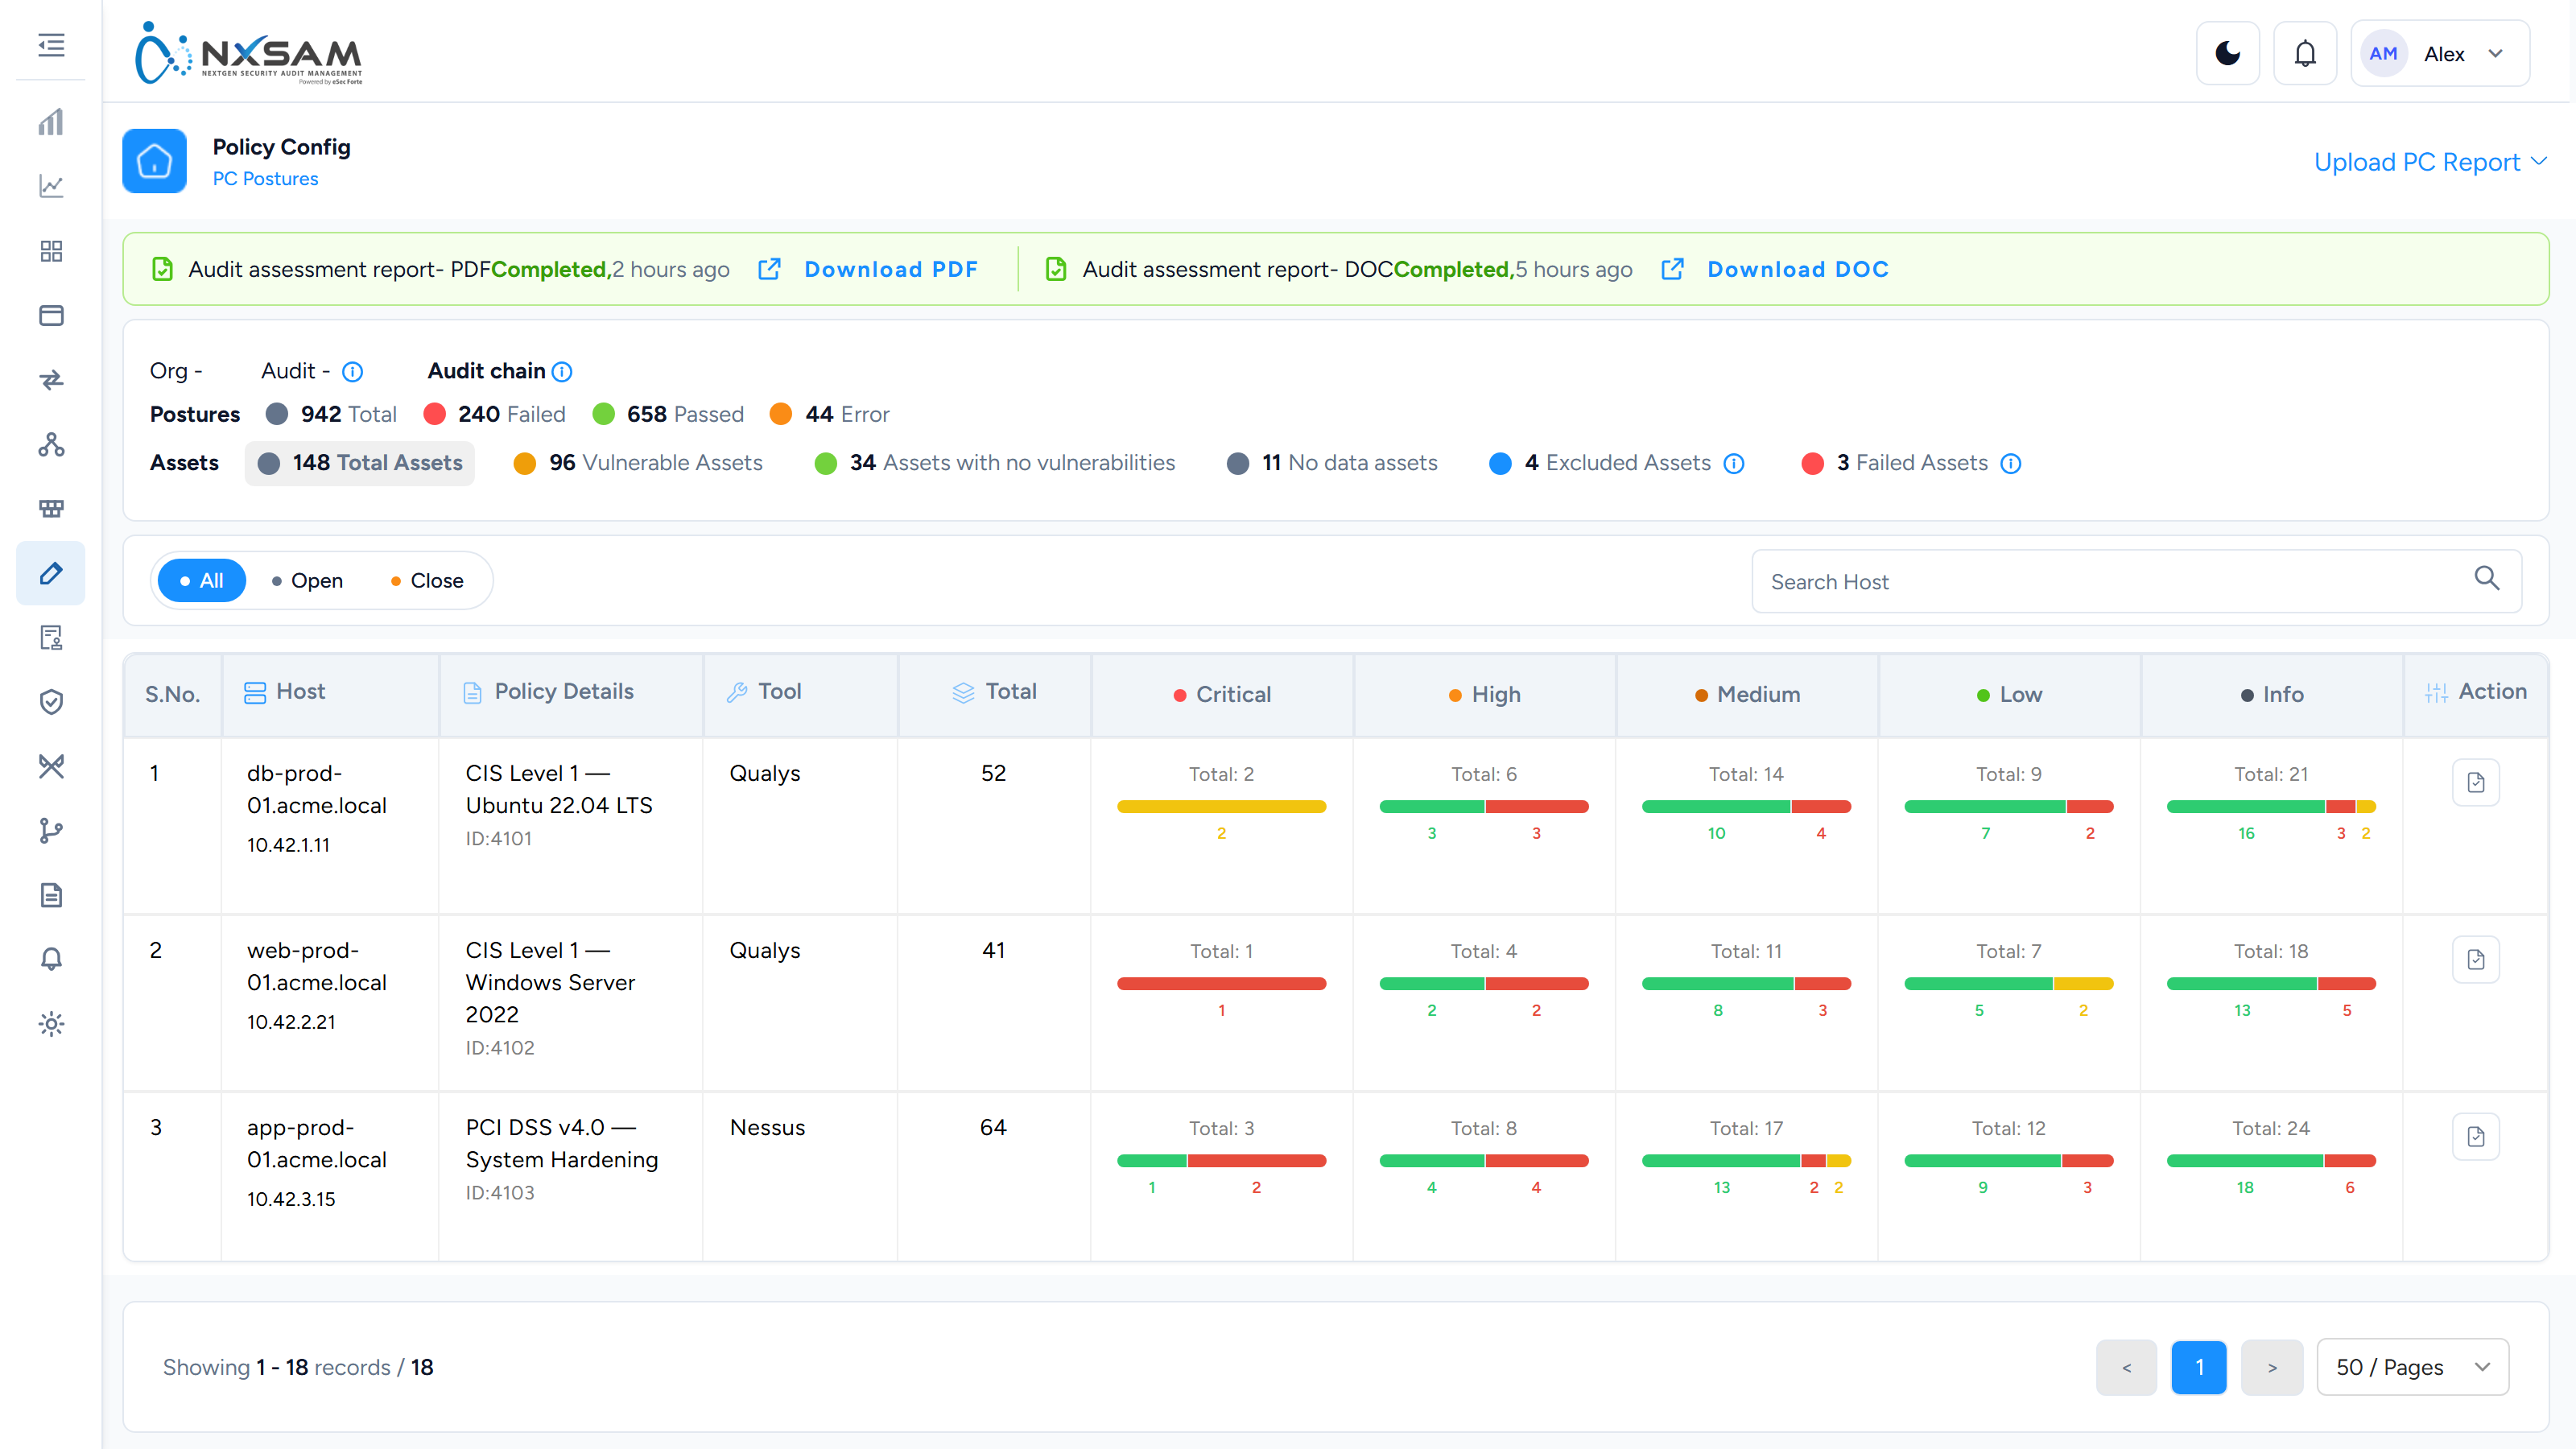
A posture is one control checked against one host. Every check produces a row whether it passed or not, so an audit of 400 hosts and 300 controls is 120,000 rows.
Total postures = passed + failed + error. If the three do not add up, the run is still processing.
Two columns that look alike and are not:
| Column | Means |
|---|---|
| Posture Status | What the check returned — pass, fail, error |
| Status | What your team decided to do |
A posture can be fail and Risk accepted at once. The machine is still non-compliant, and the organisation has agreed to leave it that way.
Mostly errors is a credentials problem, not a compliance result
Error means the check could not run. A benchmark returning mostly errors usually indicates the scanner could not authenticate to the targets.
5. Work the failures
Open a posture for Cause and Evidence. Cause is the rule's explanation; Evidence is the value actually read from the machine. When an owner says "that setting is correct", Evidence is what settles it.
Record decisions as you go:
- Comments — the discussion trail, with who and when.
- Status changes — each passes through a confirmation dialog naming the audit and the transition. Whether a comment is required depends on the target status.
Comments accept letters, numbers and _ - . & up to 5000 characters, so text pasted from a
ticketing system is sometimes rejected for its characters rather than its length.
6. Approve
Bulk Approve Audit Status acts on the rows you tick, which is what the checkbox column is for — a cycle's worth of completed audits can be approved together.
7. Re-assess
A follow-up assessment against the same scope shows what has actually changed. The status history on each posture — including the Evidence recorded by whoever changed it — is what an auditor reads later.
When something looks wrong
| Symptom | First thing to check |
|---|---|
| Upload "did nothing" | The queue, not the posture list |
| Counts do not add up | Still processing |
| Everything closed, or nothing updated | The upload type used |
| Mostly errors | Scanner credentials on the targets |
| The list is empty | The filter badge — filters persist across the module |
| The heading says "undefined" | A known defect; the table below is still correct |
Reading the Policy Compliance screens
This module counts differently from every other one, and the difference catches people out: a posture screen shows checks, not findings, and a single host contributes hundreds of them.
One row is a host, and the numbers are check counts
The postures screen groups by host. Each severity has four separate counts:
| Column family | Meaning |
|---|---|
<severity>_total_posture |
Checks at that severity that ran against this host |
<severity>_total_passed |
Of those, how many passed |
<severity>_total_failed |
How many failed |
<severity>_total_error |
How many could not be evaluated |
Total postures = passed + failed + error. If it does not, something did not complete.
Error is not failure
A check in error did not run — the agent could not read the setting, the file was absent, permissions were wrong. It is neither a pass nor a fail, and treating errors as passes is how a compliance score comes out optimistic.
A sudden compliance improvement with no configuration change is very often a rise in error counts. Check the error column before reporting the improvement.
Compliance percentage depends on what you divide by
Passed ÷ total is not the only defensible calculation. Passed ÷ (passed + failed) — excluding errors — gives a different and usually higher number.
When a compliance figure here disagrees with one from the scanner, this is the most likely reason, and it is worth establishing which convention each side uses before treating the gap as a data problem.
Postures versus controls
Two words used loosely in conversation and precisely in the product:
- A control is the rule — "SSH root login must be disabled". Defined once.
- A posture is the result of that rule checked against one asset. One control across 200 hosts produces 200 postures.
So "we have 40 controls" and "we have 8,000 postures" describe the same estate. Reports switch between the two, which is why a count can appear to change by two orders of magnitude between screens.
The posture upload queue
Policy Compliance data volumes are the largest in the platform — a single benchmark run across an estate produces hundreds of thousands of rows — so imports are queued and processed in batches.
The queue screen carries what you need when an import is questioned:
| Column | Use |
|---|---|
| Queue status | Pending, in progress, completed or failed |
| Queue summary | What was processed |
| Queue error | Why it stopped, where it did |
| Upload type | Whether this run replaced or merged with existing data |
| Policy title / repository / scan zone | Which benchmark, and over what |
| Initiator | Who started it |
| Automatic sync | Whether it was scheduled or hand-triggered |
Upload type is the one to check first on any "the numbers are wrong after an import" question. A merge and a replace produce very different totals from the same file, and the difference is invisible once the import has finished.
Why a host disappeared from the compliance report
In order of likelihood:
- The scan did not cover it. Compliance runs against a defined scope; a host outside it produces no postures and so no row — it is absent rather than passing.
- Every check errored. With no passes and no failures, some views have nothing to show.
- The import is still running. A partly loaded batch is missing hosts that will appear shortly.
The first is the most common and the least obvious, because an absent host looks the same as a compliant one on a summary screen.
Policy Compliance: every screen, column and action
Complements Reading the Policy Compliance screens. The module has the largest data volumes in the product, so almost everything here is queued, and the queue screens carry the answers.
The audit list
| Column | What it holds |
|---|---|
| Request Info | Who requested it, when, and the request ID |
| Audit Details | Audit name and the benchmark being assessed |
| Vulnerabilities | Failed checks with their severity split |
| Audit Properties | Type, cycle, scope, considered |
| Audit Status | Current state |
| Data Process | Whether the uploaded data has finished processing |
Data Process matters more here than anywhere else. A policy run produces hundreds of thousands of rows, so the gap between "upload finished" and "data processed" is minutes to hours — and counts move throughout. An audit reporting a number that keeps changing is still processing, not miscounting.
Row actions — eight
| Action | What it does |
|---|---|
| Edit Audit Details | Name, dates, properties |
| Manage Audit Scope | What was in and out of scope |
| Assign Auditors | Who runs it |
| Export IPs | Downloads the hosts in scope |
| Re-Audit | A follow-up assessment against the same scope |
| View Audit Chain | The original and every re-audit — Audit ID, Type, Audit Name, Status, Auditors |
| View Status History | Every status change |
| Delete Audit | Soft delete |
Export IPs is how a scope dispute gets settled. Compliance scope is defined by host list, and the export is what you compare against the benchmark tool's own target list when the two disagree on coverage.
Bulk Approve Audit Status acts on the audits ticked in the first column, so a cycle's worth of completed audits can be approved together rather than one at a time.
Changing an audit's status
Every status change goes through a confirmation step rather than applying on click. The dialog states, in order:
- the audit name and ID, so you can see you are moving the audit you meant to
- the transition itself — from status → to status
- a warning, where the transition has a consequence worth stopping for
- a Comments box, labelled (optional) or marked required depending on the target status
Then Change Status, or Cancel.
Whether a comment is required is a property of the target status
The same screen asks for a mandatory comment on one transition and offers an optional one on the next. That is configuration, not inconsistency — each status carries its own comment required flag on the status master.
Comments accept letters, numbers, and _ - . & only, up to 5000 characters. A comment
pasted from a ticketing system often carries characters outside that set, and the
dialog rejects it rather than truncating.
Filters
The filter drawer is reached from More Filters (All Filters on the policies screen), and the button carries a badge with the number of filters currently applied.
That badge is the answer to most "why can't I see my audit" questions: filters persist as you move around the module, and a non-zero badge on a screen that looks empty means the list is filtered, not empty.
Postures by host
| Column | What it holds |
|---|---|
| Host | The machine |
| Policy Details | Which benchmark was applied |
| Tool | Which scanner produced the result |
| Total | Checks run against this host |
| Critical / High / Medium / Low / Info | The severity split of the failures |
Remember that a row is a host and the numbers are check counts, not findings. One control across two hundred hosts produces two hundred postures.
Postures for one control
Opened from a host or a control.
| Column | What it holds |
|---|---|
| Posture ID | The individual result |
| Control Name | The rule being checked |
| Severity | As rated |
| Status | The working state |
| Posture Status | Pass, fail or error — the technical result |
| Cause | Why it failed |
| Evidence | What was actually found on the machine |
| Instance | Which occurrence, where a control is checked more than once per host |
| Discovered On / Last Observed Date | First and most recent sighting |
Row actions: View Posture Status History, Vulnerability History, and add a comment.
The two histories, and the comment trail
Three separate records sit behind a posture, and they answer different questions:
| Screen | Columns | Answers |
|---|---|---|
| View Posture Status History | By, On, Status, Evidence |
Who moved this posture to its current state, when, and on what basis |
| Vulnerability History | Audit Details, Risk, Status, Status Changed By, with its own More Filters |
How this finding has behaved across audits |
| View Posture Comments | By/On, Comments |
What people said about it, in order |
Both histories are headed by the Control Name, so a modal opened from a long list still says which control it belongs to.
Evidence on the status history is the audit trail, not the scan output
The Evidence column here is what the person changing the status recorded as their justification. It is not the machine reading — that is the Evidence column on the posture row itself.
They are deliberately separate: one is what the scanner found, the other is why a human decided to accept, defer or close it.
Status and Posture Status are different columns
Posture Status is what the check returned — pass, fail, error. Status is what your team has decided to do about it.
A posture can be fail and Risk accepted at the same time, and that combination is
correct: the machine is still non-compliant, and the organisation has agreed to leave
it that way.
Cause and Evidence together are what make a compliance finding arguable or not. Cause is the rule's explanation; Evidence is the actual value read from the machine. When an owner says "that setting is correct", Evidence is what settles it.
Controls and policies
| Screen | Columns |
|---|---|
| Controls | Control Details (identifier and name together), Severity, Tool, Policies, Created By |
| View controls | Control ID, Control Name, Severity, Created By |
| Policies | Policy Title/ID, Tool / ID, organisation, Policy Config Category, Created By |
| View control policies | Policy ID, Title, Tool, Org, Category |
| Categories | ID, Policy Config Category, Created By, Sync |
The Policies column on a control counts how many policies include it — a control in six policies is checked by all six, and fixing it improves every one of their scores.
Category actions are View Controls and Delete Config Category. The Sync column shows whether a category is kept in step with its source tool.
Host selection
Host IP, Host Name, Application Name, App Code, Selected — used when defining
what an audit covers. App Code is included because compliance scope is usually agreed
per application, while the scan runs per host.
Excluded assets
Network Asset ID, Host IP/Host Name, Comment.
Hosts deliberately outside a compliance run — a lab machine, an appliance the benchmark does not apply to. The Comment is the justification, and an exclusion without one is the first thing an auditor questions.
Updating asset status
Network Asset Id, Host IP/Host Name, Status — bulk-sets whether hosts are active in
compliance runs.
The screen accepts a CSV upload for bulk changes and offers a sample to download, so a list of several hundred hosts does not have to be set one at a time.
The posture upload queue
| Column | What it holds |
|---|---|
| Queue ID | The job |
| Policy | Which benchmark |
| Report Type | The kind of report uploaded |
| Upload Type | Merge or replace |
| Workflow | How results were processed |
| Status | Where the job is |
| Initiated By / Initiated At | Who and when |
Actions: Queue File, Queue Summary, Log File, and Retry on a failed upload. The queue can be filtered by Host IP as well as by status, so one host's uploads can be followed across runs.
Queue Summary is what was processed; Log File is the per-row detail including rejections. On any "the compliance numbers are wrong after an upload" question, check Upload Type first and the Log File second — those two answer it almost every time.
Scheduling a scan instead of uploading a report
Upload PC Report → Upload Report opens Upload New Report, and it is offered only on an audit that is still in progress with an auditor assigned — a completed audit's menu has View Upload Report alone. The form unfolds as you choose:
| Field | What it decides |
|---|---|
| Policy Config Category | Which category of the policy this run covers |
| Report Type | Qualys, Nessus or Manual — the scanner, or a hand-assessed sheet |
| Workflow | Upload takes a report file. Scan asks the scanner to run the benchmark and bring the result back. Automatic Scan — Nessus with a Tenable SC connection only — re-runs it on a schedule |
| Scan Option | Start a New scan, or reuse an Existing one by its Scan Result or Scan ID |
| Config Policy | The benchmark the scanner runs |
| Scan Zone, Repository | Where the scanner runs from and where its results are kept, as defined in Tenable SC |
| Track hosts which have been issued new IP address | Follow a host across an address change, for estates using dynamic addressing |
| Credentials | The scanner's own credential sets, one or more, for an authenticated scan |
| Schedule Scan / Schedule At | Run now, or at a chosen date and time |
| Upload Type | Ignore leaves assets that already have a posture untouched; Override replaces their results |
Qualys shows the same shape with an Option Profile in place of the Tenable fields. A scheduled scan appears in the queue like an upload and can be cancelled while it is running — the confirmation asks whether to cancel the on-going scan. A scan needs a target, so an IP is mandatory for it; a report upload has no such requirement, since the hosts are in the file.
The Host selection step searches by App Code, Application Name, Host IP or Host Name, so the hosts in scope can be picked from either the application side or the network side of the inventory.
Bulk upload of policies and controls
Accepts CSV or XLSX. The queue reports Status, Initiated By, Uploaded At,
with Download and Log File Download.
Reporting
Download xlsx Report from the postures view exports the current posture set as filtered — the format compliance teams actually work in, because they annotate it and send it back to system owners.
Policy Compliance: find the right screen
Every screen in this module, what each one is for, and where it lives. Use it to find the right screen quickly, and to confirm you are on the one a colleague means — several screens in this product have similar names and different jobs.
Screenshots come from a demonstration data set, so the figures are illustrative. Click any screenshot to open it at full resolution.
Control Categories
How controls are grouped for reporting — by domain, benchmark section or your own scheme.
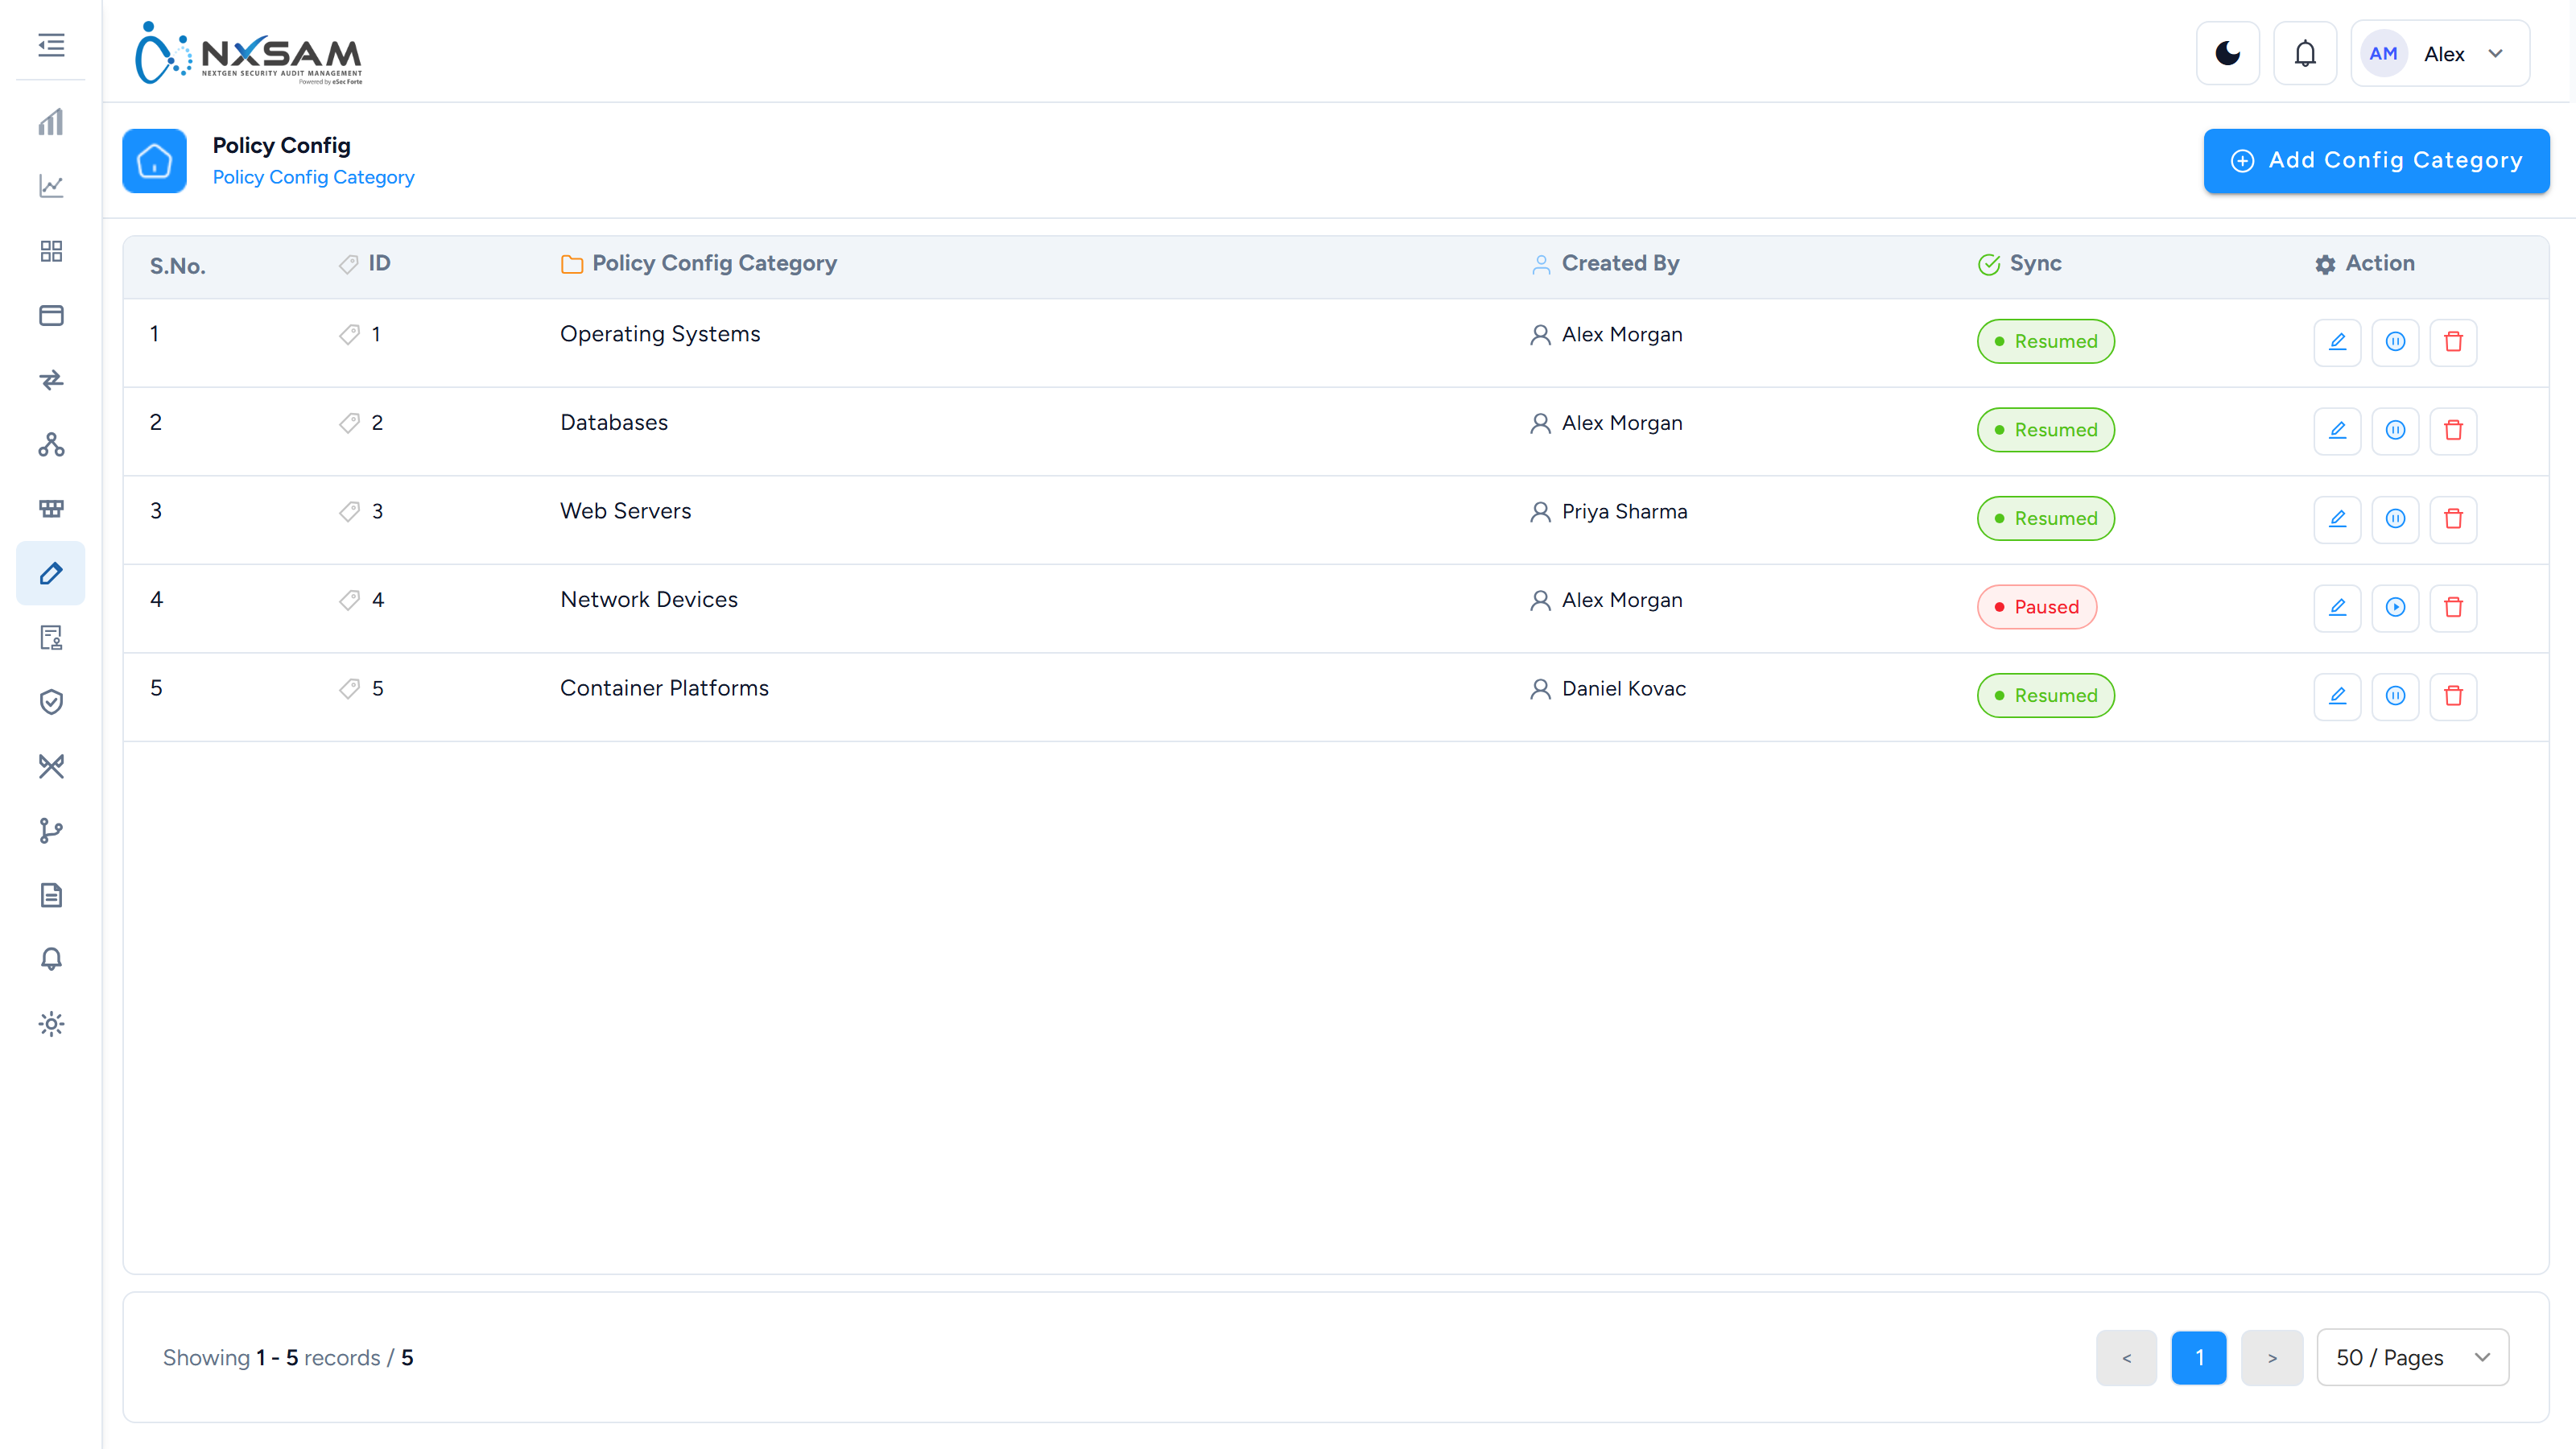
Policy Configuration
Which benchmarks are in use and how their results are interpreted.
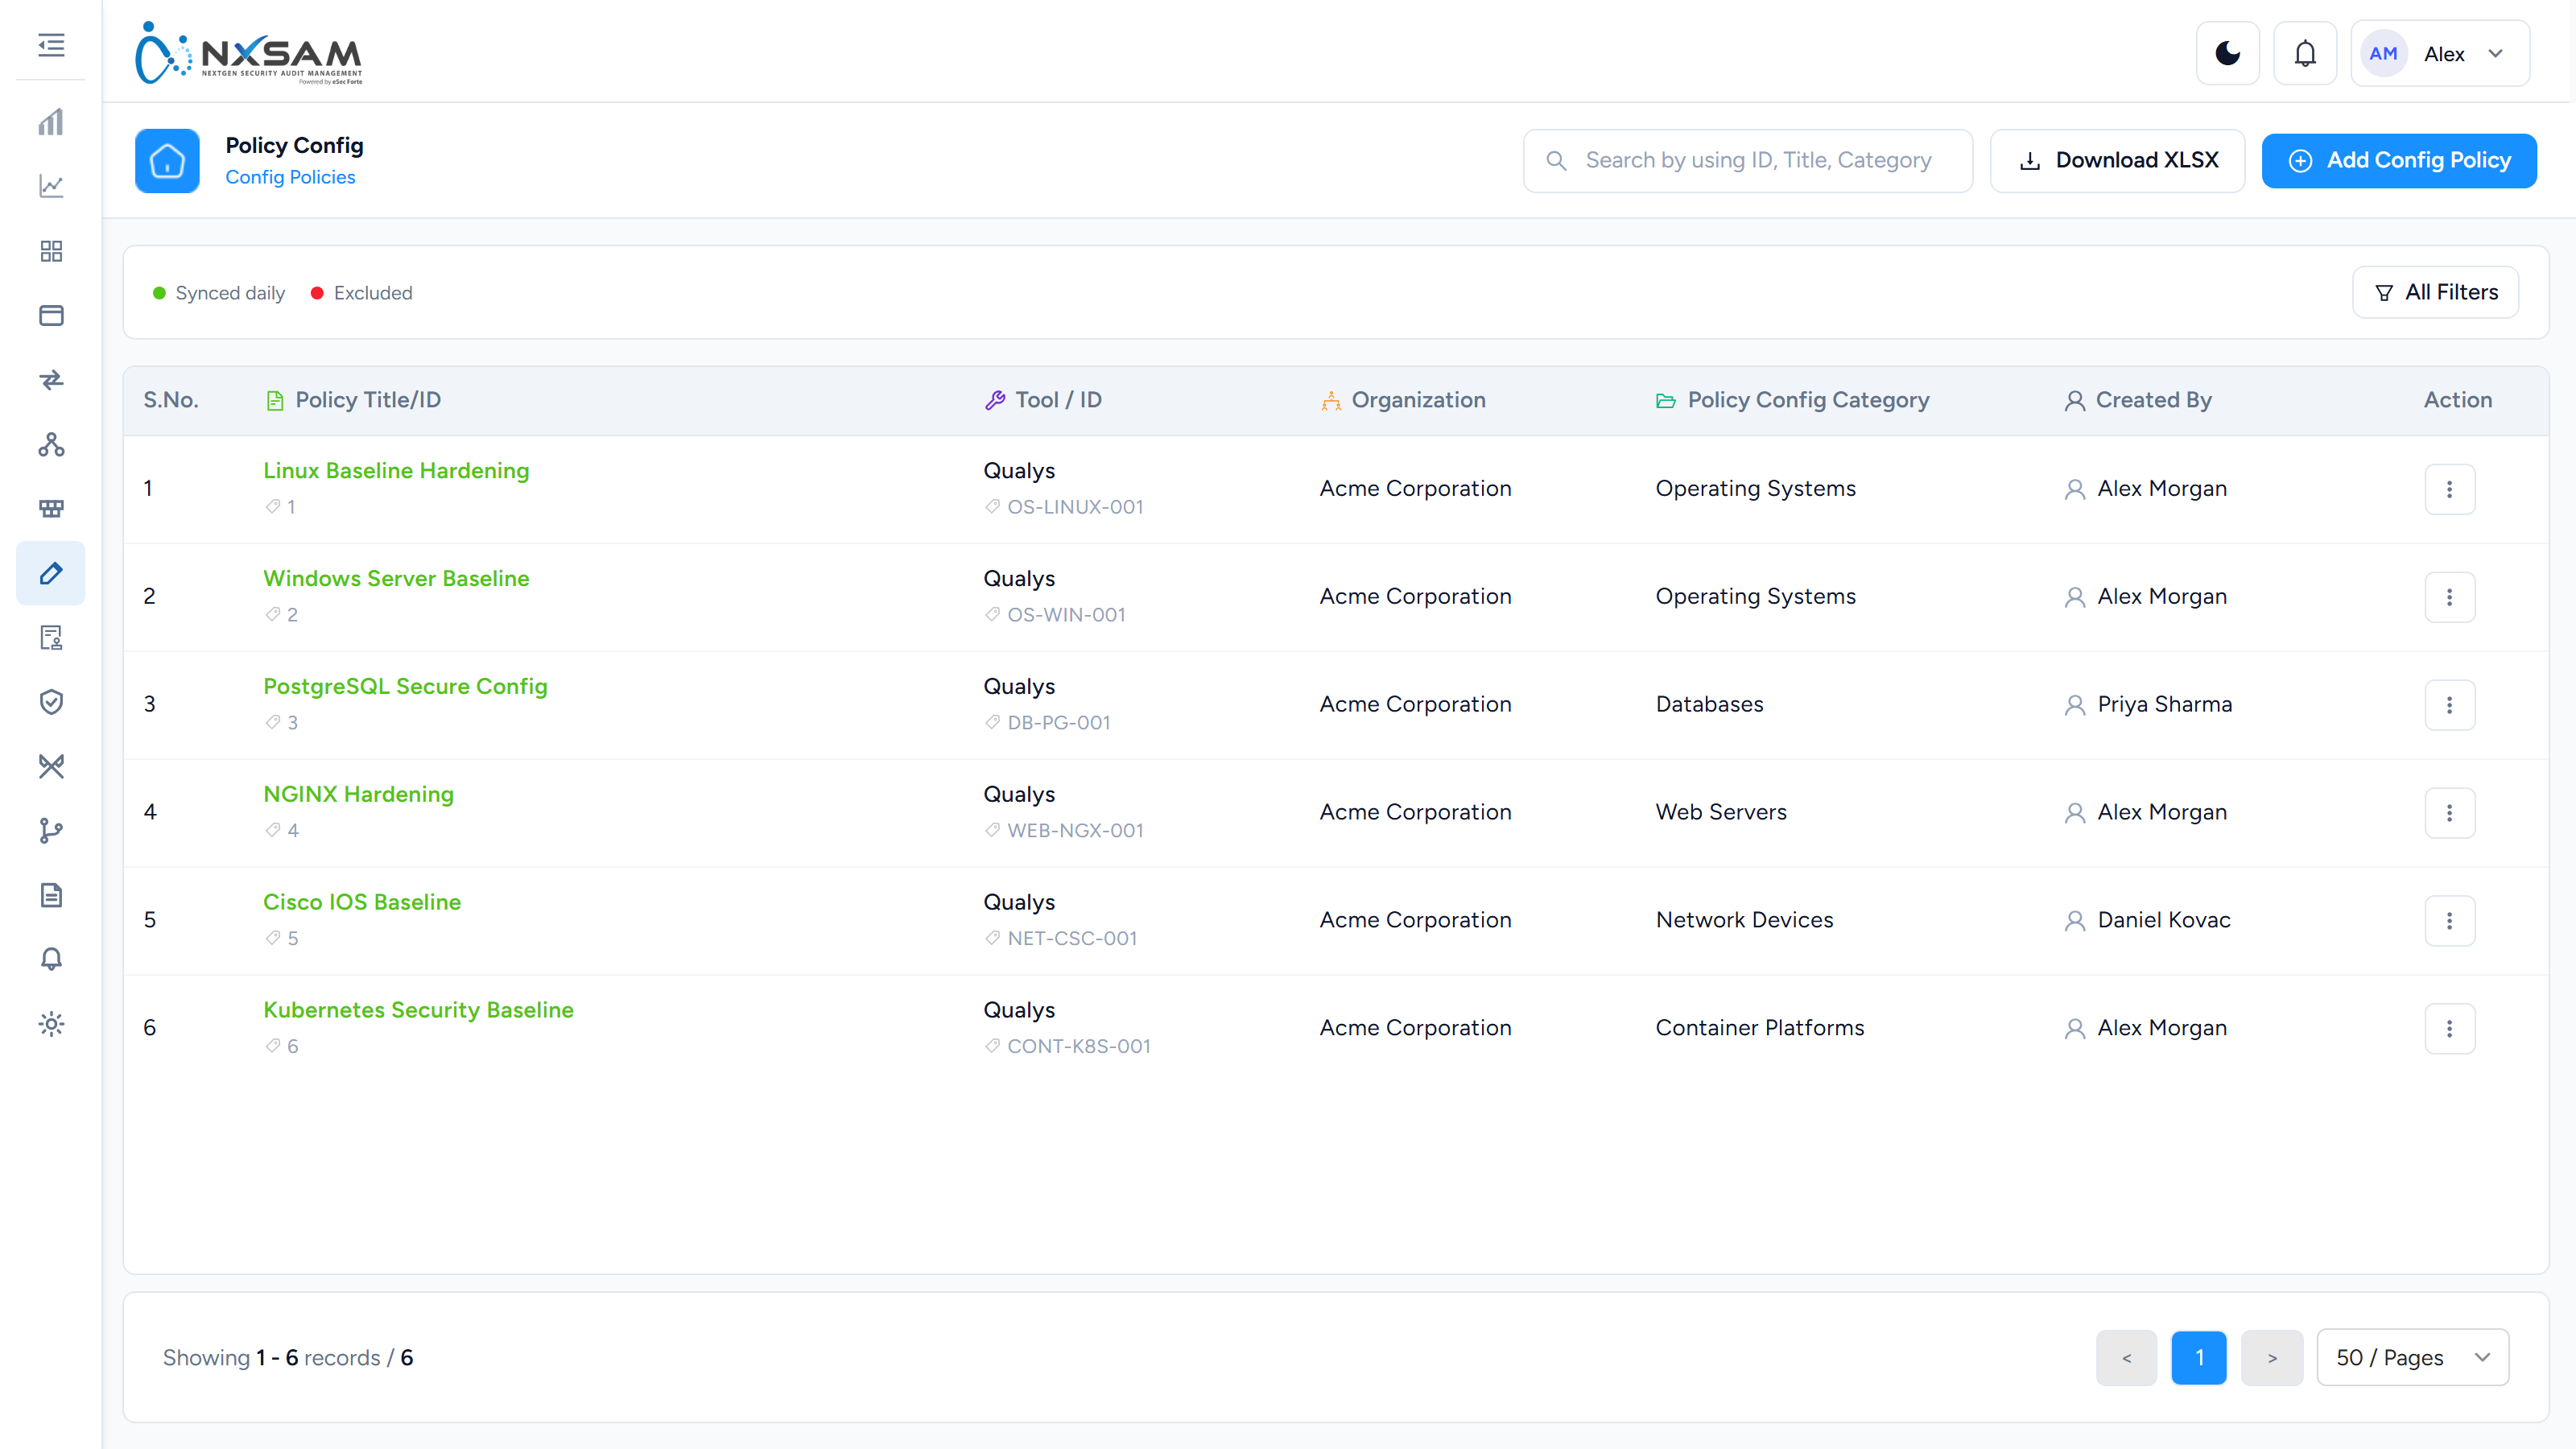
Postures
The result of one control checked against one asset — the expected value, the actual value, and whether it passed.
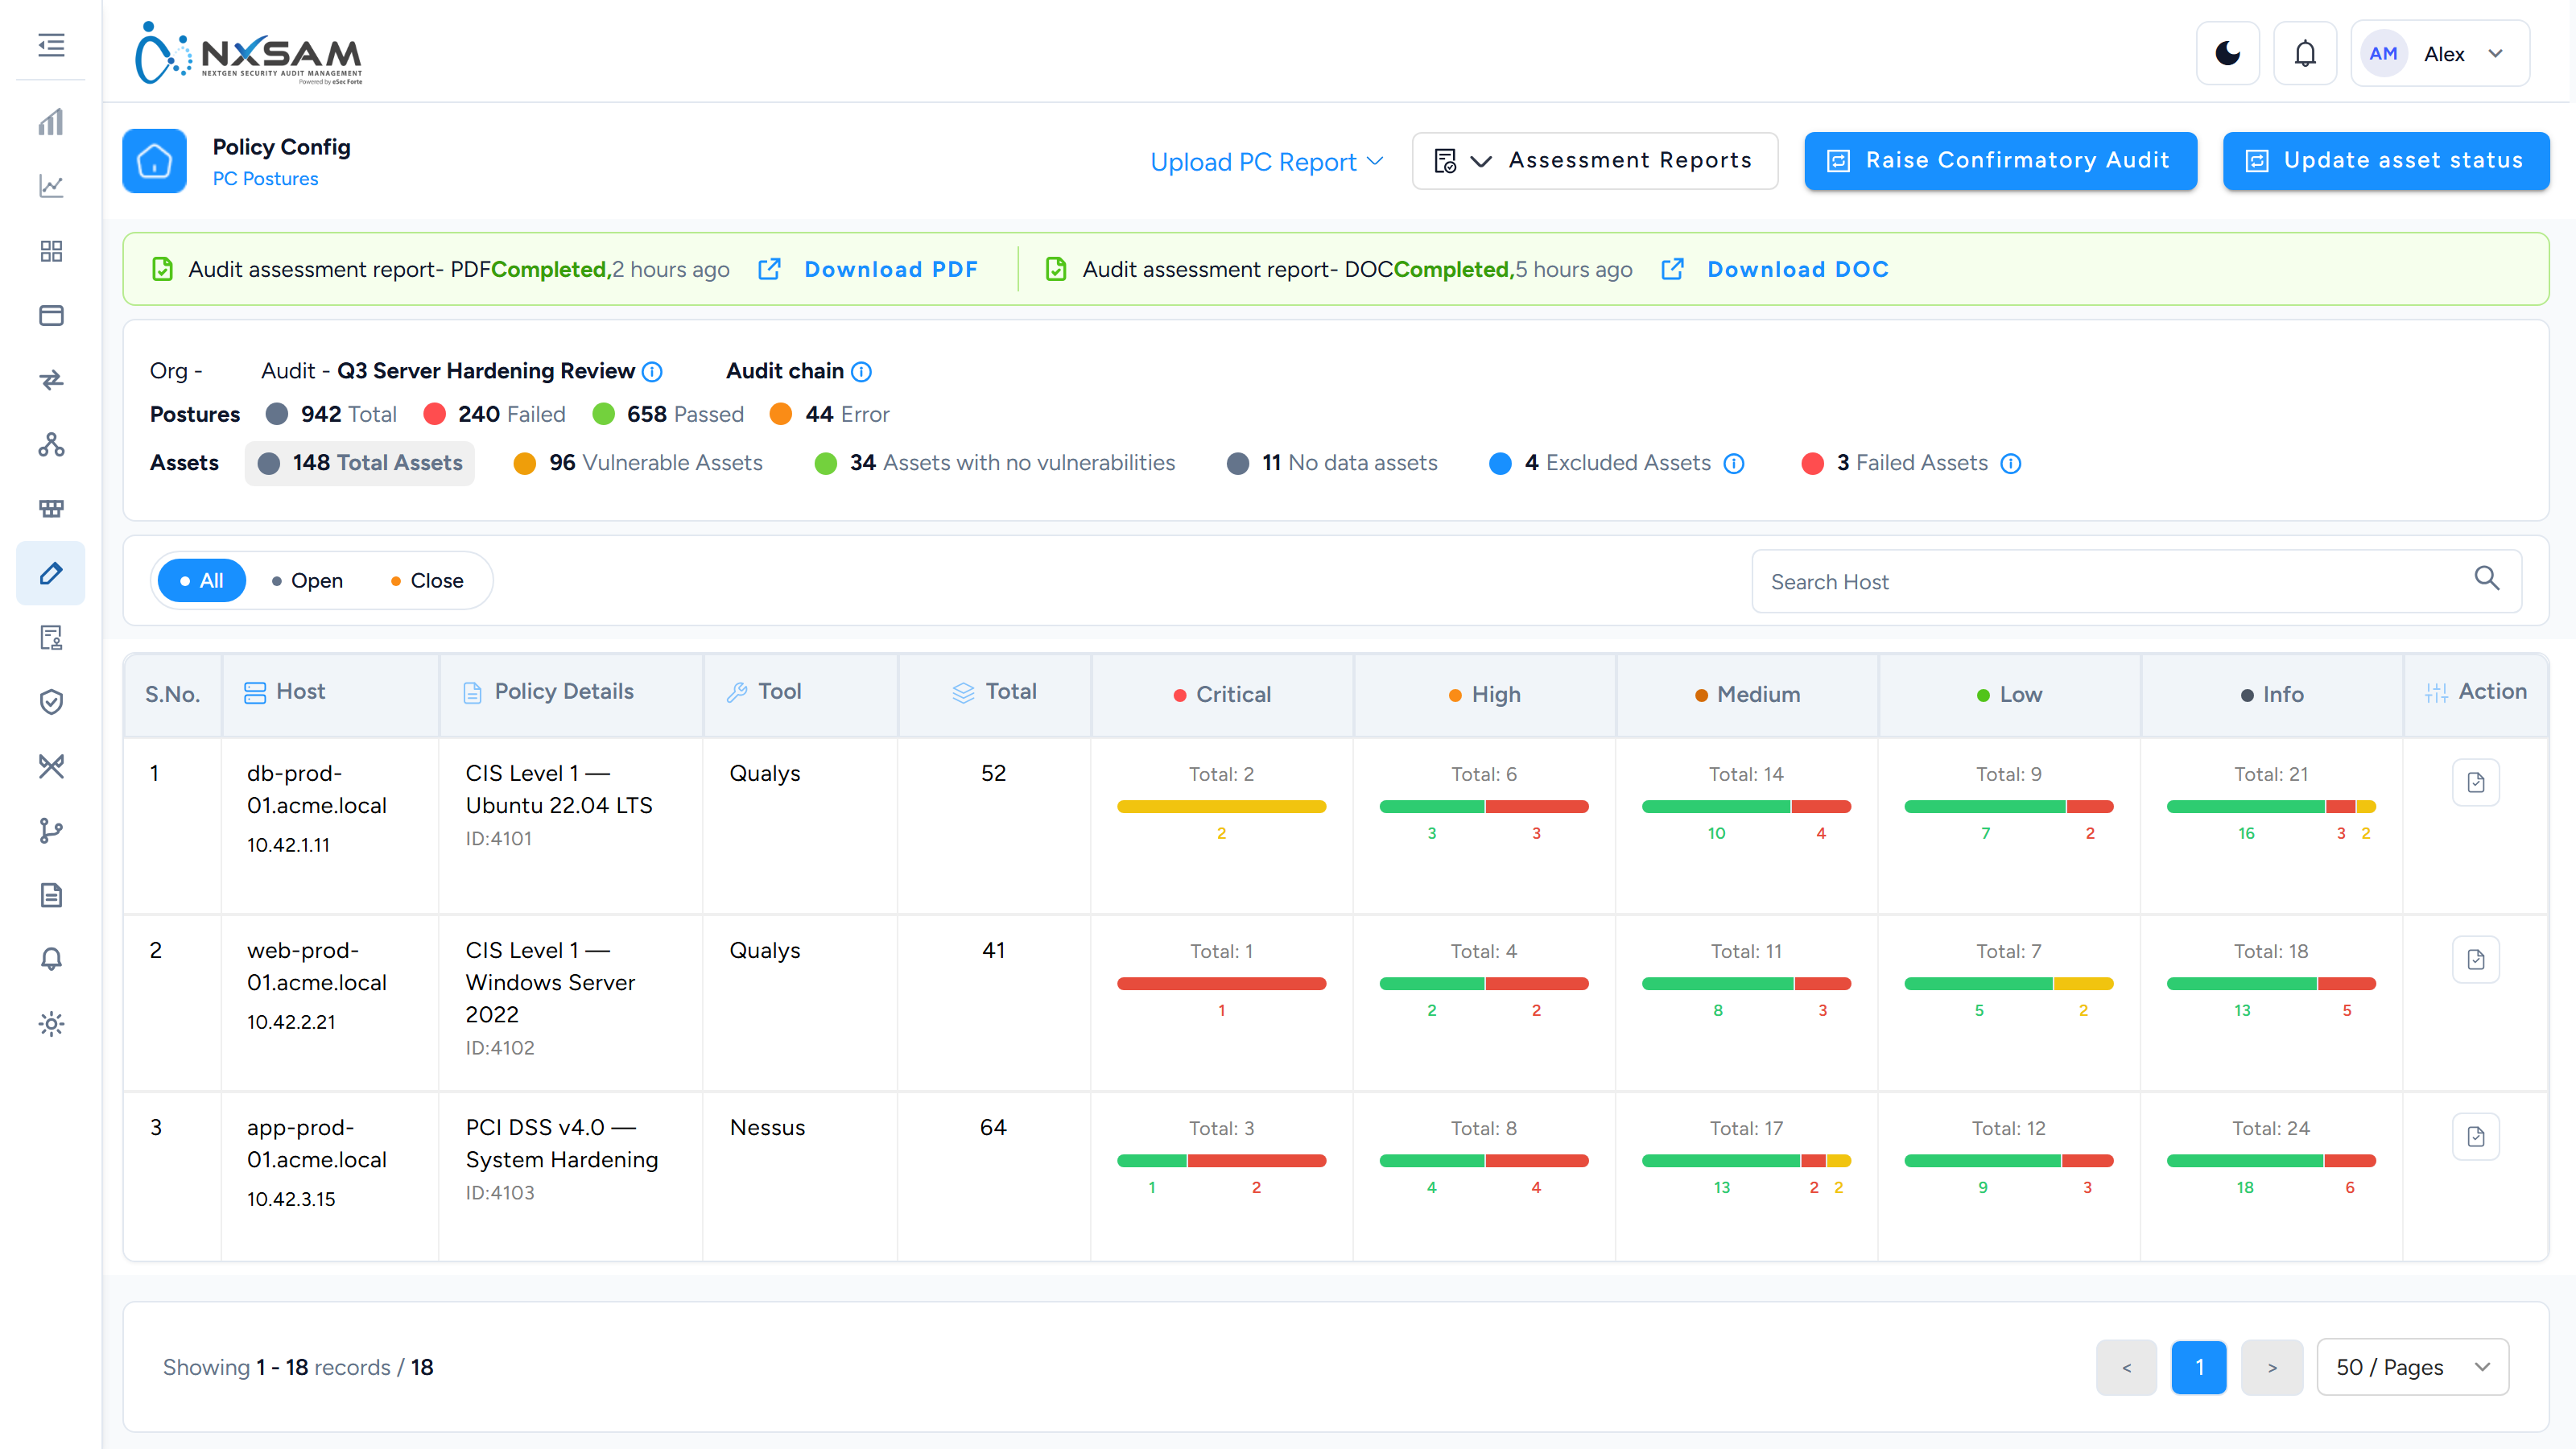
Policy Compliance: support reference
Internal. The customer-facing explanation is in Reading the Policy Compliance screens and the screen reference.
This module counts differently from every other one and carries the largest data volumes in the product. Both facts generate most of its tickets.
It counts postures, not vulnerabilities
Everywhere else a finding is a weakness. Here a posture is one control checked against one host, and every check produces a row whether it passed or failed.
Total postures = passed + failed + error. If that sum does not hold, the run is still processing rather than miscounting.
A single audit against 400 hosts and 300 controls is 120,000 rows. Nothing about this module is instant, and screens that look wrong are frequently screens that are not finished.
Posture Status is not Status
| Column | Means |
|---|---|
| Posture Status | What the check returned — pass, fail, error |
| Status | What your team decided to do about it |
A posture can legitimately be fail and Risk accepted at once: the machine is still non-compliant and the organisation has agreed to leave it that way. Reports that conflate the two overstate remediation.
Error is neither pass nor fail — the check could not run. A benchmark reporting mostly errors is usually a credential or agent problem on the target, not a compliance result.
The upload queue answers "where is my data"
Every posture upload is queued. The queue records the policy, report type, upload type, workflow, status, who initiated it and when.
- A job in Pending or In Progress has not landed yet; counts will keep moving.
- A Failed job carries a per-row reason — most often a host in the file that is not in the audit's scope.
- Cancelled was stopped deliberately by someone.
If a caller says an upload "did nothing", the queue is the first screen to open, not the posture list.
The queue heading can read 'undefined'
Reached from a bookmark or a refresh that loses its parameters, the heading prints Uploaded Report Status - undefined. The table beneath it is still correct. This is a known defect (FINDINGS #17), not a sign of a broken upload.
Upload types change what an upload does
The upload type decides how incoming rows meet existing ones — merge, closure, limited closure, ignore. Choosing the wrong one is not a parsing error and produces no warning; it produces the wrong result quietly.
A caller reporting that "everything closed" or "nothing updated" after an upload has usually chosen a different type from last time. The queue records which was used.
Evidence and Cause
Two different things, and support answers depend on which is meant:
- On a posture row, Evidence is the value read from the machine, and Cause is the rule's explanation. Together they are what makes a finding arguable or not — "that setting is correct" is settled by Evidence.
- On the status history, Evidence is what the person changing the status recorded as justification. It is an audit trail, not a machine reading.
Scope disputes
Compliance scope is a host list. Export IPs on the audit produces it, and comparing that export against the benchmark tool's own target list settles almost every "you didn't scan X" disagreement.
Excluded assets carry a Comment; an exclusion without one is the first thing an external auditor questions.
Bulk operations
- Bulk Approve Audit Status acts on ticked rows — the reason the checkbox column exists.
- Asset status can be set for hundreds of hosts by CSV upload, with a downloadable sample.
- Status changes always pass through a confirmation dialog that names the audit and the
transition. Whether a comment is required is a property of the target status, and comments
reject characters outside
A-Z a-z 0-9 _ - . &.
An empty screen is usually a filter
The filter drawer is reached from More Filters / All Filters, and the button carries a badge with the number of filters applied. Filters persist as the caller moves around the module. A non-zero badge over an empty list means filtered, not empty — and this is the single most common false alarm in the module.
What to collect before escalating
- The audit ID, the client, and the benchmark.
- The queue entry for the upload in question — status, upload type, and the failure reason if any.
- Whether the three posture counts reconcile.
- The filter badge count on the screen the caller is describing.
- For scope disputes: the Export IPs file and the tool's own target list.
Container Security
Container Security
Container Security covers weaknesses in container images — the packaged applications your platforms run. Findings arrive from container scanning tools such as Prisma Cloud.
How containers differ from other assets
Two differences change how you work with them:
An image is immutable. You do not patch a running container; you build a new image and redeploy. So remediation means rebuilding, and a finding persists until the new image is scanned and confirmed.
Most findings come from the base image. A container inherits everything in the image it was built from. That means a single base image update frequently resolves large numbers of findings across many images at once — and conversely, an outdated base image reproduces the same findings everywhere it is used.
Fix the base image, not the finding
When the same vulnerability appears across many images, it is usually one inherited component. Updating the shared base image resolves it everywhere. Treating each image separately multiplies the work for no additional benefit.
What the module holds
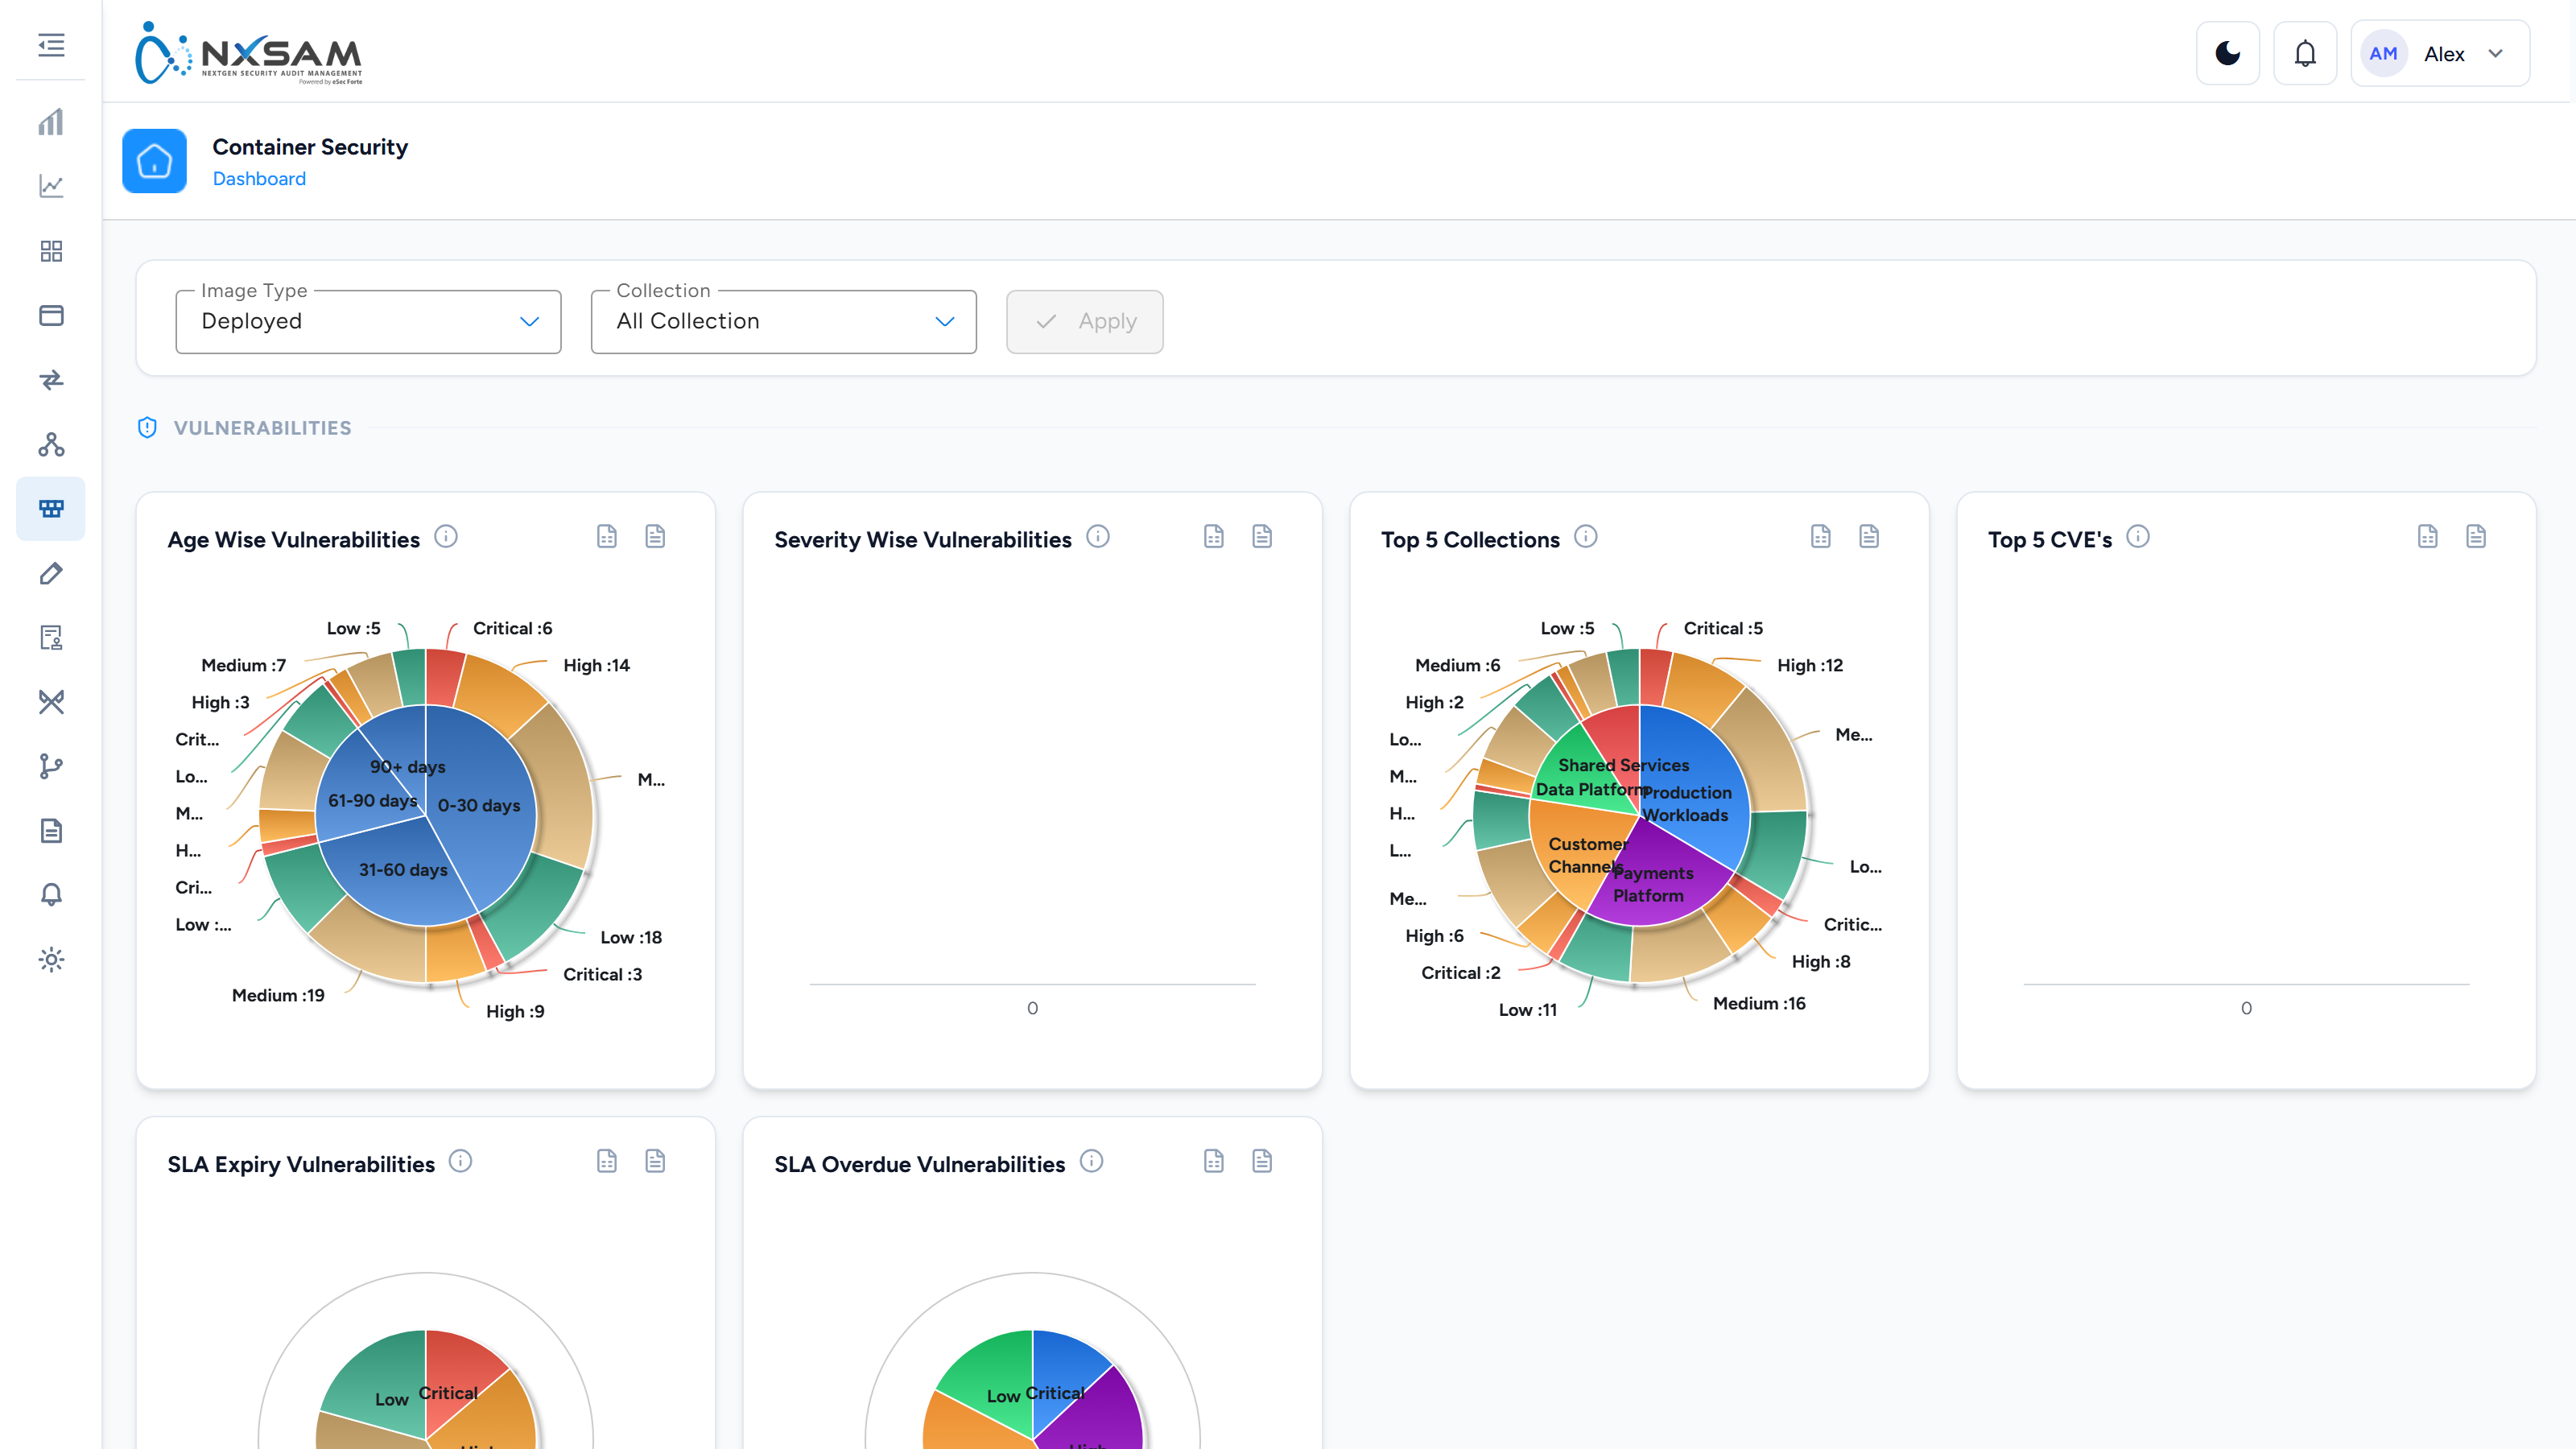
| Screen | Shows |
|---|---|
| Dashboard | Container posture at a glance |
| Collections | Logical groupings of images, usually mirroring how your platform organises workloads |
| Images | The image inventory, by repository and tag |
| Vulnerabilities | Weaknesses found in those images |
| Compliance | Checks against container hardening benchmarks |
Images and tags
An image is identified by its repository and tag. The tag matters: payments/api:2.14.0
and payments/api:2.15.0 are different images with different findings.
This is why a fix appears as a new image rather than as the old one improving. The previous tag still contains the vulnerability — it is simply no longer the one you deploy.
Vulnerabilities versus compliance
The module reports two different kinds of problem, and they are worked differently:
- Vulnerabilities are known weaknesses in packages inside the image. Fixed by updating those packages and rebuilding.
- Compliance findings are configuration and hardening issues — running as root, no health check, an over-permissive setting. Fixed by changing how the image is built or run.
Both matter, but compliance findings are usually cheaper to fix and often apply uniformly across your estate.
Working effectively
- Start with collections rather than individual images — they group workloads the way your platform teams think about them.
- Prioritise images actually deployed to production. A scanned image nobody runs is a lower priority than a running one.
- Watch for the same finding across many images: that is a shared base-image problem and a single high-leverage fix.
Reading the Container Security screens
Container findings behave unlike anything else in NxSAM, because the thing they are attached to is immutable. Most of the confusion in this module traces back to that one fact.
A finding is attached to an image, and an image never changes
payments/api:2.14.0 is a fixed artefact. You cannot patch it — you build
payments/api:2.15.0 and deploy that instead.
So:
- A finding on
2.14.0stays open on2.14.0forever. It is not "unfixed"; the image it describes still contains the vulnerability, and always will. - The fix appears as a new image with fewer findings, not as the old one improving.
- "Why is this still open after we fixed it?" is answered by checking which tag is deployed, not by checking the finding.
The vulnerability columns
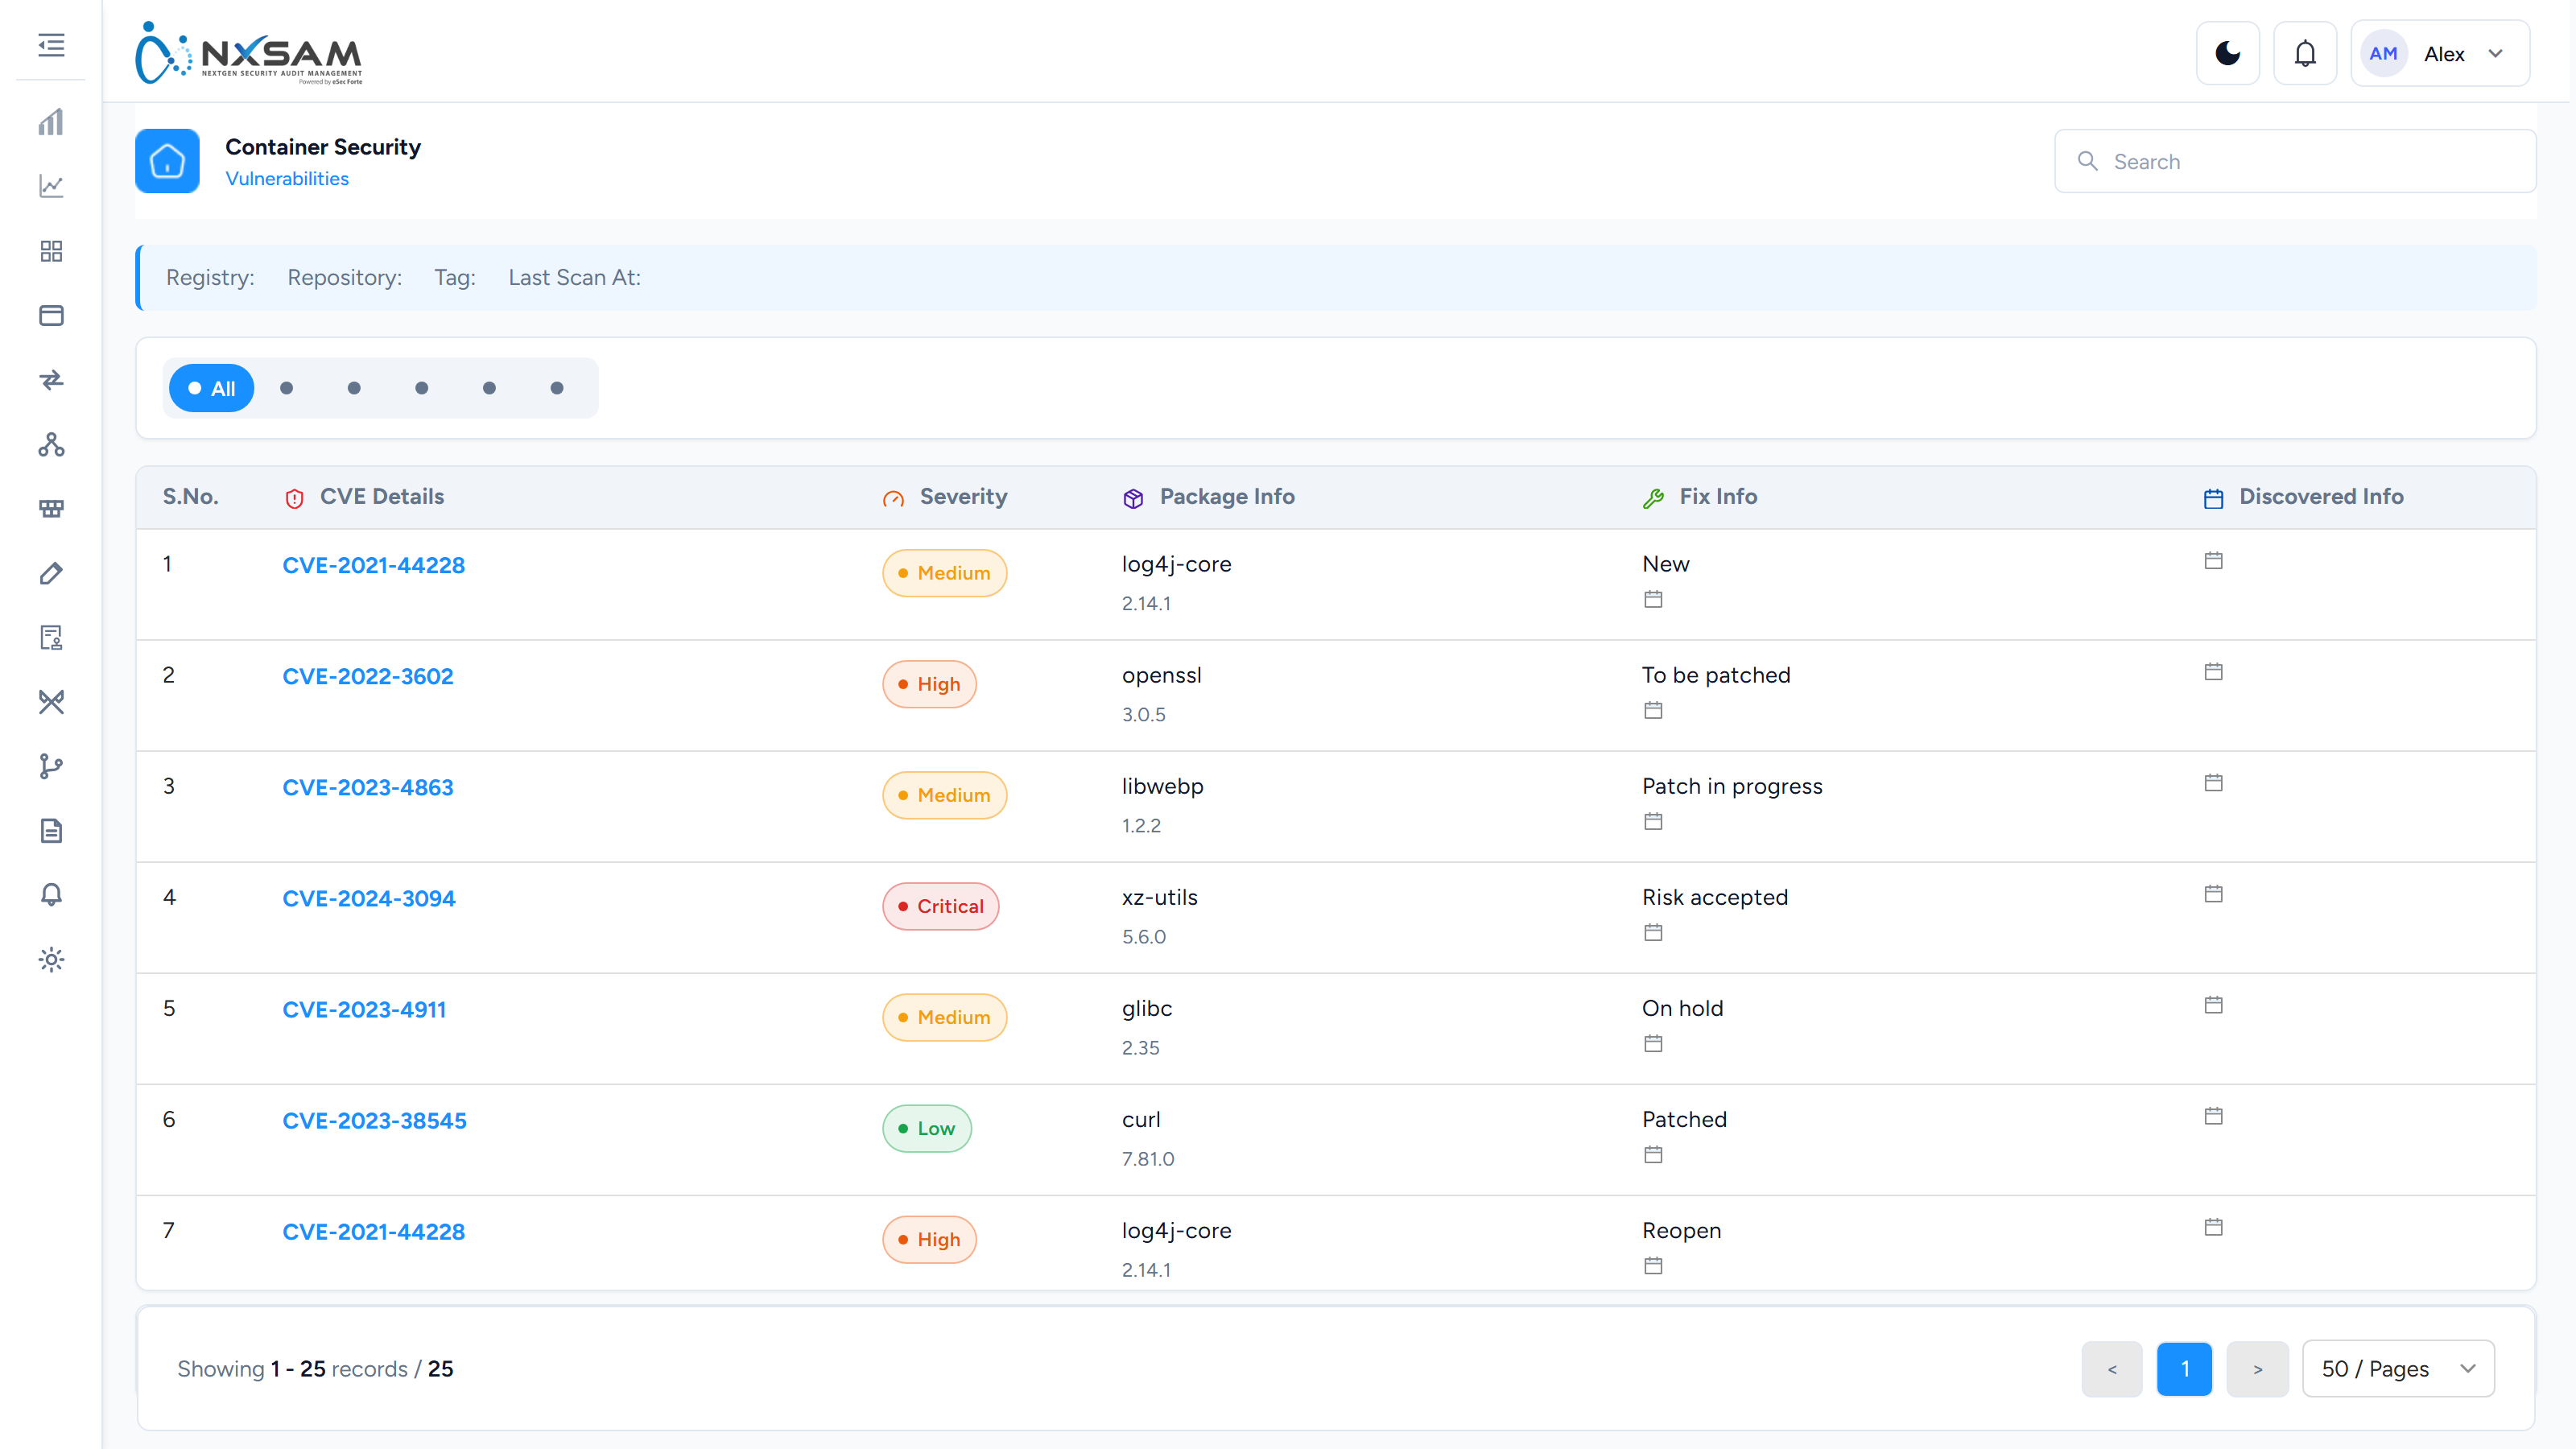
| Column | What it tells you |
|---|---|
| CVE | The advisory. Shared across every image containing the package |
| Registry / repository / tag | Which image. The tag is part of the identity |
| Package name and version | The actual cause. This is what you change to fix it |
| Collection | The workload grouping the image belongs to |
| Severity | From the scanner's advisory data |
| Vulnerability status | The working state of this finding |
| Master vulnerability status | The state of the underlying advisory across the estate |
| Vulnerability age | How long this has been known about |
| Discovered at / SLA expiry | When it was first seen here, and when it is due |
Two status columns again, meaning something different here
Status is this finding on this image. Master Status is the advisory itself, across every image it affects.
They diverge legitimately: a CVE can be triaged once at the master level — say, judged not applicable to your base images — while individual findings remain open until the images are rebuilt.
Package name is the column that matters
Severity ranks findings; package name groups them. Twenty Critical findings across twelve images are usually three packages, and updating three packages in the base image clears all twenty.
Sorting by package rather than severity is the single most useful habit in this module, and it is why the search screens exist:
- Container vulnerability search — findings across every image at once
- Container compliance search — the same for configuration checks
Both exist precisely because the per-image view hides the pattern.
Compliance is a different kind of finding
Vulnerabilities are weaknesses in packages inside the image. Compliance findings are how the image is built or run — running as root, no health check, a writable root filesystem, an over-permissive capability.
| Fixed by | |
|---|---|
| Vulnerability | Updating a package and rebuilding |
| Compliance | Changing the Dockerfile or the runtime configuration |
Compliance findings are usually cheaper to fix and apply uniformly, which makes them a good first pass on a new estate — one Dockerfile change can clear the same finding everywhere.
Collections
Images are grouped into collections, normally mirroring how the platform team organises workloads. Start here rather than with individual images: collections match how the people who will do the work think about their systems, and a finding assigned by collection reaches an owner who recognises it.
Why the counts move without a new scan
Same three causes as everywhere else, in the same order: SLA states changing with the date, a severity mapping edit re-classifying findings in bulk, or an image moving between collections and so between report scopes.
The container-specific fourth: a new tag was scanned. The old tag's findings did not go anywhere; a new set arrived alongside them. Totals rise even though the estate improved, because you are now tracking two images where you tracked one.
Retiring old tags is what stops that number growing forever, and nothing in the platform does it for you.
Container Security: every screen, column and action
Complements Reading the Container Security screens. This page names every column, including the secret-detection fields that are easy to miss.
Collections
| Column | What it holds |
|---|---|
| Collection Name / Description | The grouping, usually mirroring how the platform team organises workloads |
| Active Image Count | Images currently in it |
| Status | Whether the collection is in use |
| Owner | Who is responsible for the workloads in it |
Owner is what makes a container finding assignable. An image has no natural owner — it is built by a pipeline — so the collection carries the accountability.
Images
| Column | What it holds |
|---|---|
| Registry / Repository | Where the image lives |
| Tag | The version. Part of the identity, not a label on it |
| Vulnerability | Open package findings |
| Compliance | Open configuration findings |
| Last Scan Date | When the image was last evaluated |
| Collections | Which groupings it belongs to — an image can be in several |
| Status | Whether the image is active |
Row actions — four
| Action | What it does |
|---|---|
| View Vulnerabilities | Package findings for this image |
| View Compliance | Configuration findings for this image |
| Export Vulnerabilities | Downloads the vulnerability list |
| Export Compliance | Downloads the compliance list |
Vulnerabilities
| Column | What it holds |
|---|---|
| Registry / Repository | The image |
| CVE | The advisory |
| Severity | As the advisory rates it. The column header reads Serverity on both container tables — a spelling error in the product, not a different field (FINDINGS #16) |
| Package Info | The package and version that carries it — the actual cause |
| Fix Info | Whether a fixed version exists, and which |
| Discovered Info | When it was first seen here |
| SLA Overdue Status | Whether it has passed its deadline |
| Collection | The workload grouping, and therefore the owner |
| Status | The working state of this finding |
Fix Info decides whether a finding is actionable at all
A vulnerability with no fixed version cannot be resolved by rebuilding — the maintainer has not released one. Those findings need a compensating control or a documented acceptance, and treating them as a remediation backlog produces a queue that never moves.
Sorting by Fix Info separates "rebuild will fix this" from "nothing you build will".
Compliance
Configuration and hardening checks, plus secret detection.
| Column | What it holds |
|---|---|
| Registry / Repository | The image |
| Compliance Details | The check that failed |
| Category | What kind of check — hardening, configuration, secrets |
| Severity | As rated |
| Secret Path | The file a detected secret was found in |
| Secret Location In File | Where within that file |
| Discovered Info | When first seen |
| SLA Overdue Status | Past deadline or not |
| Collection | Workload grouping and owner |
| Status | Working state |
Secret Path and Secret Location are themselves sensitive
When a compliance finding is a detected credential, these two columns point directly at it. An exported compliance list therefore contains a map to live secrets in your images.
Treat those exports as sensitive material, and rotate the credential rather than only removing it from the image — it is in every previously built layer regardless.
Page-level exports
- Export Overall Vulnerabilities — every finding across every image
- Export Unique Vulnerabilities — each CVE once, however many images carry it
- Export Overall Compliance — every compliance finding
The unique export is the one to use for remediation planning. The overall export counts the same log4j advisory forty times across forty images; the unique export lists it once, which is the number of decisions that actually have to be made.
Per-image detail views
Opening an image shows its findings with a slightly different column set:
Vulnerabilities — CVE Details, Severity, Package Info, Fix Status,
Discovered Info.
Compliance — Compliance Details, Category, Severity, Title, Secret Path,
Secret Location In File, Created At.
Which images carry a finding
From a vulnerability or compliance finding you can see every image affected:
| Column | What it holds |
|---|---|
| Tag | The image version |
| First Scan At / Last Scan At | The window over which it has been present |
| Vulnerability Count / Compliance Count | How many findings that tag carries |
This is the view that shows a base-image problem for what it is. A CVE appearing against fourteen tags is one package to update, not fourteen tickets — and the first and last scan dates show whether newer tags have already resolved it.
Container Security: find the right screen
Every screen in this module, what each one is for, and where it lives. Use it to find the right screen quickly, and to confirm you are on the one a colleague means — several screens in this product have similar names and different jobs.
Screenshots come from a demonstration data set, so the figures are illustrative. Click any screenshot to open it at full resolution.
Container Collections
Logical groupings of images, usually mirroring how the platform team organises workloads.
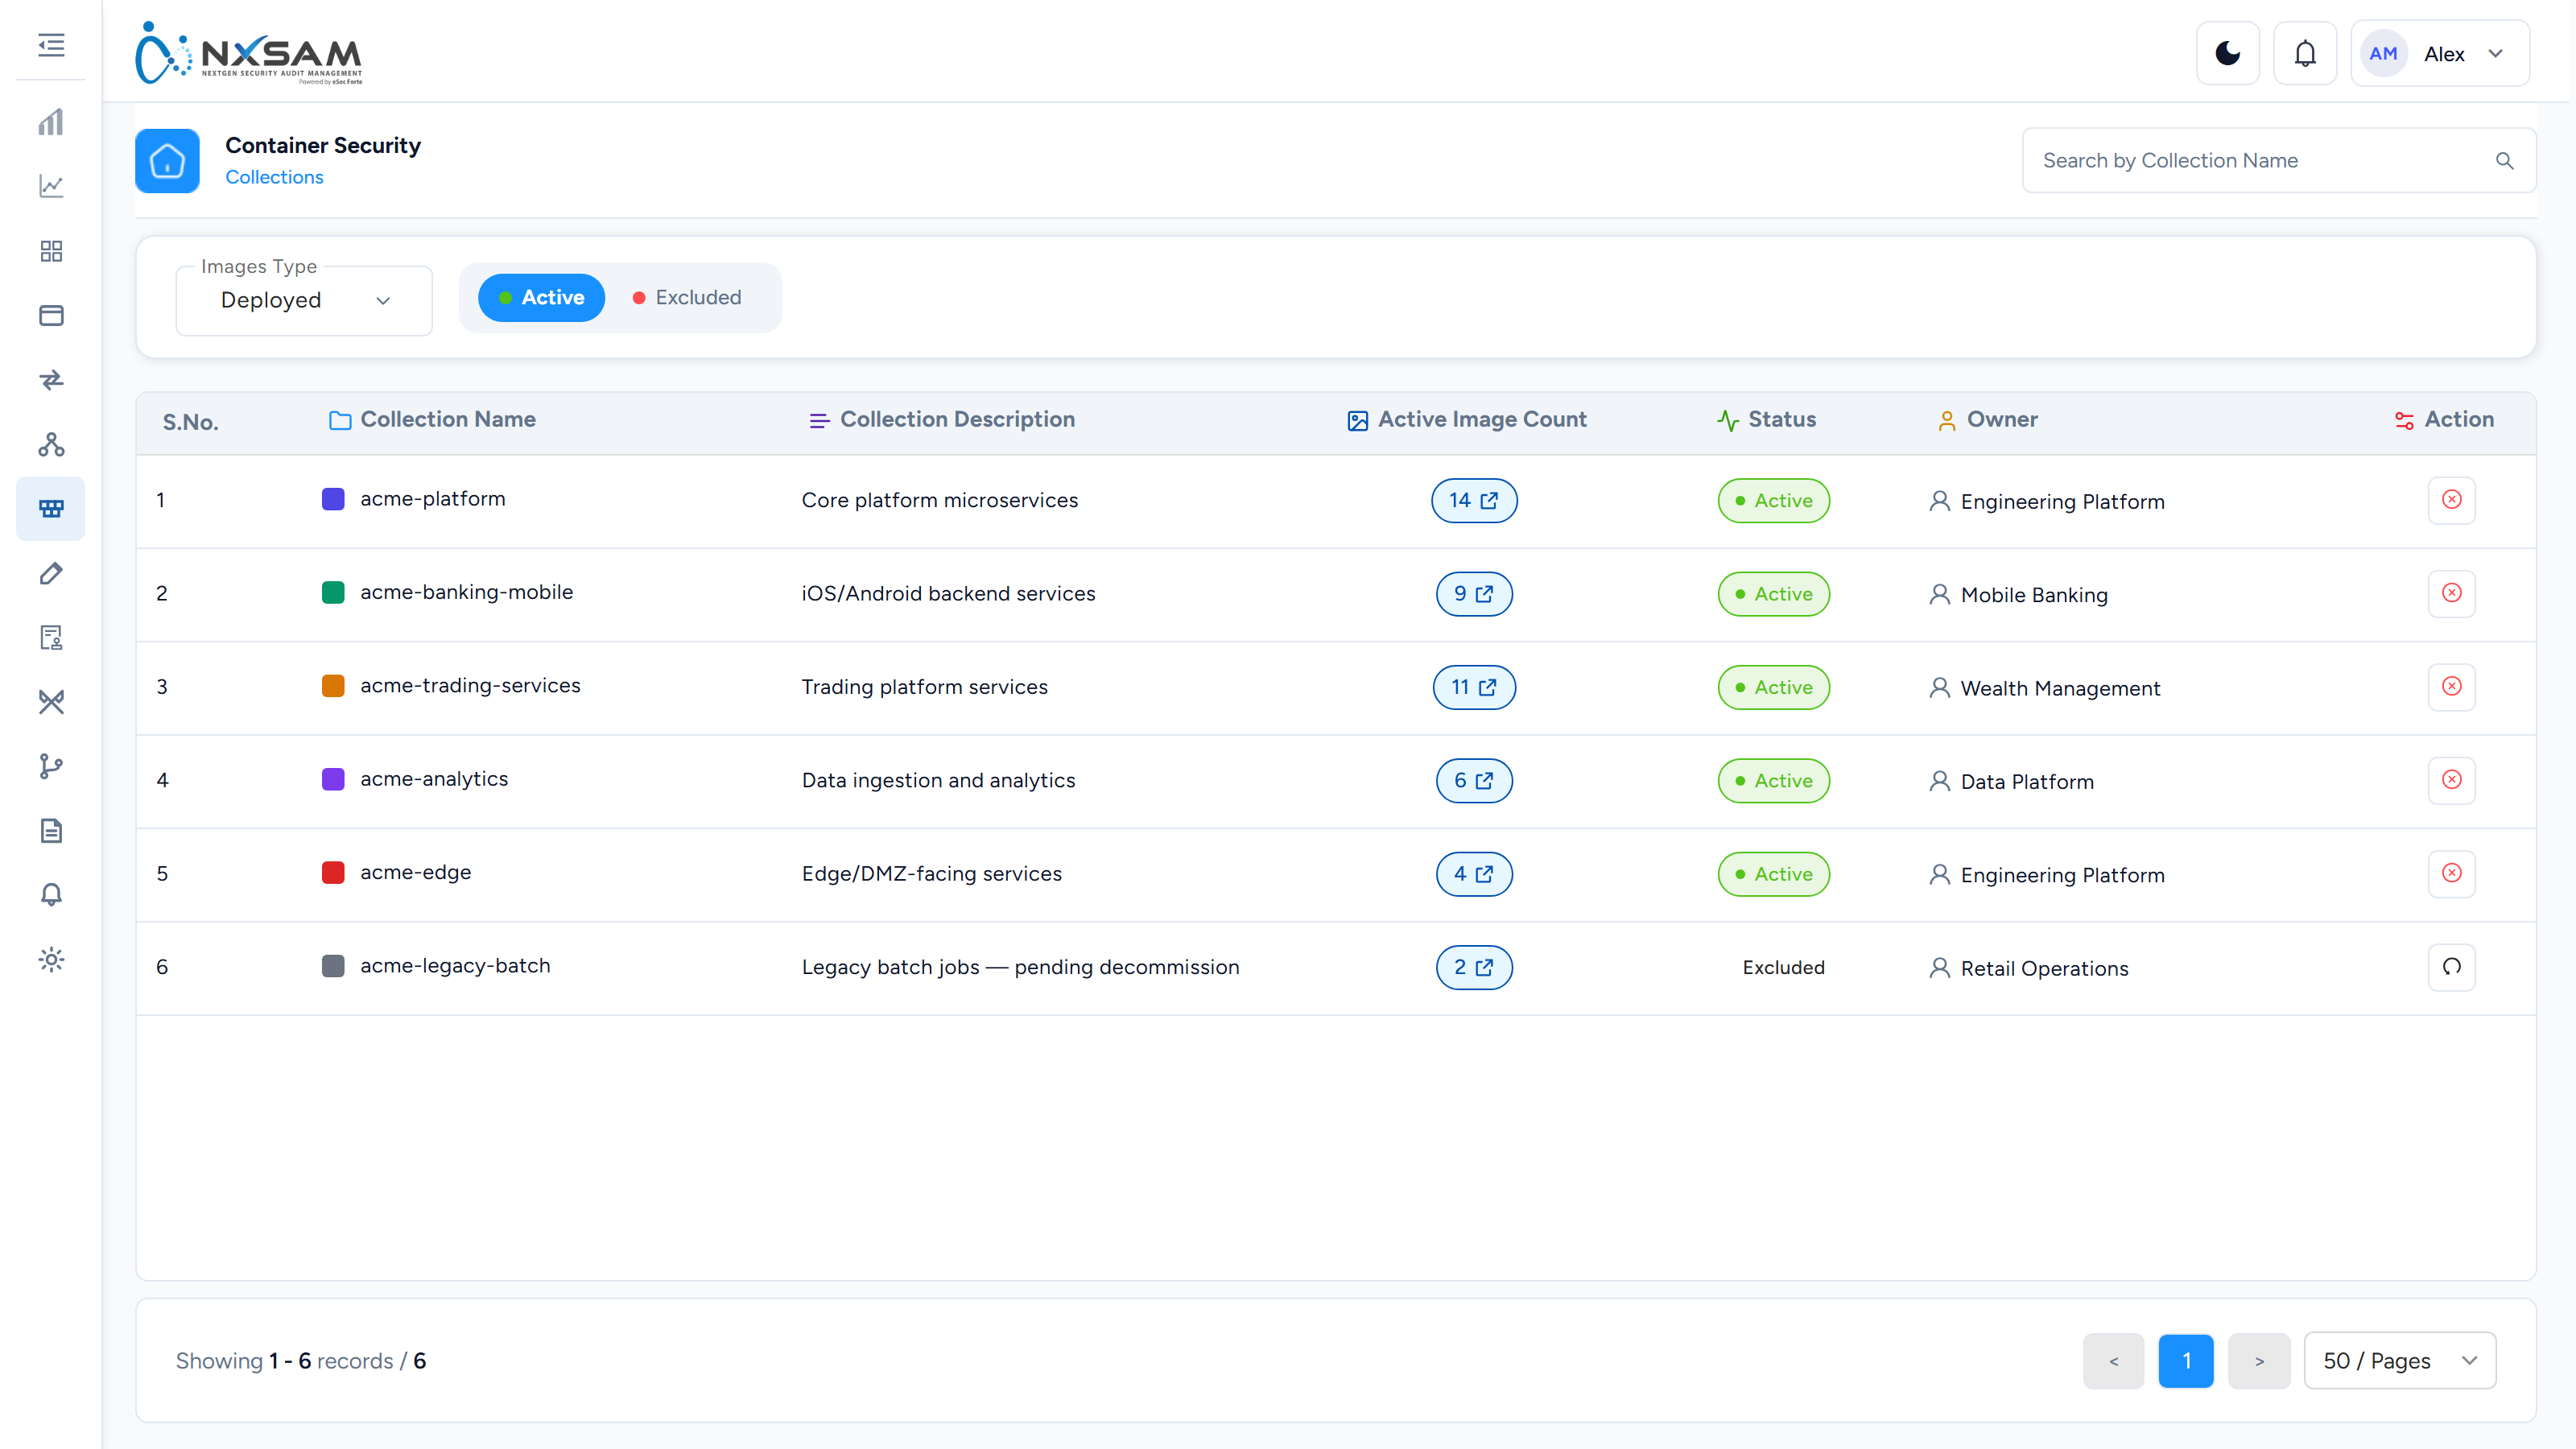
Container Compliance
Hardening and configuration checks against images, as distinct from package vulnerabilities.
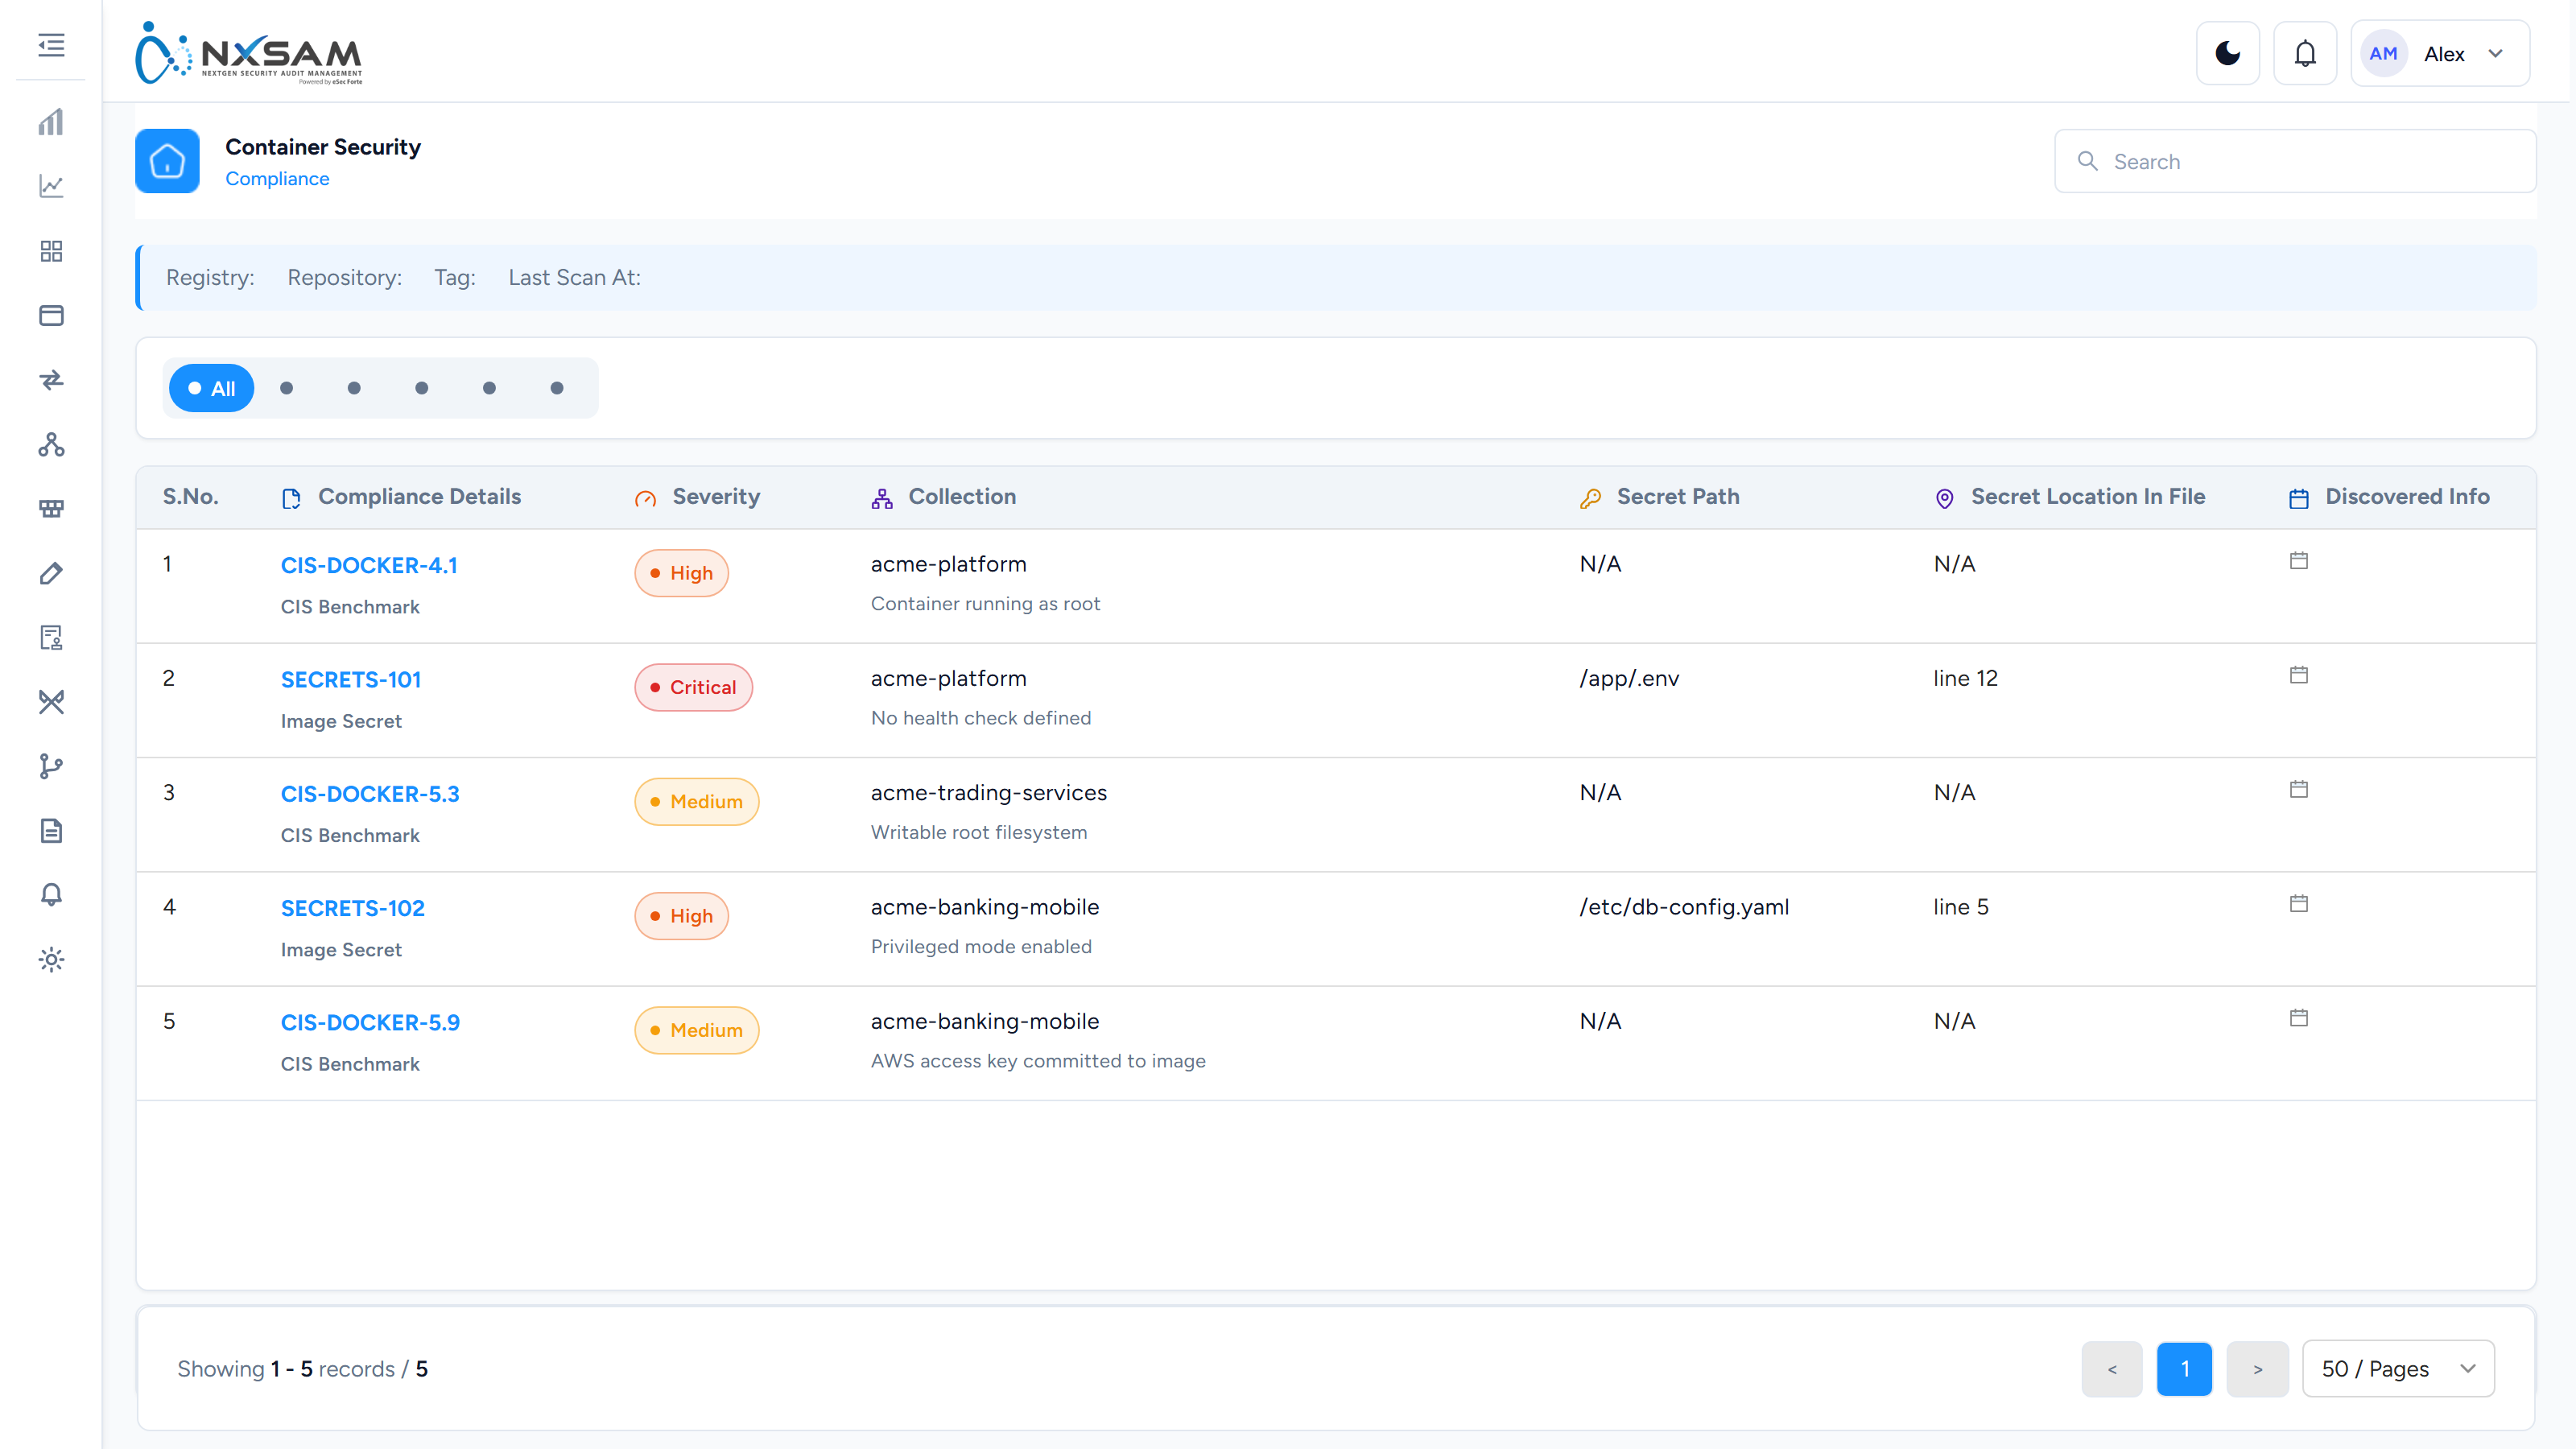
Container Compliance Search
Search compliance findings across all images, for spotting a setting wrong everywhere.
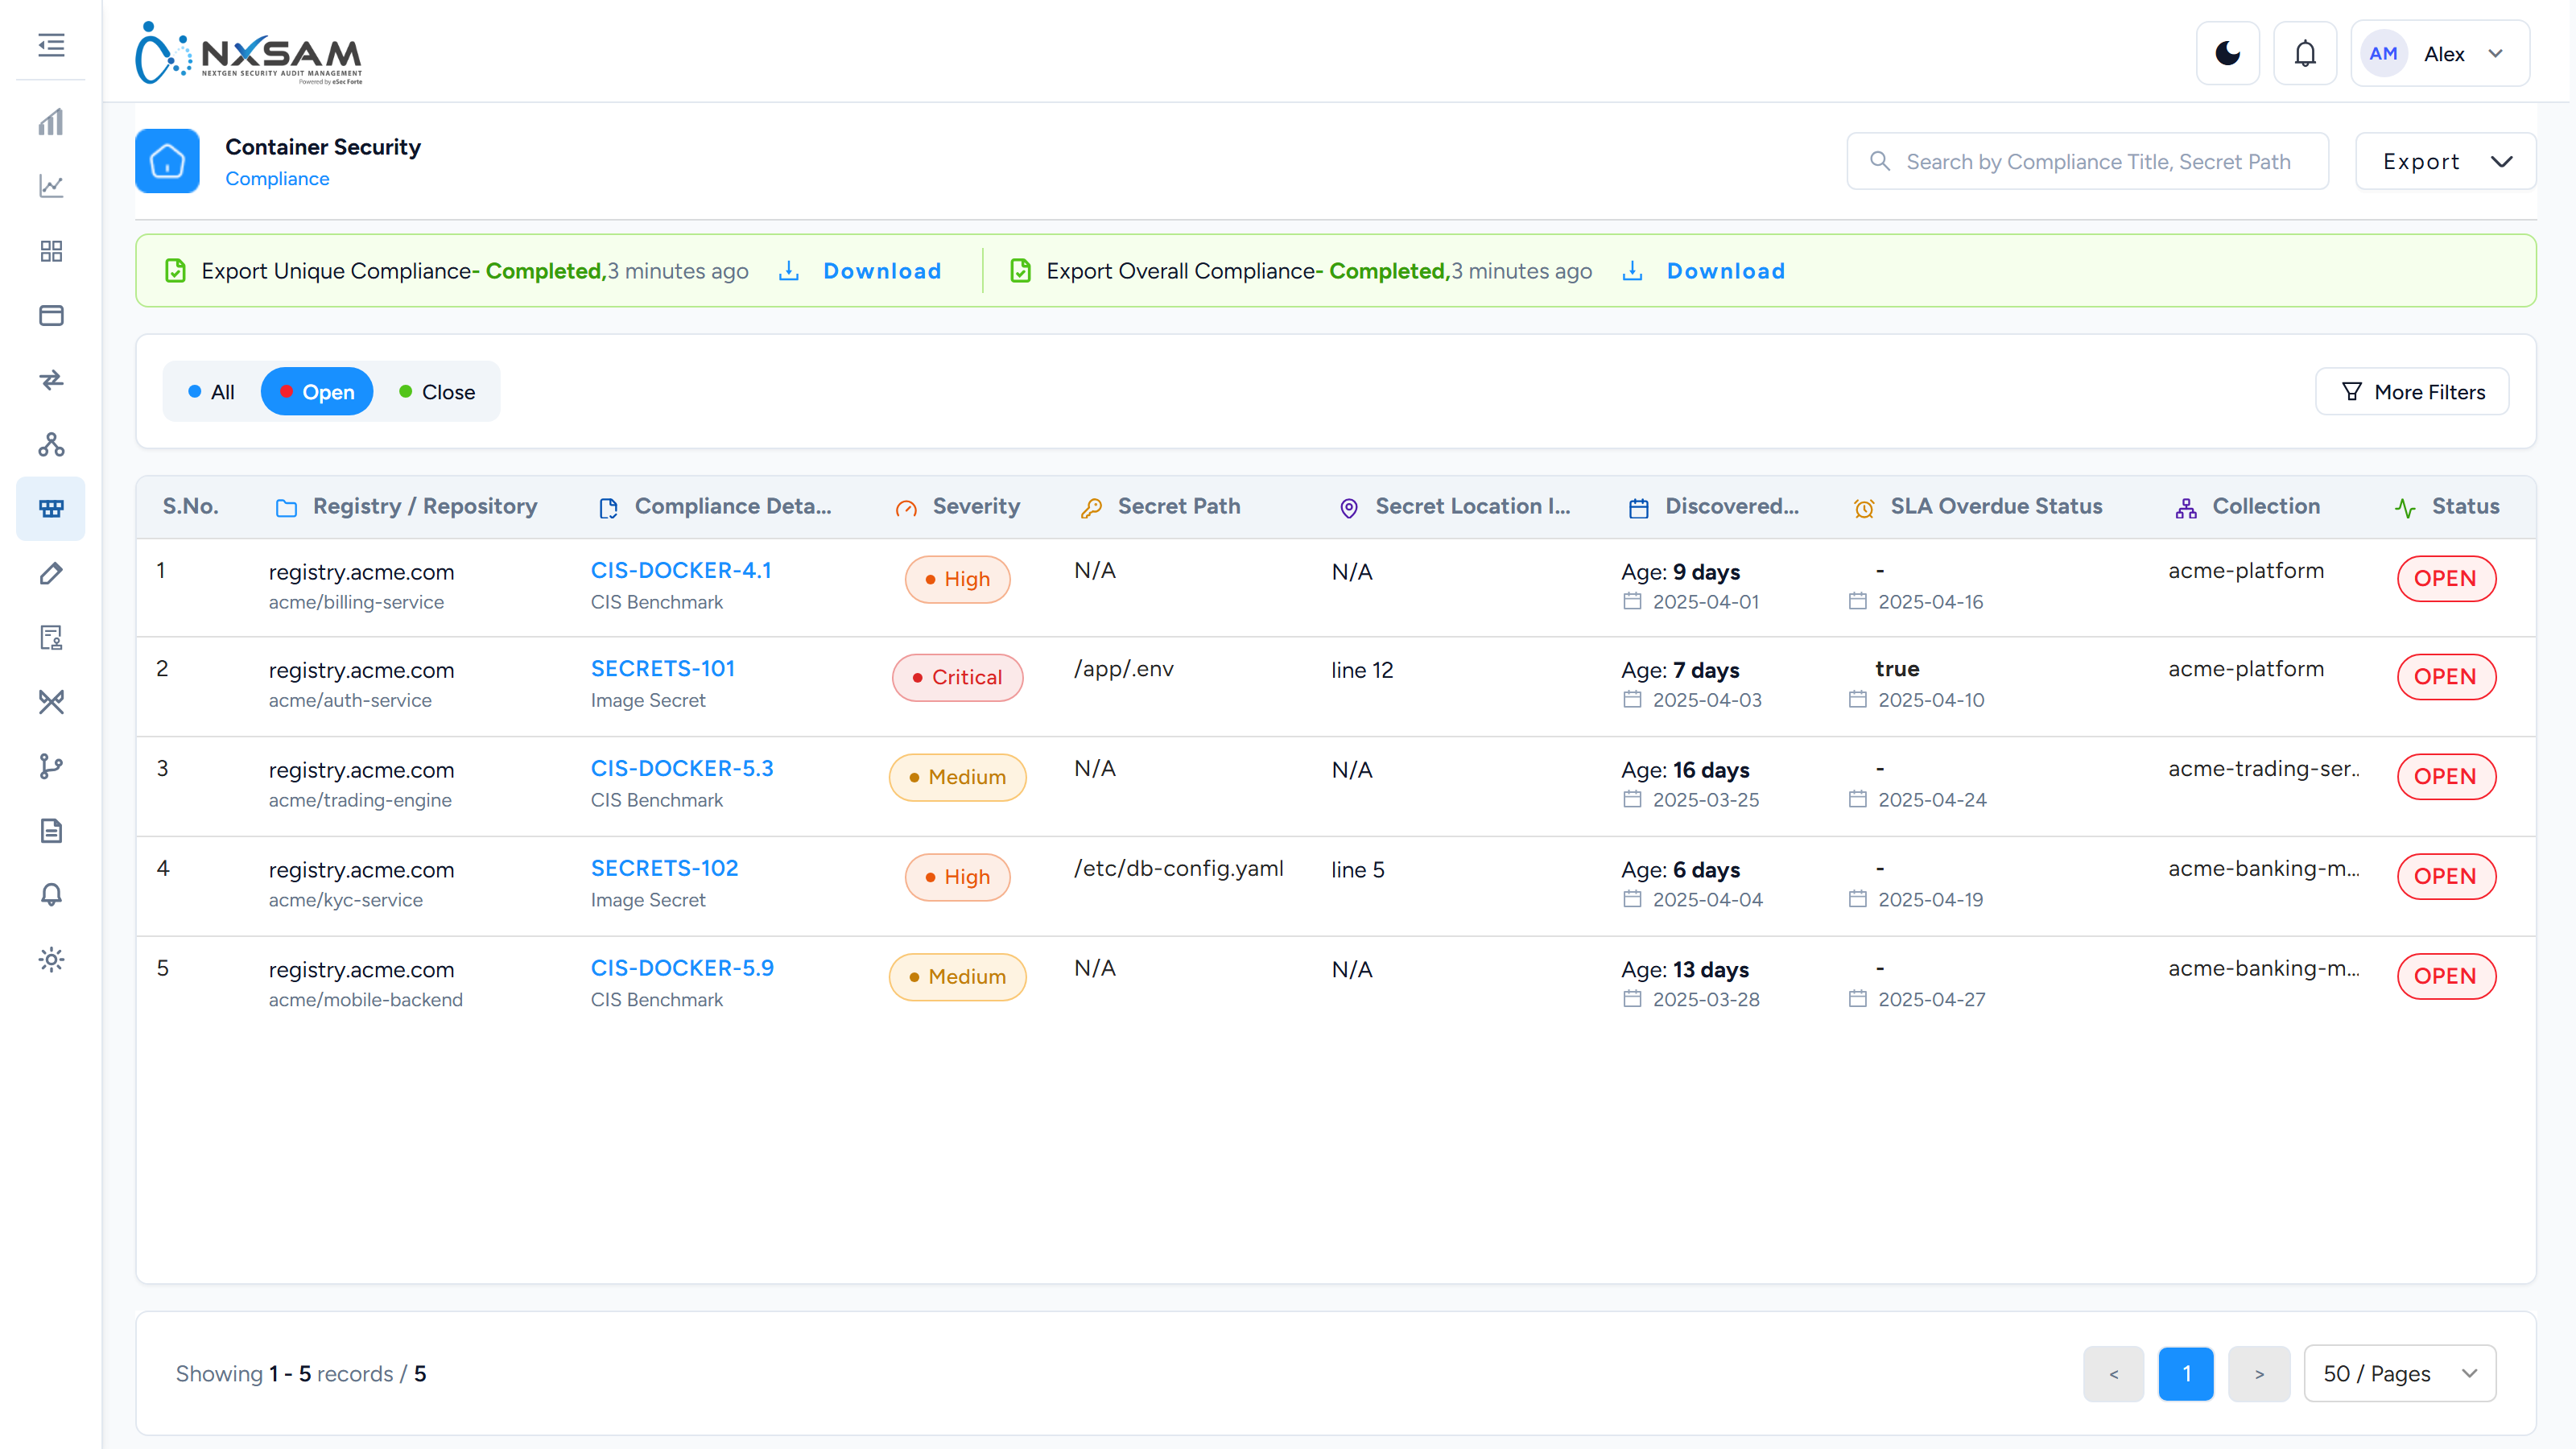
Container Images
The image inventory by repository and tag, with findings per image.
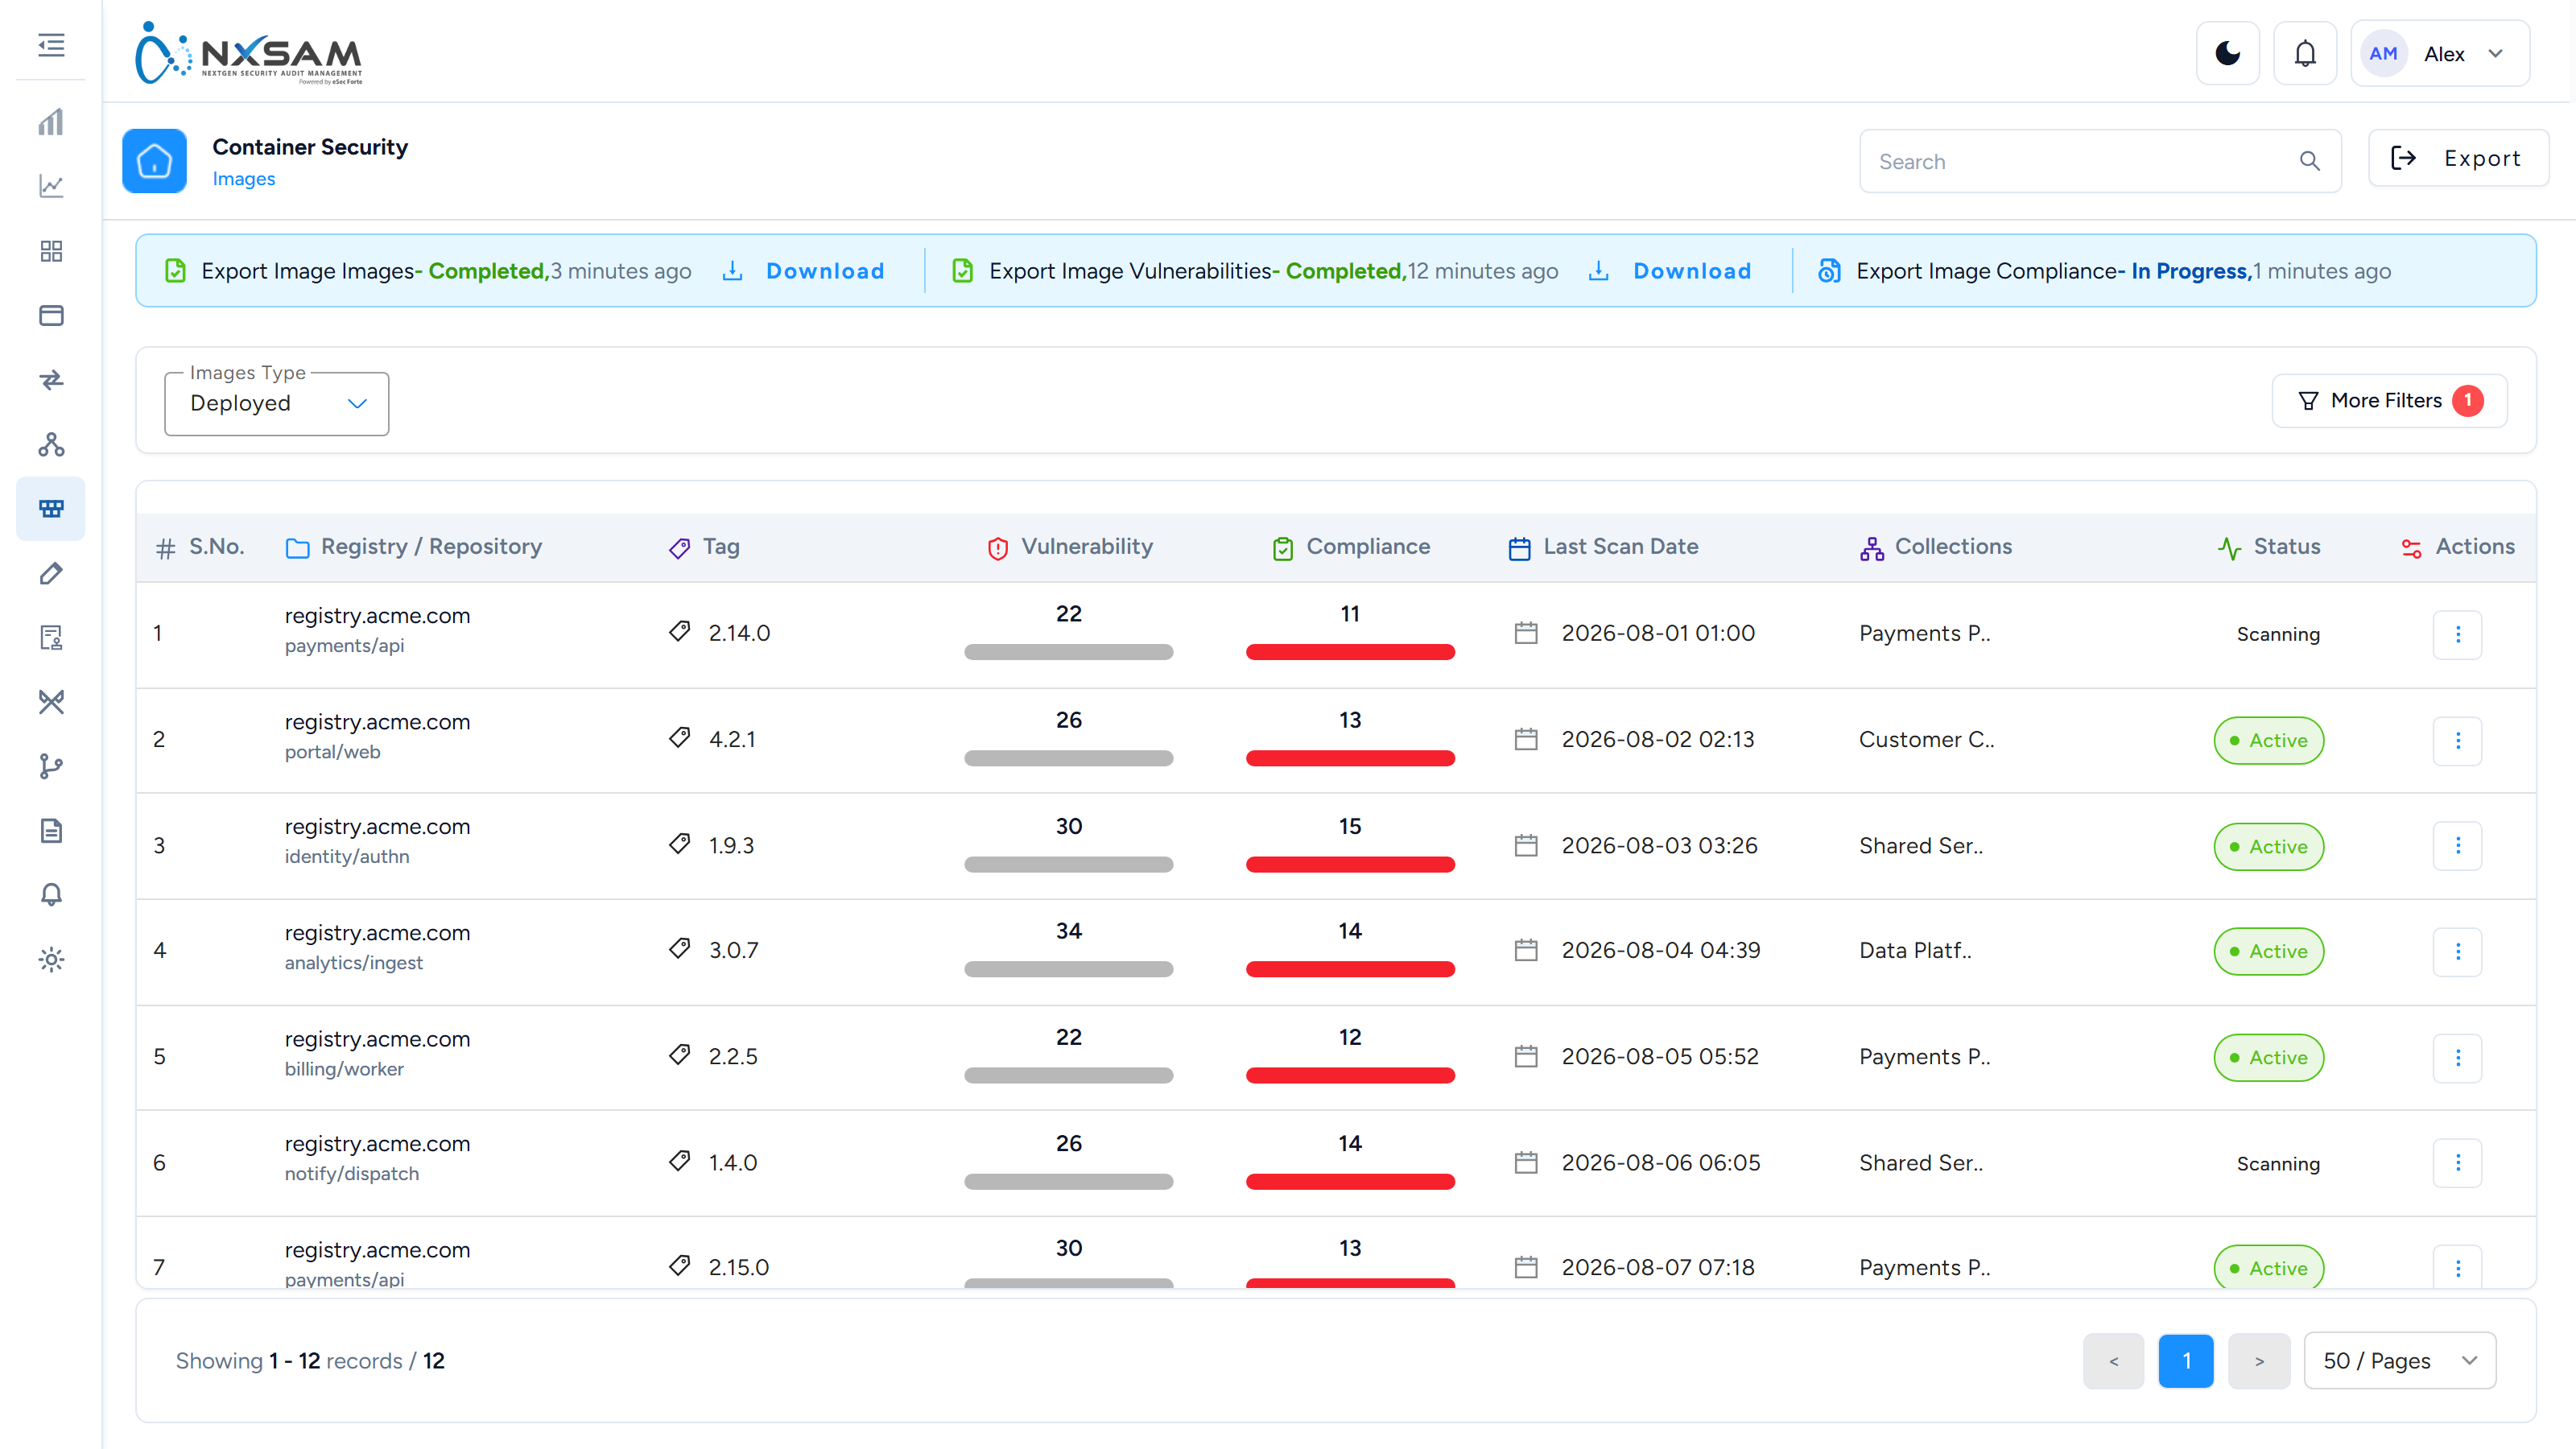
Container Vulnerability Search
Search findings across every image at once — the view that shows a shared base-image problem.
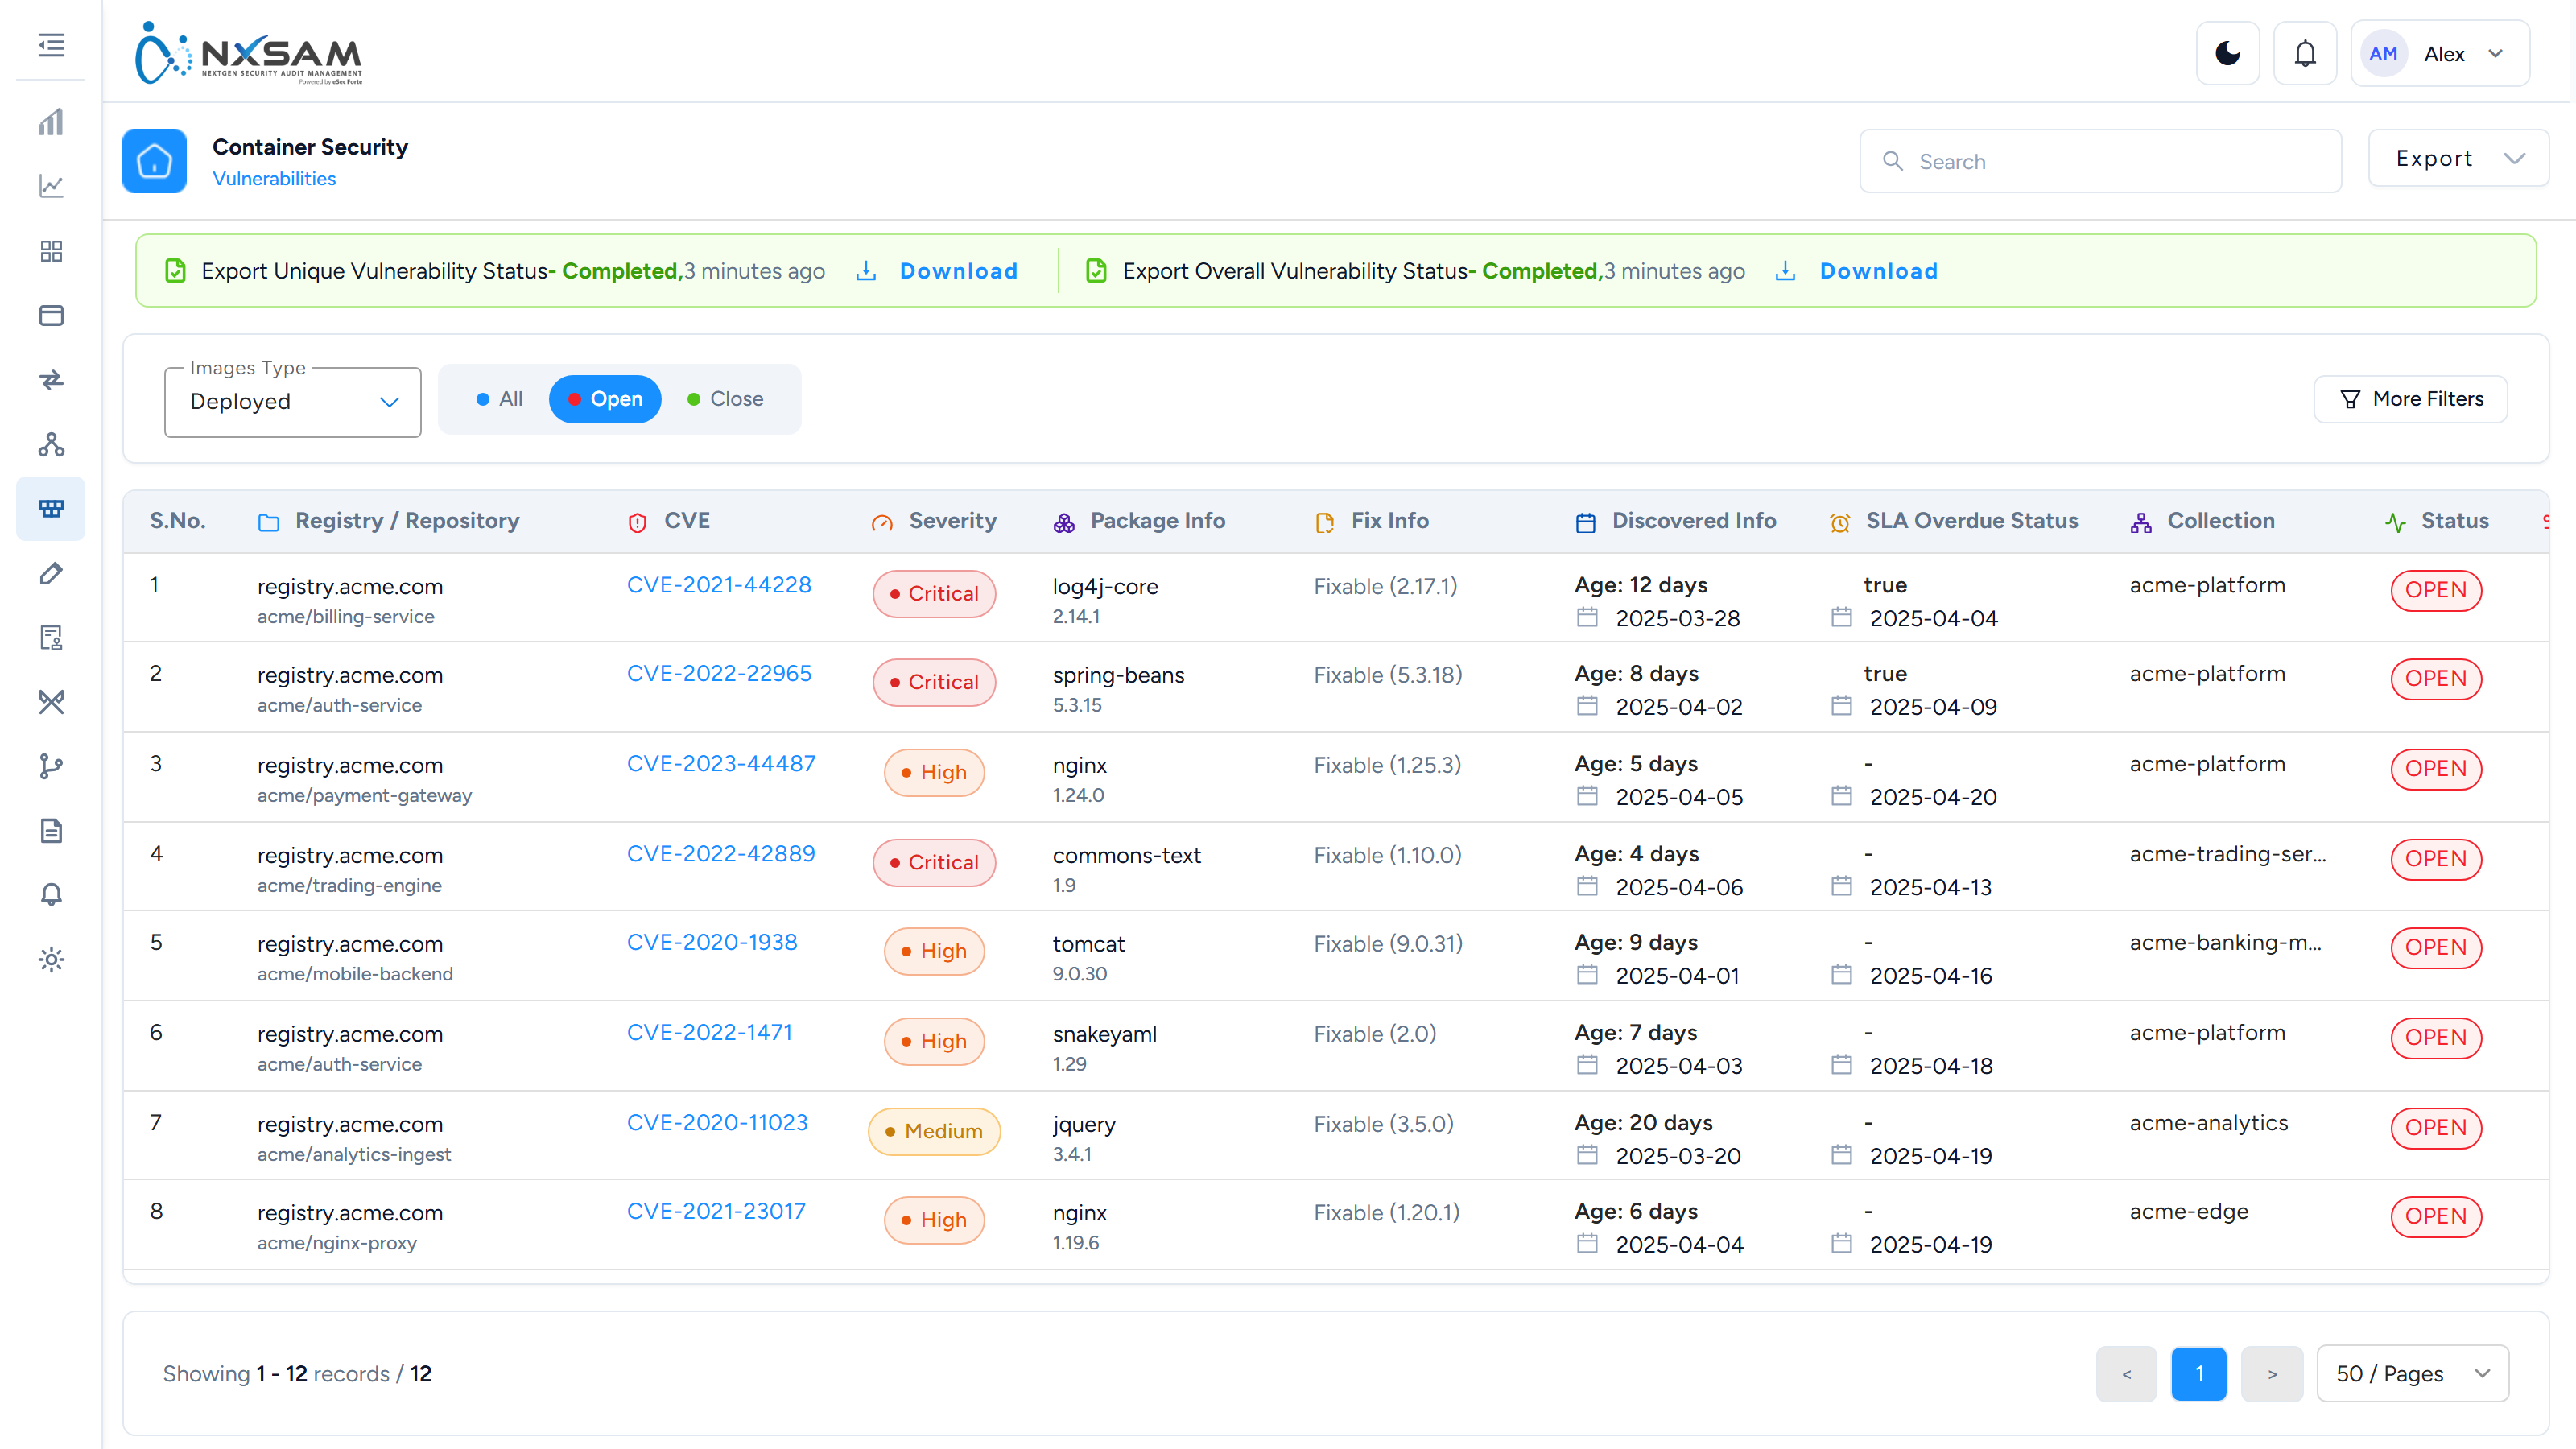
Container Security: support reference
Internal. The customer-facing explanation is in Reading the Container Security screens and the screen reference.
Container findings behave unlike anything else in NxSAM, because the thing being assessed is rebuilt rather than repaired.
The asset is immutable, so "fixed" means "replaced"
An image is not patched — a new image is built and the old one stops being deployed. Two consequences drive most tickets:
- A finding is not remediated on the image it was found on. It is absent from the next tag.
- The same weakness reappears on every image built from an unfixed base, so one base-image problem is reported many times over.
A customer asking why a finding "keeps coming back" usually has an unfixed base image, and the answer is the base rather than the finding.
Two statuses, meaning different things
| Column | Scope |
|---|---|
| Status | This finding on this image |
| Master Status | The advisory itself, across every image it affects |
They diverge legitimately. A CVE can be triaged once at master level — judged not applicable to your runtime, say — while individual images still carry it. Reading one as the other produces "we already closed this" disputes.
Vulnerabilities and compliance are separate halves
The module reports two different things about the same image:
- Vulnerabilities — packages with known advisories.
- Compliance — hardening and configuration checks, including secrets found in layers.
They have separate counts, separate screens and separate severities. A total that "doesn't add up" is often the two halves being summed.
The compliance half of the dashboard does not populate
A known product defect: the storage service assigns the whole response envelope where the component reads payload keys off it, so the compliance panels cannot bind whatever is served. The vulnerability half is unaffected. Recorded in FINDINGS.
Secret findings are sparse by design
Secret Path and Secret Location In File are populated only on secret-category compliance rows — roughly two in five. Empty cells on hardening rows are correct, not missing data.
Treat the finding detail itself as sensitive: a secret finding names a credential and where it lives, so it should not be pasted into a ticket.
Registry, repository and tag
An image is identified by all three. A caller naming only a repository is describing many images, and counts will not match whatever they are comparing against. Establish the tag before investigating a discrepancy.
Collections group images the way the scanning platform groups them, not the way NxSAM groups other assets, so collection membership comes from the source tool and is not editable here.
The sync queue
Image collection is queued. The queue records sync type, image type, status, initiated and completed times.
A run that is In Progress has no completed time — that blank is the state, not a fault. A run whose initiated-to-completed gap grows on every cycle is falling behind, and the image list is increasingly stale.
Prisma appears twice
Prisma Cloud is two separate integrations with separate credentials: one for container security, one for cloud posture. Connecting one does not populate the other, and "we already connected Prisma" is a frequent cause of an empty module.
What to collect before escalating
- Registry, repository and tag — all three.
- Whether the question is about the vulnerability half or the compliance half.
- Status and Master Status of the finding, quoted separately.
- The most recent sync queue entry, with its initiated and completed times.
- For "it came back": the base image, and whether a new tag has been built since.
Cloud Security (CSPM)
Cloud Security (CSPM)
Cloud Security Posture Management covers how your cloud accounts are configured — storage that is publicly readable, over-permissive roles, unencrypted databases, security groups open to the world.
Why cloud posture is its own problem
Cloud misconfigurations differ from other findings in three ways that change how you work with them:
They are created by anyone with access. A single console click can expose a storage bucket. There is no build or release to catch it.
They are immediately exploitable. A publicly readable bucket is not a weakness someone might exploit — it is already accessible to anyone who finds it.
They drift constantly. Cloud estates change daily, so posture is a moving picture rather than a periodic assessment.
What the module holds
Cloud posture reaches NxSAM from more than one platform, and the module has a set of screens for each, because the platforms describe posture differently.
Prisma CSPM — four screens, fed by Prisma Cloud:
| Screen | Shows |
|---|---|
| Asset Inventory | The cloud resources discovered in your accounts |
| Alerts | Resources currently violating a policy |
| Compliance | How your cloud estate measures against frameworks |
| Policies | The rules being evaluated |
CSPM — five screens, fed by Cortex CSPM and SentinelOne CSPM:
| Screen | Shows |
|---|---|
| Assets | The cloud resources discovered, with their open issues and cases |
| Issues | Individual findings — one rule failing against one or more assets |
| Cases | Issues grouped into a single piece of work, with a severity of their own |
| Rules | The individual checks that raise issues |
| Policies | Named groups of rules, and whether each group is switched on |
The two sets do not merge. A resource that both platforms see appears once under each, and the counts on one set say nothing about the other.
Rules, issues and cases
The CSPM screens use three words that are easy to run together, and the module is much easier to read once they are kept apart:
- A rule is a single check — "storage must not be publicly readable".
- An issue is that rule failing against a resource. One rule can raise many issues; the issue row says how many assets it touches.
- A case collects related issues into one thing to work on, and carries its own severity and status. Fixing a case is fixing every issue in it.
Every row on those three screens links sideways — an asset to its issues, an issue to its case and its rule, a rule to its issues, a policy to its rules — so you can start from whichever you were asked about and reach the others without searching.
Alerts, not vulnerabilities
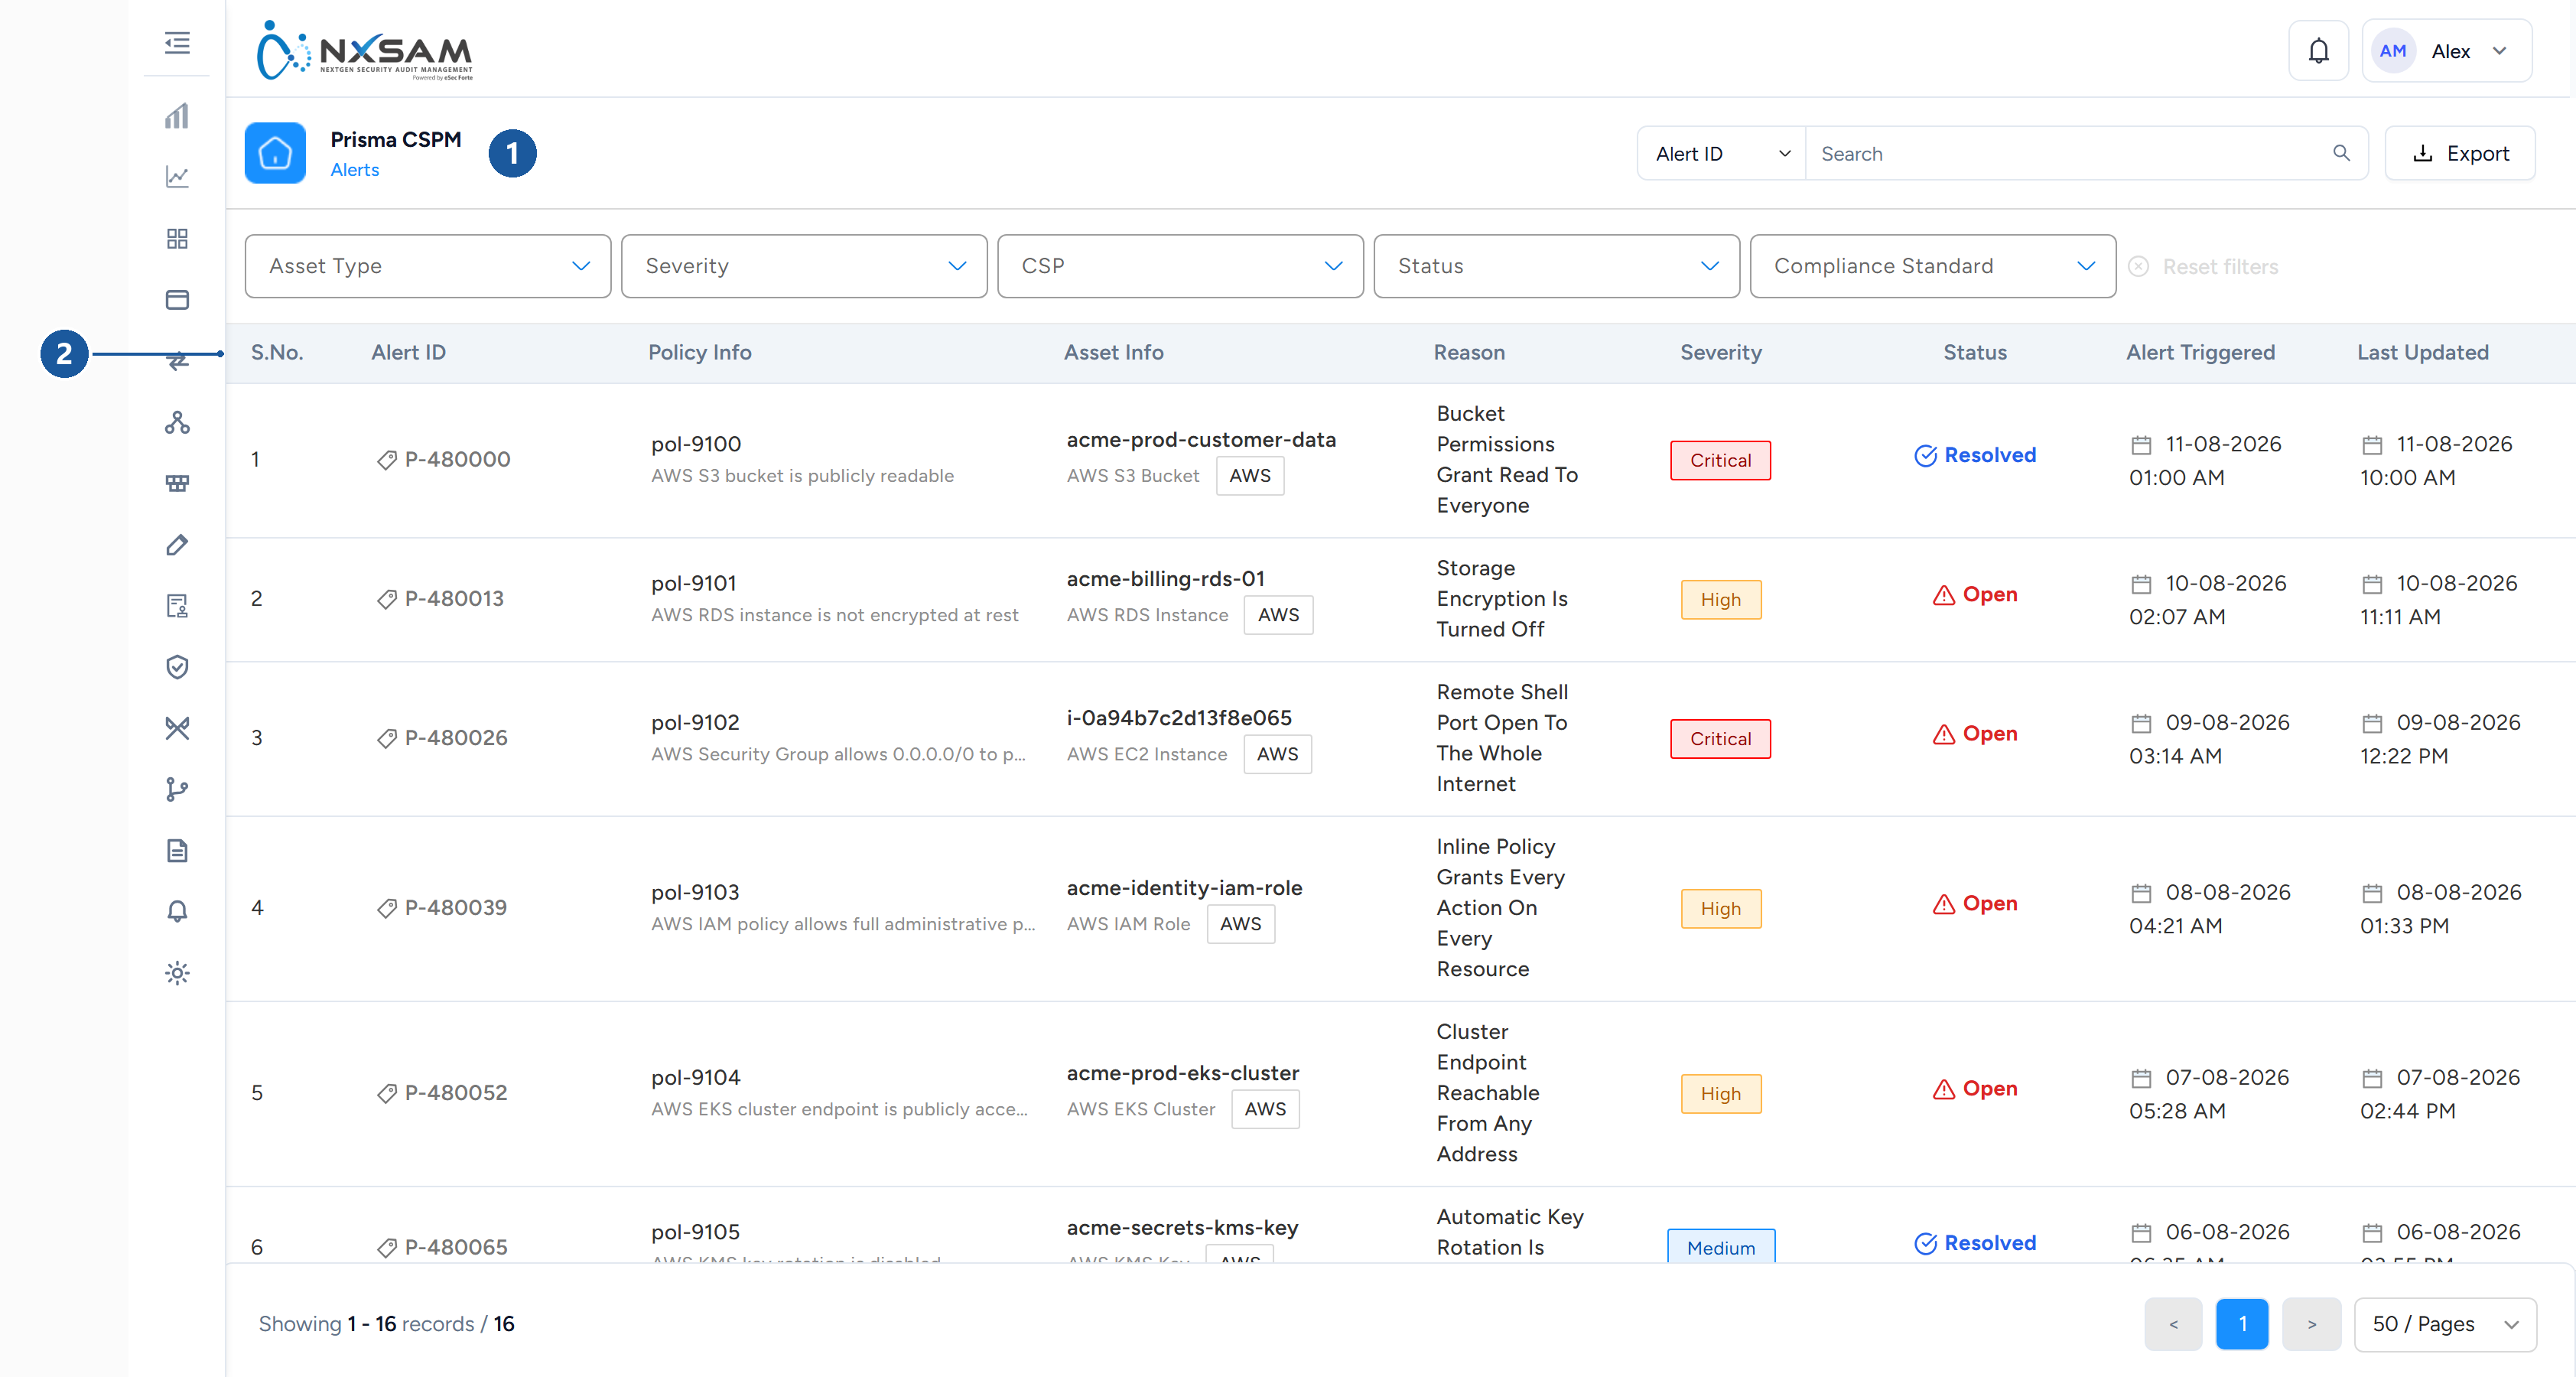
1 where you are · 2 policy, asset and account
A CSPM alert says a resource is currently in a state a policy forbids. That is a statement about now — fix the configuration and the alert clears on the next evaluation.
This differs from a vulnerability, which describes a flaw that persists until patched. It is why cloud alert counts move far more than vulnerability counts, and why a spike is often one change affecting many resources rather than a genuine deterioration.
Reading alerts well
- Public exposure first. Anything reachable from the internet outranks internal misconfigurations regardless of the severity label.
- Identity and access next. Over-permissive roles are the route from a small foothold to a large incident.
- Look for patterns. The same misconfiguration across many resources usually means a template, module or provisioning pipeline is producing it. Fix the source and the resources follow.
Fix the pattern, not the resource
Correcting fifty individually misconfigured buckets achieves nothing durable if the template that created them is unchanged — the next fifty arrive the same way.
Compliance view
The compliance screens map cloud configuration against frameworks, which is what makes cloud posture reportable to an auditor rather than only to engineers.
As with policy compliance, read the failures rather than the percentage: a high score can coexist with a small number of severe exposures.
Cloud Security (CSPM): every screen and column
Two families of screens, and no row actions on either — CSPM is a reporting surface rather than a working queue, because the remediation happens in the cloud provider rather than here.
- Prisma CSPM — Asset Inventory, Alerts, Compliance Standards and Policies, fed by Prisma Cloud. Described first, below.
- CSPM — Assets, Issues, Cases, Rules and Policies, fed by Cortex CSPM and SentinelOne CSPM. Described from CSPM: Assets onwards.
The two families do not share data. A resource both platforms see appears once in each, and the two Policies screens are different lists with the same name.
Asset Inventory
Everything the posture tool discovered across your cloud accounts.
| Column | What it holds |
|---|---|
| Asset details | The resource name and its provider identifier |
| Asset Type | S3 bucket, EC2 instance, SQL database, storage account, and so on |
| CSP Details | Which cloud, which account, which region |
| Status | Whether the resource is currently present |
| Alerts Distribution | Open alerts against it, split by severity |
| Total Policies | How many checks apply to this resource type |
| Last Scanned Date | When posture was last evaluated |
Total Policies is the column that explains an empty alert count. A resource with two applicable policies and no alerts is genuinely clean; one with forty and no alerts has probably not been evaluated yet — check Last Scanned Date before concluding it is compliant.
Alerts
The findings. One row is one policy failing against one resource.
| Column | What it holds |
|---|---|
| Alert ID | The provider's identifier, for cross-referencing in their console |
| Policy Info | Which check failed |
| Asset Info | Which resource, in which account |
| Reason | Why it failed — the actual configuration found |
| Severity | As the policy defines it |
| Status | Open or resolved |
| Alert Triggered | When it first fired |
| Last Updated | When it last changed |
Reason is the column people skip and should not. Two resources failing the same policy often fail it for different reasons — one bucket is public to everyone, another is public to a single partner account — and the remediation differs accordingly.
Alert Triggered against Last Updated tells you whether an alert is stable or flapping. An alert triggered months ago and updated yesterday is being re-evaluated and still failing; one triggered and updated at the same moment has fired once.
Compliance Standards
Which benchmarks posture is measured against.
| Column | What it holds |
|---|---|
| Standard Name | CIS AWS Foundations, PCI DSS, ISO 27001, and so on |
| Standard Description | What the standard covers |
| Mapped Policies | How many individual checks make it up |
| Enabled | Whether it is switched on |
Enabling a standard does not run anything
Standards select which policies count towards a compliance figure. The policies themselves evaluate regardless. Turning a standard on therefore changes the reported percentage immediately, with no scan involved — which surprises people who expect a delay.
Policies
The individual checks behind the standards.
| Column | What it holds |
|---|---|
| Policy Details | The check and what it looks for |
| CSP | Which cloud it applies to |
| Severity | What an alert from it is rated |
| Status | Whether the policy is active |
| Alerts | How many are currently open against it |
| Auto-Fix | Whether the provider can remediate it automatically |
| Last Evaluated | When it last ran |
| Created | When the policy was defined |
Auto-Fix is the most actionable column in the module. A policy marked auto-fixable can be remediated by the cloud provider without a change request — so a list of high-alert auto-fixable policies is usually the fastest available posture improvement.
It is also worth checking before escalating: an alert on an auto-fixable policy that keeps returning usually means auto-fix is available but not enabled, rather than that the fix is not working.
CSPM: Assets
The cloud resources the posture platform has discovered, with what is currently wrong with each. Rows are the resource; the two count columns are doors into the other screens.
| Column | What it holds |
|---|---|
| Asset Details | The resource name, and the identifier the platform knows it by |
| Asset Type | The kind of resource — a bucket, an instance, a database, a role |
| Provider | Which cloud it lives in |
| Issues → | Open issues against it, by severity. The arrow opens the Issues screen filtered to this asset |
| Cases → | Cases that include it, by severity. The arrow opens the Cases screen filtered to this asset |
| Last Observed | When the platform last saw the resource |
The severity chips above the table — Critical, High, Medium, Low — filter the list to assets carrying an issue of that severity. Asset Type and Provider are the quick filters; More Filters opens the full set, and Reset Filters clears everything at once. Export downloads the current list as shown.
Clicking the asset name opens Asset Details: the provider and its own identifier, the realm and region, the type as a category, class and name, when the resource was first and last observed, and the issues and cases against it broken down by severity.
Last Observed is what tells you whether a clean asset is clean. A resource with no issues and a Last Observed date from last night has been checked and passed. One with no issues and a Last Observed date from three weeks ago has stopped being seen — it may have been deleted, or the account it lives in may have stopped syncing — and its empty issue count is not evidence of anything.
CSPM: Issues
The findings. One row is one rule failing against one or more assets.
| Column | What it holds |
|---|---|
| Issue name | What was found, and the platform's identifier for it |
| Severity | As the rule rates it |
| Domain / Type | The area of posture the issue belongs to, and the kind of issue it is |
| Detection Method | How the platform found it |
| Status | Where the issue is in its lifecycle |
| Asset Count | How many resources this one issue touches |
| Case ID | The case the issue has been grouped into. Opens the Cases screen on that case |
| Rule ID | The rule that raised it. Opens the Rules screen on that rule |
Quick filters: Severity and Status. More Filters adds domain, category and detection method. Export and Reset Filters behave as on Assets.
Clicking the issue name opens Issue Details: the issue's identifier and name, its domain, detection method, asset count, the case and rule it belongs to, and when it was last updated.
Asset Count is the column to sort by when deciding what to fix first. An issue on one asset is one change. An issue on two hundred assets is almost always a template, a module or a provisioning pipeline producing the same misconfiguration repeatedly, and fixing the source clears all two hundred at once — while fixing the resources one at a time clears nothing durably.
CSPM: Cases
Issues grouped into one piece of work. A case is what gets assigned, tracked and closed; the issues inside it are the evidence.
| Column | What it holds |
|---|---|
| Case name | What the case is about, and its identifier |
| Severity | The case's own rating, which is not necessarily the highest issue in it |
| Status | Where the case is |
| Domain | The area of posture it covers |
| Issues → | The open issues in it, by severity. The arrow opens the Issues screen filtered to this case |
| Modified | When the case last changed |
The severity chips filter cases by their own severity. Quick filters: Domain, Severity, Status. Export and Reset Filters as elsewhere.
Clicking the case name opens Case Details: identifier and name, domain, when it was created and last modified, and its issues broken down by severity.
A case's severity is set by the platform, not summed from its issues
A case rated High can contain a Critical issue, and a case rated Critical can contain only Medium ones — the platform rates the case on what the combination means, not on the worst member. When the two disagree, the case rating is the one the platform intends you to act on.
CSPM: Rules
The individual checks. Every issue on the Issues screen was raised by one of these.
| Column | What it holds |
|---|---|
| Rule name | What the rule checks, and its identifier |
| Severity | What an issue from it is rated |
| Type | The kind of rule |
| Providers | Which clouds it applies to |
| Status | Whether the rule is enabled |
| Issues Count | Open issues it has raised. Opens the Issues screen filtered to this rule |
| Updated | When the rule definition last changed |
Quick filters: Provider, Rule Class, Severity, Type; More Filters for the rest. Clicking the rule name opens Rule Details: identifier, name, class, type, providers, issue count, and when the rule was created and last modified.
A disabled rule with a non-zero issue count is a rule that used to run. Its issues are historical — nothing is re-evaluating them — and they will neither clear nor grow. Either re-enable the rule in the platform or treat those issues as closed; leaving them counted as open inflates every total above them.
CSPM: Policies
Named groups of rules, as configured in the posture platform. A policy is how the platform decides which rules run where, so this screen explains why a rule that exists is or is not producing issues.
| Column | What it holds |
|---|---|
| Policy name | The group, and its identifier |
| Mode | How the platform applies the policy, as set in the platform |
| Rule Matching | How the policy selects its rules, as set in the platform |
| Labels | The platform's tags on the policy |
| Status | Whether the policy is enabled |
| Rules Count | How many rules it contains. Opens the Rules screen filtered to this policy |
Quick filters: Mode, Rule Matching, Status. Clicking the policy name opens Policy Details: identifier, name, description, mode, rule matching, status, rule count, and when it was created and last updated.
Mode and Rule Matching are the platform's own settings, shown here so you can read them without opening the platform. NxSAM does not change them.
Why there are no row actions
Everything here is evidence about a cloud account that NxSAM reads and does not control. Remediation happens in the provider's console or in the infrastructure code that produced the resource. The module's job is to say what is wrong, where, and how it compares to the standard you are being measured against — not to change it.
The CSPM screens add the sideways links — asset to issues, issue to case and rule, rule to issues, policy to rules — which is a way of reading the evidence rather than acting on it. Nothing on any of the nine screens writes back to a cloud account.
Cloud Security (CSPM): find the right screen
Every screen in this module, what each one is for, and where it lives. Use it to find the right screen quickly, and to confirm you are on the one a colleague means — several screens in this product have similar names and different jobs.
Screenshots come from a demonstration data set, so the figures are illustrative. Click any screenshot to open it at full resolution.
CSPM Asset Inventory
Cloud resources discovered across accounts and regions, with how many policies apply to each.
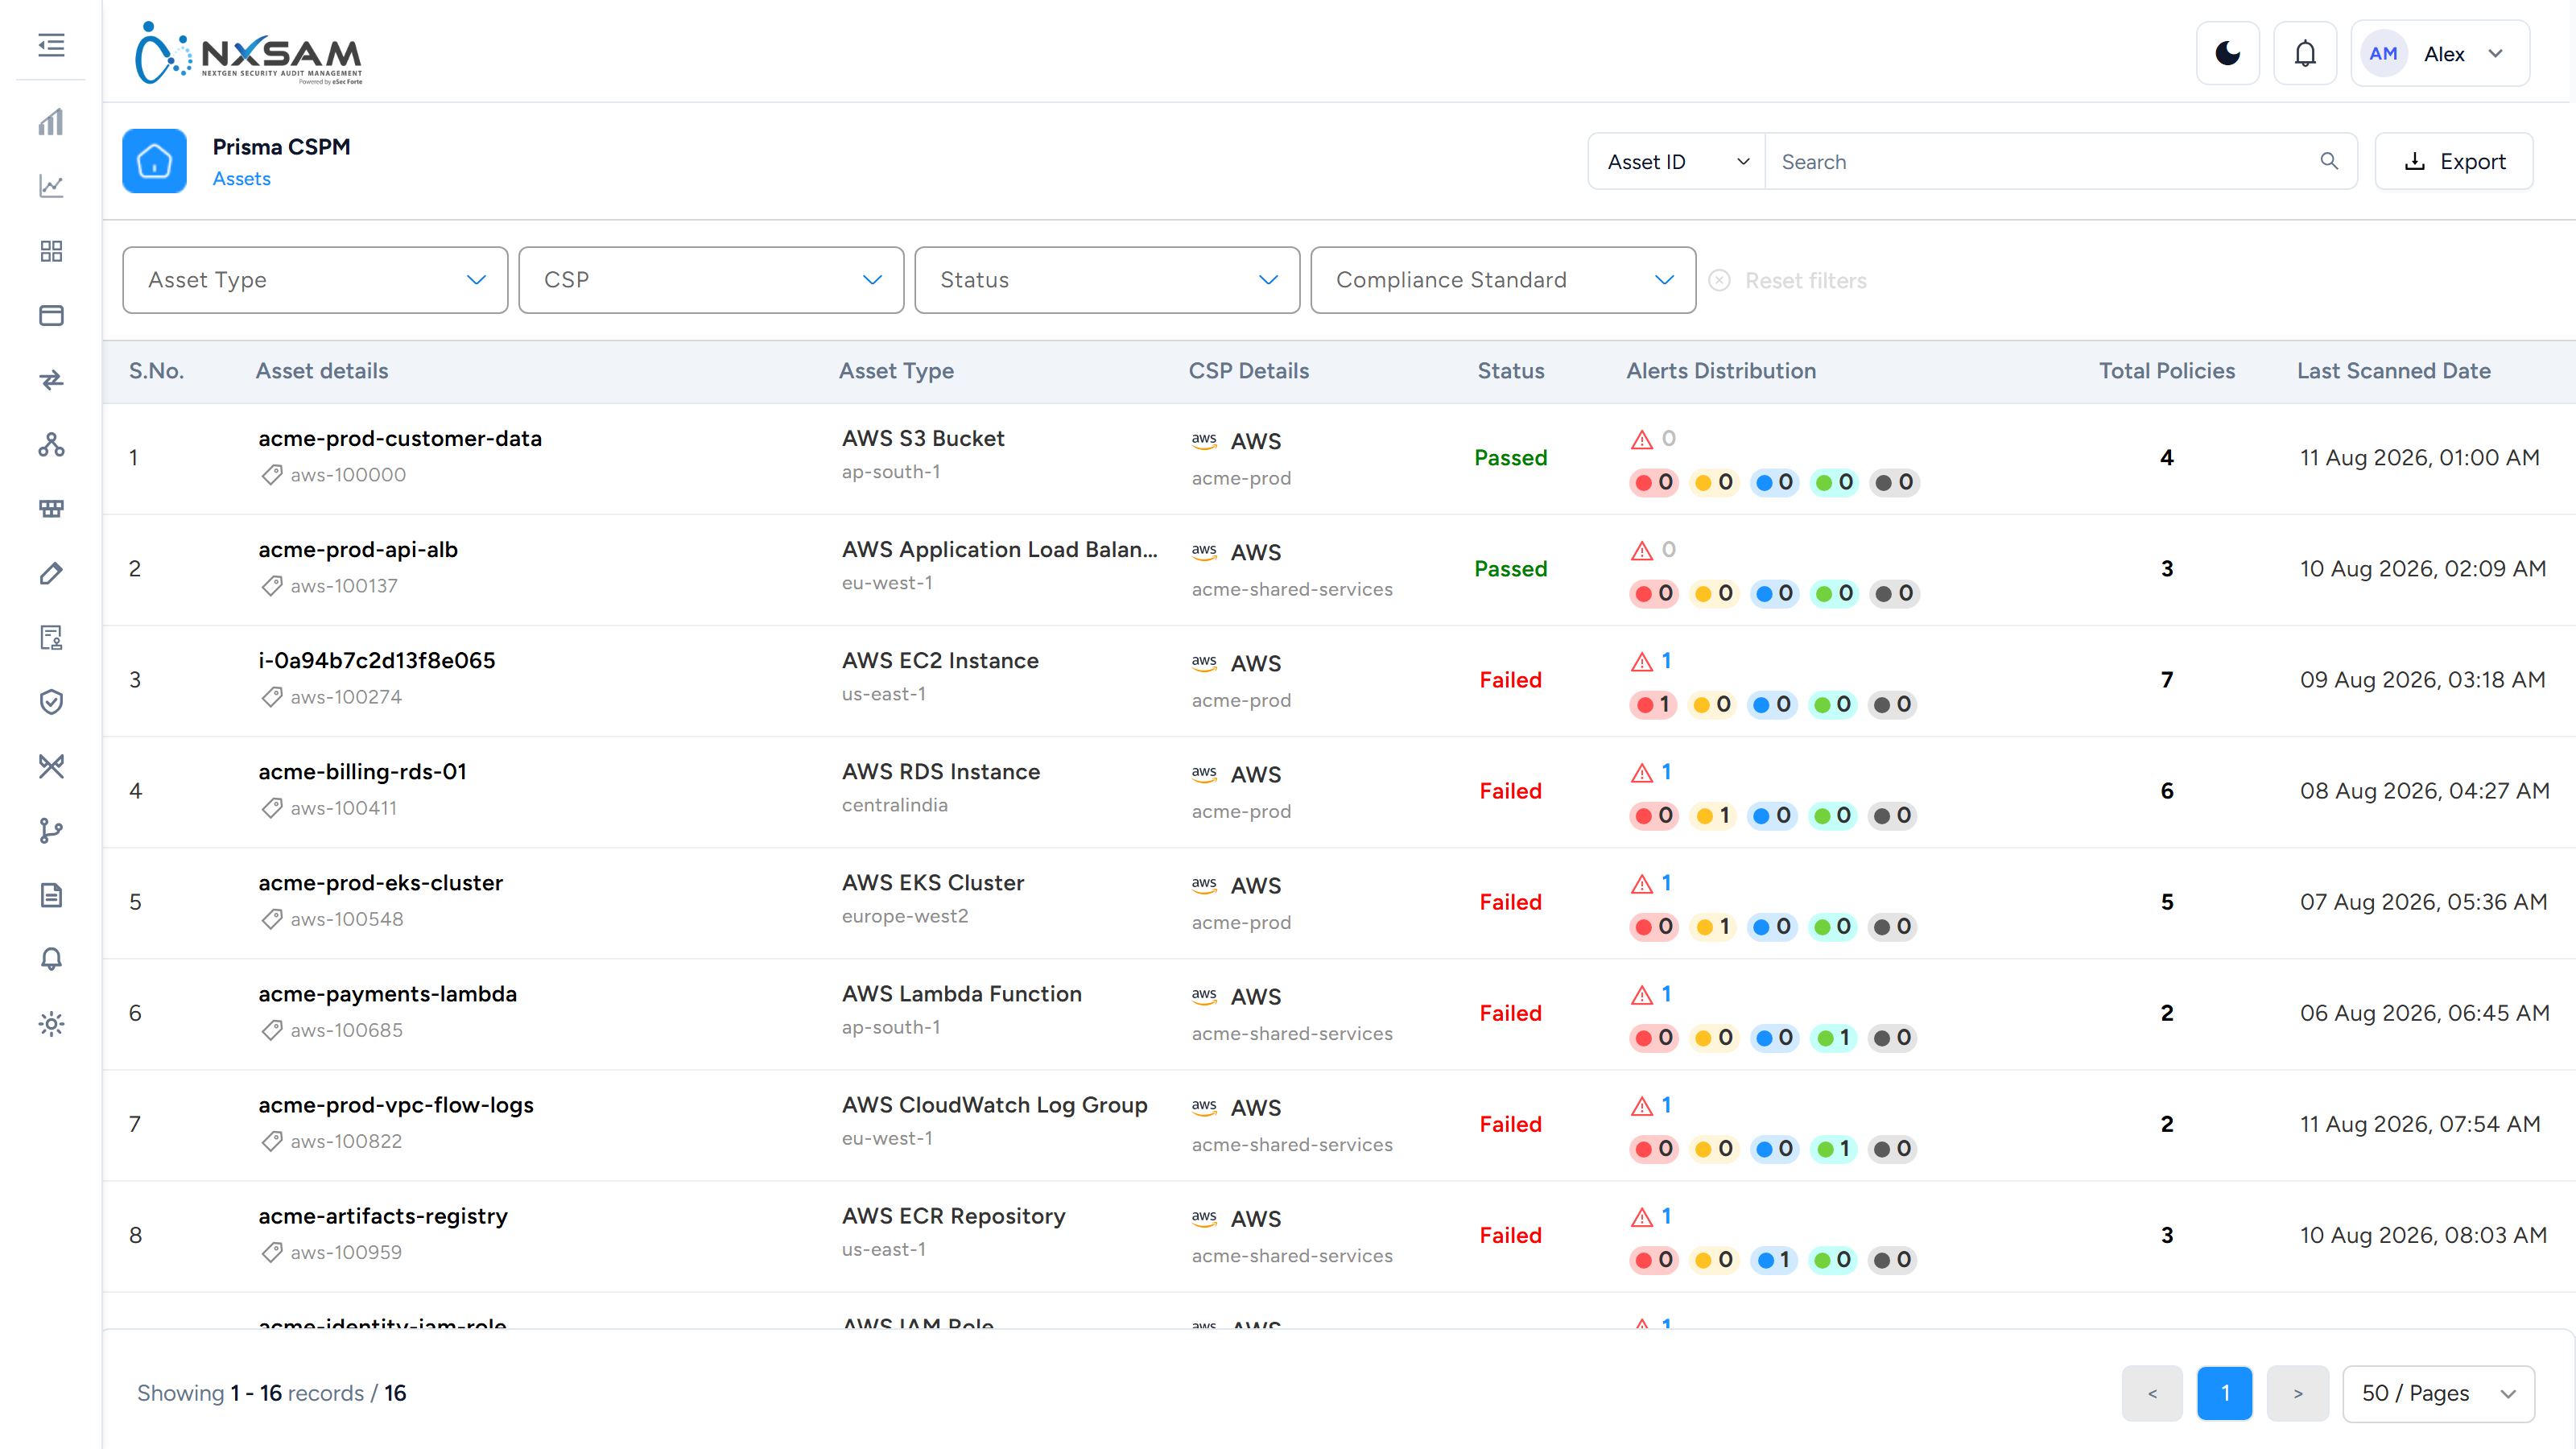
CSPM Assets
The cloud resources Cortex or SentinelOne has discovered, with their open issues and cases by severity. The arrows in the count columns open the other screens filtered to that asset.
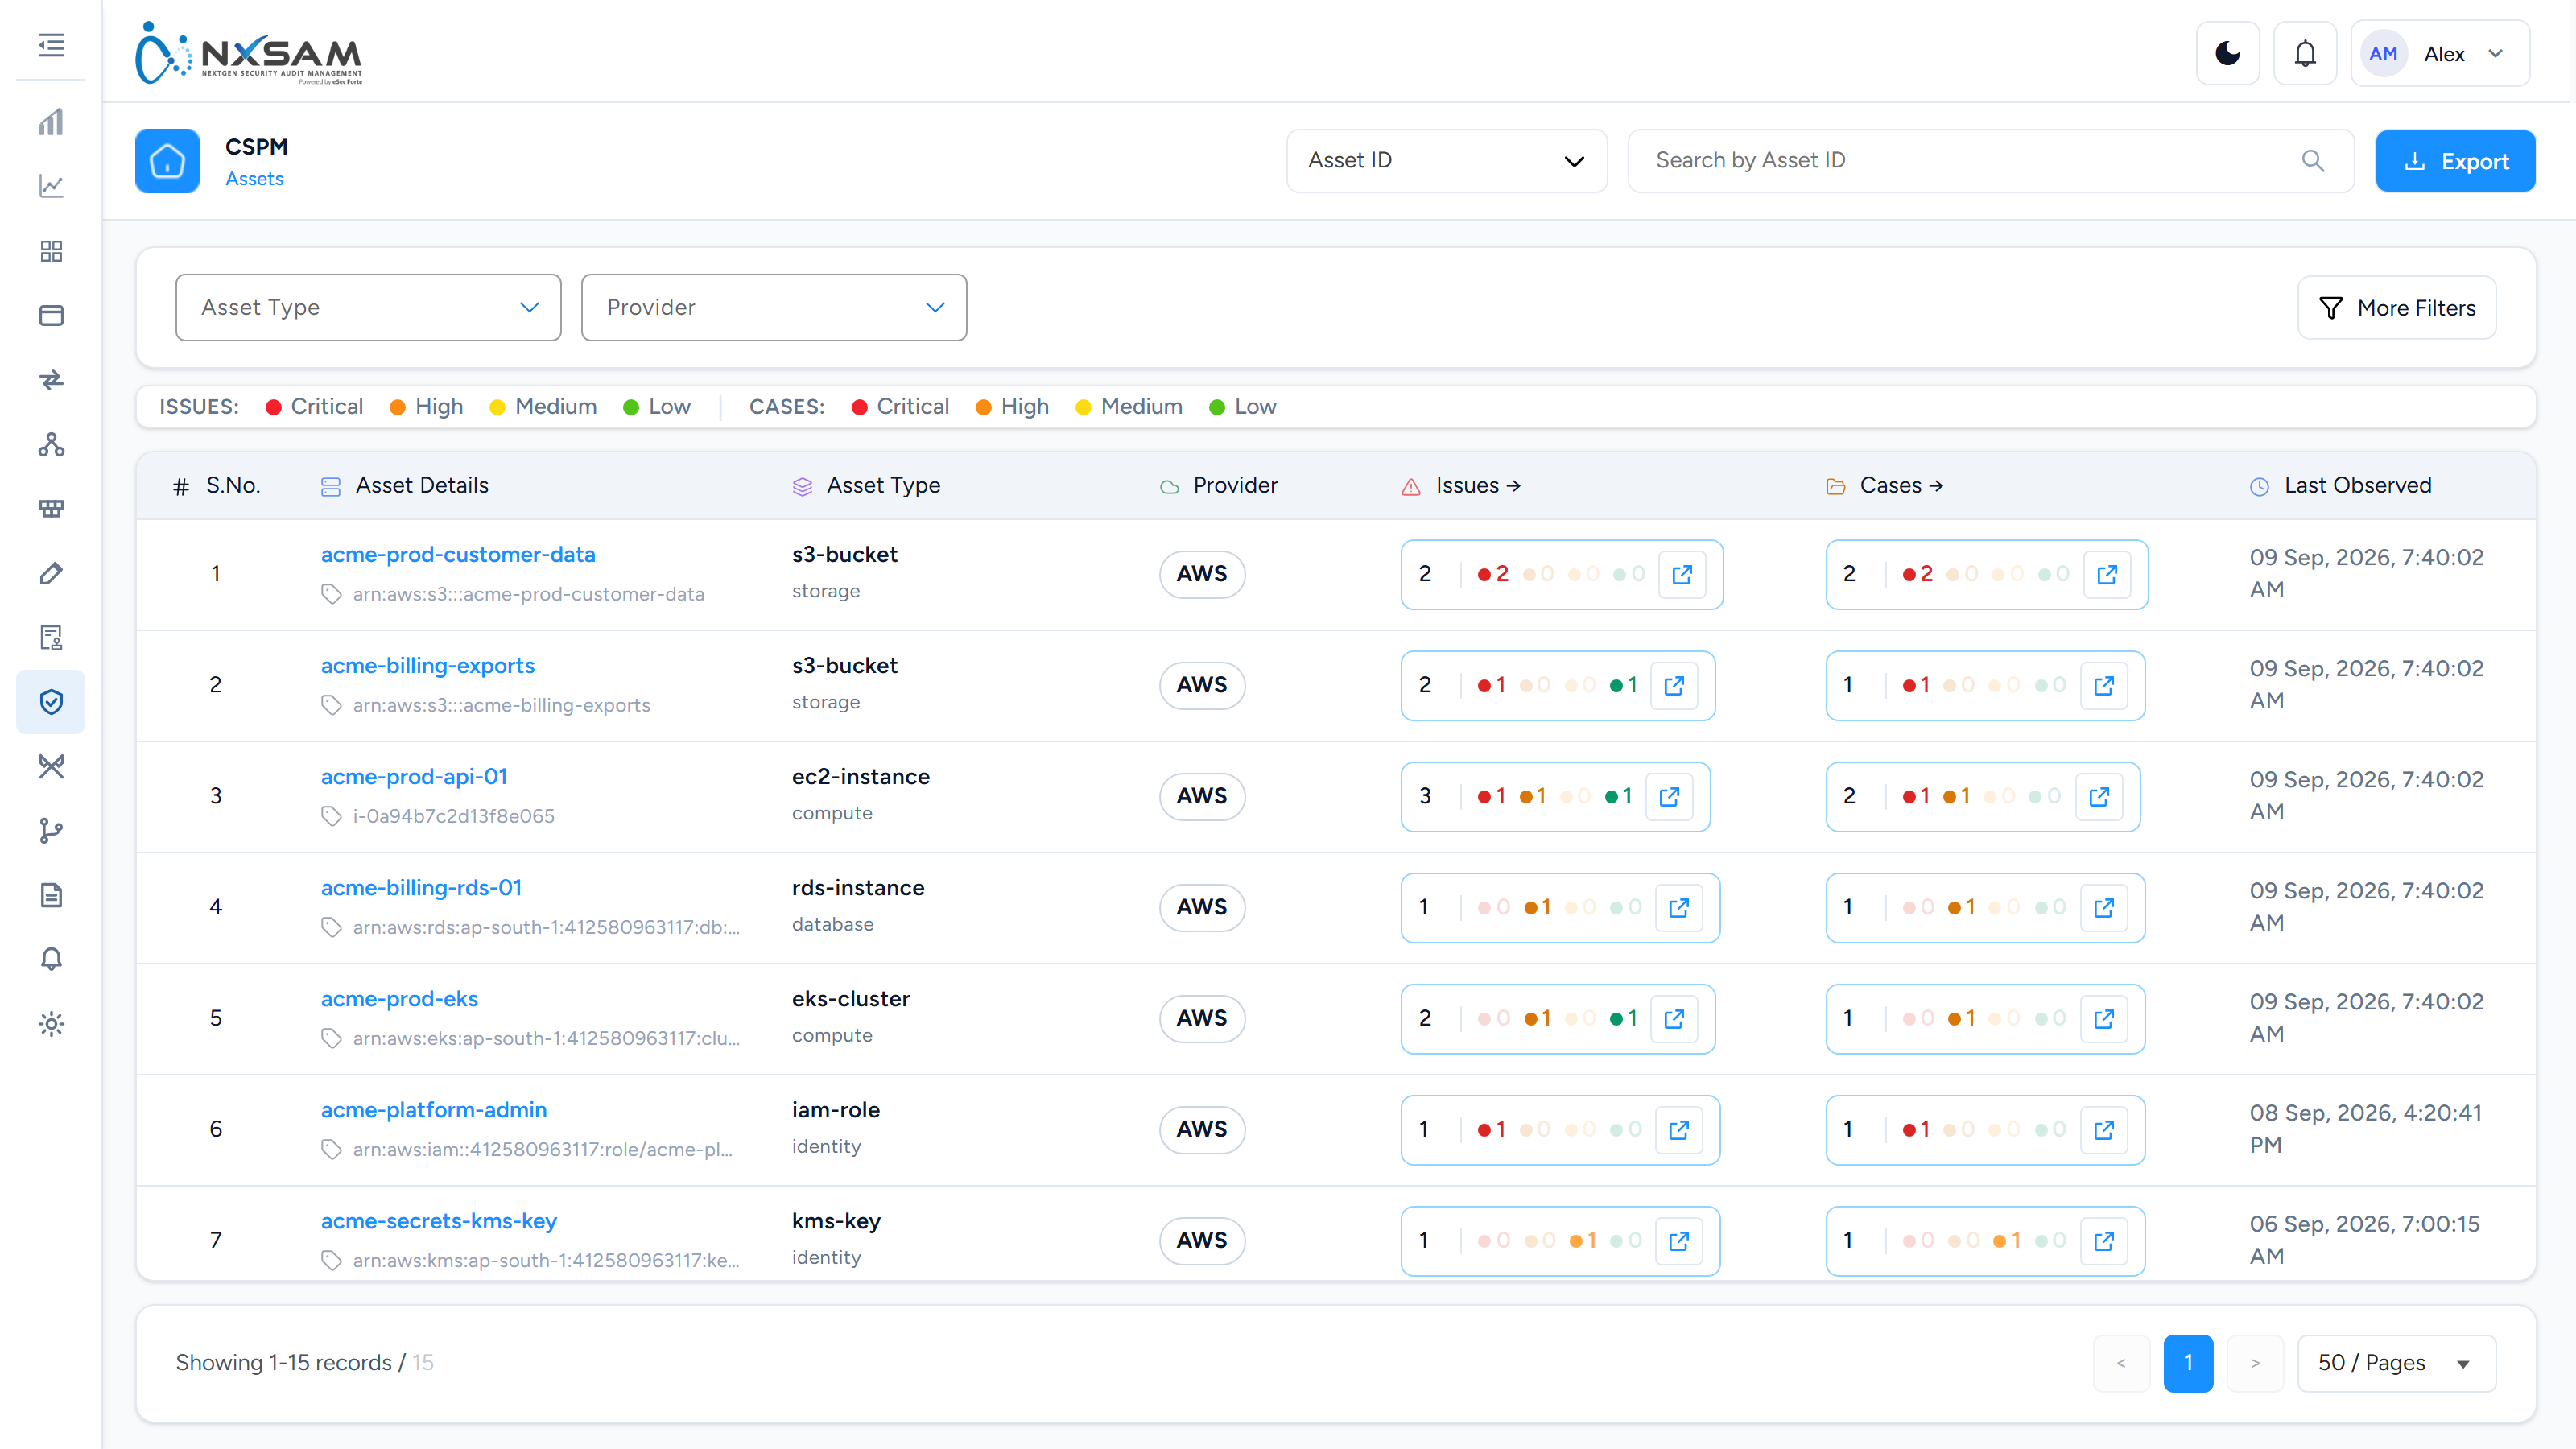
CSPM Cases
Issues grouped into one piece of work, with a severity of the case's own. Fixing the case fixes every issue in it.
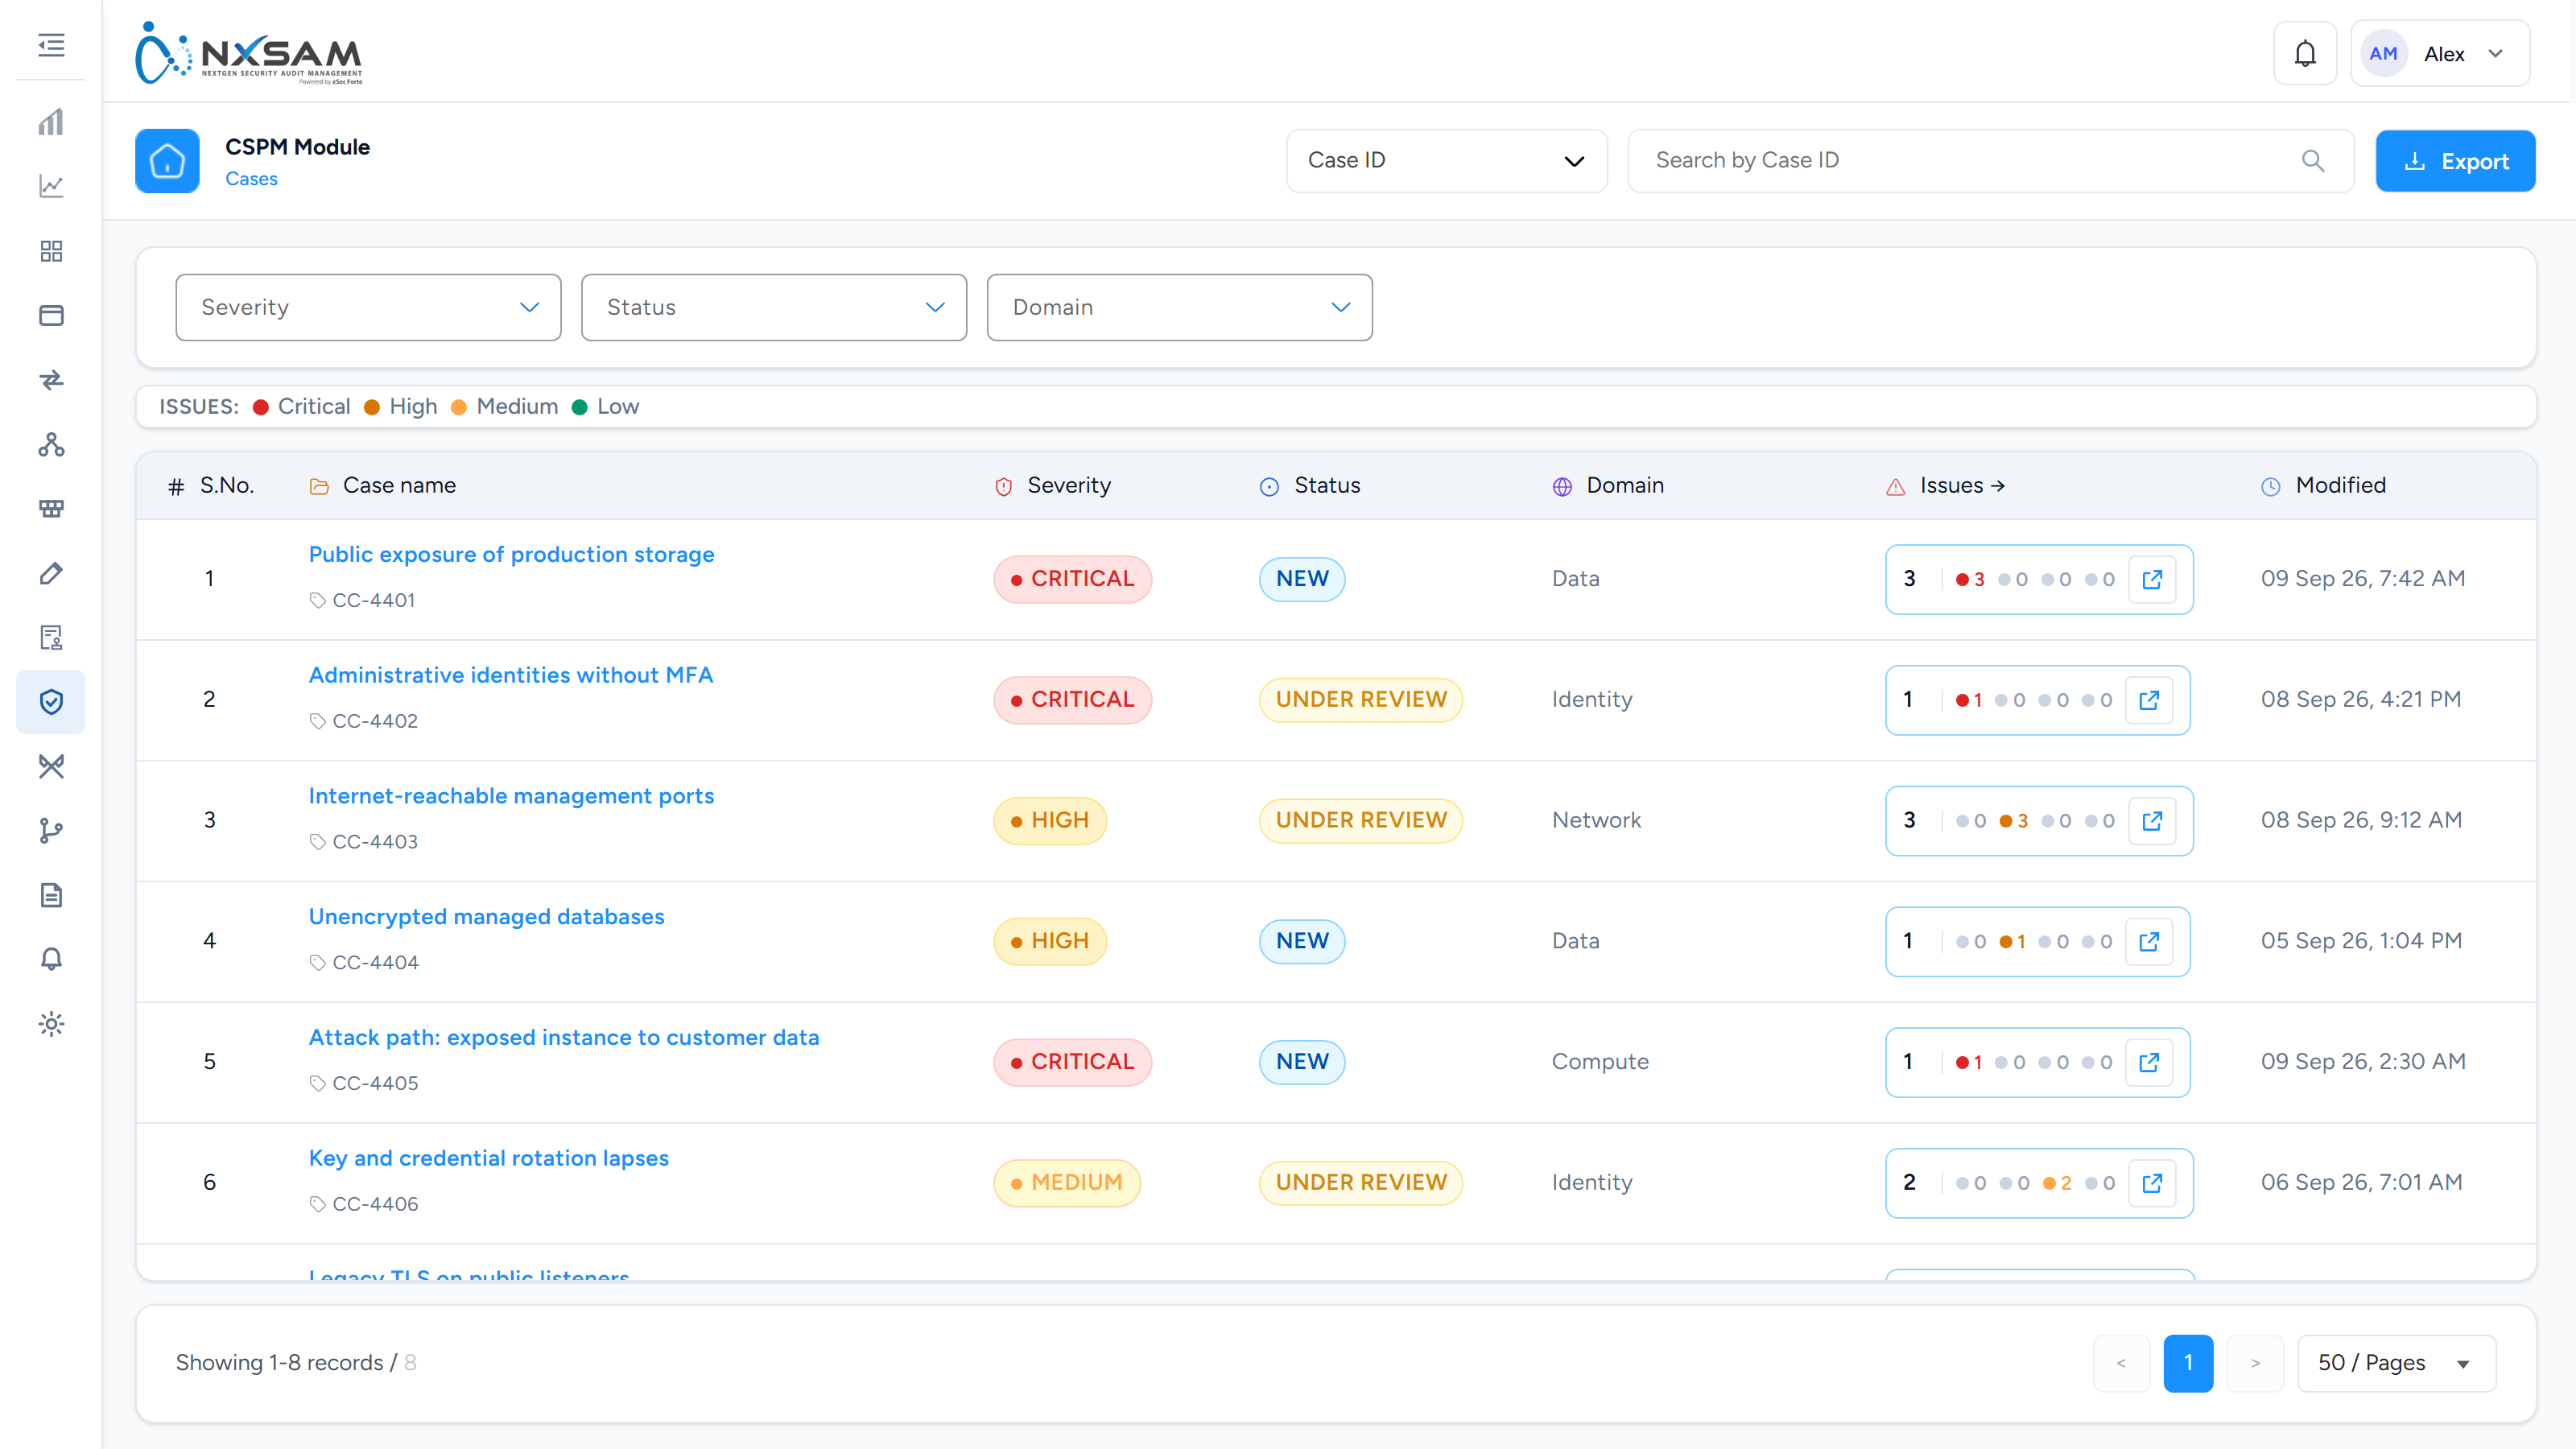
CSPM Compliance Standards
The benchmarks posture is measured against, and which are switched on.
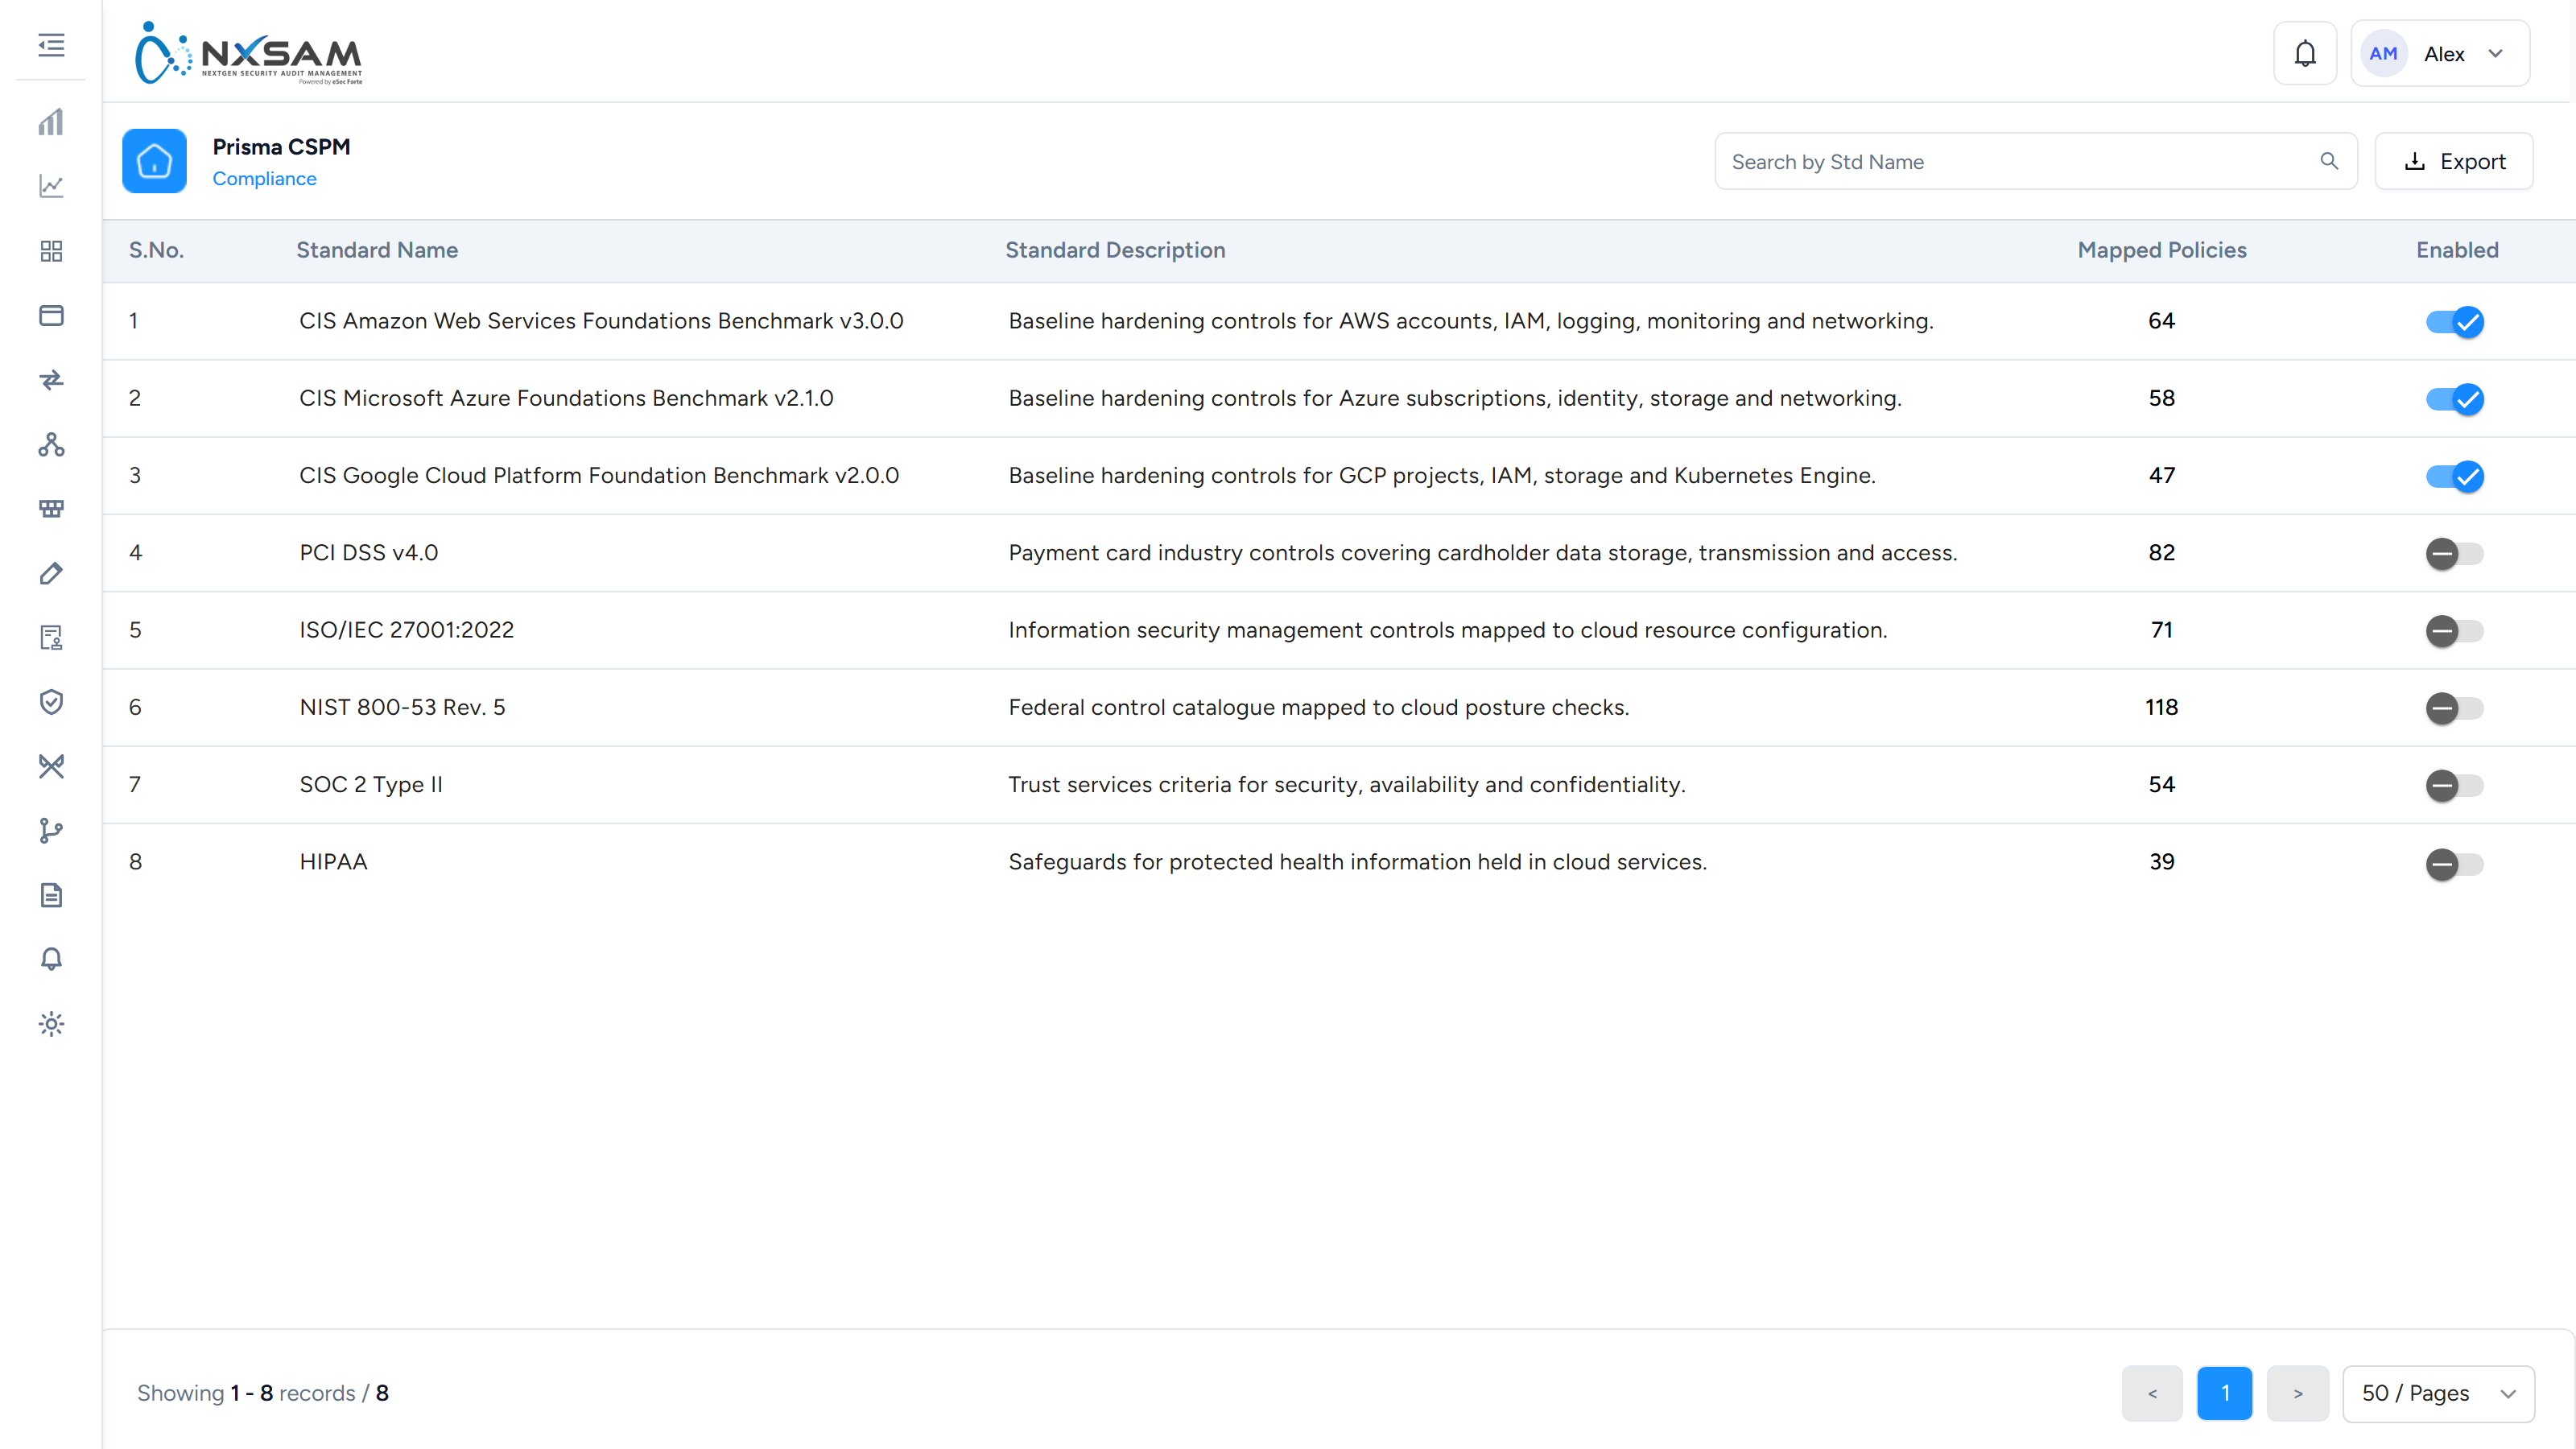
CSPM Issues
One row per rule failing against one or more resources. Asset Count is the column to sort by — an issue on two hundred assets is one template to fix, not two hundred resources.
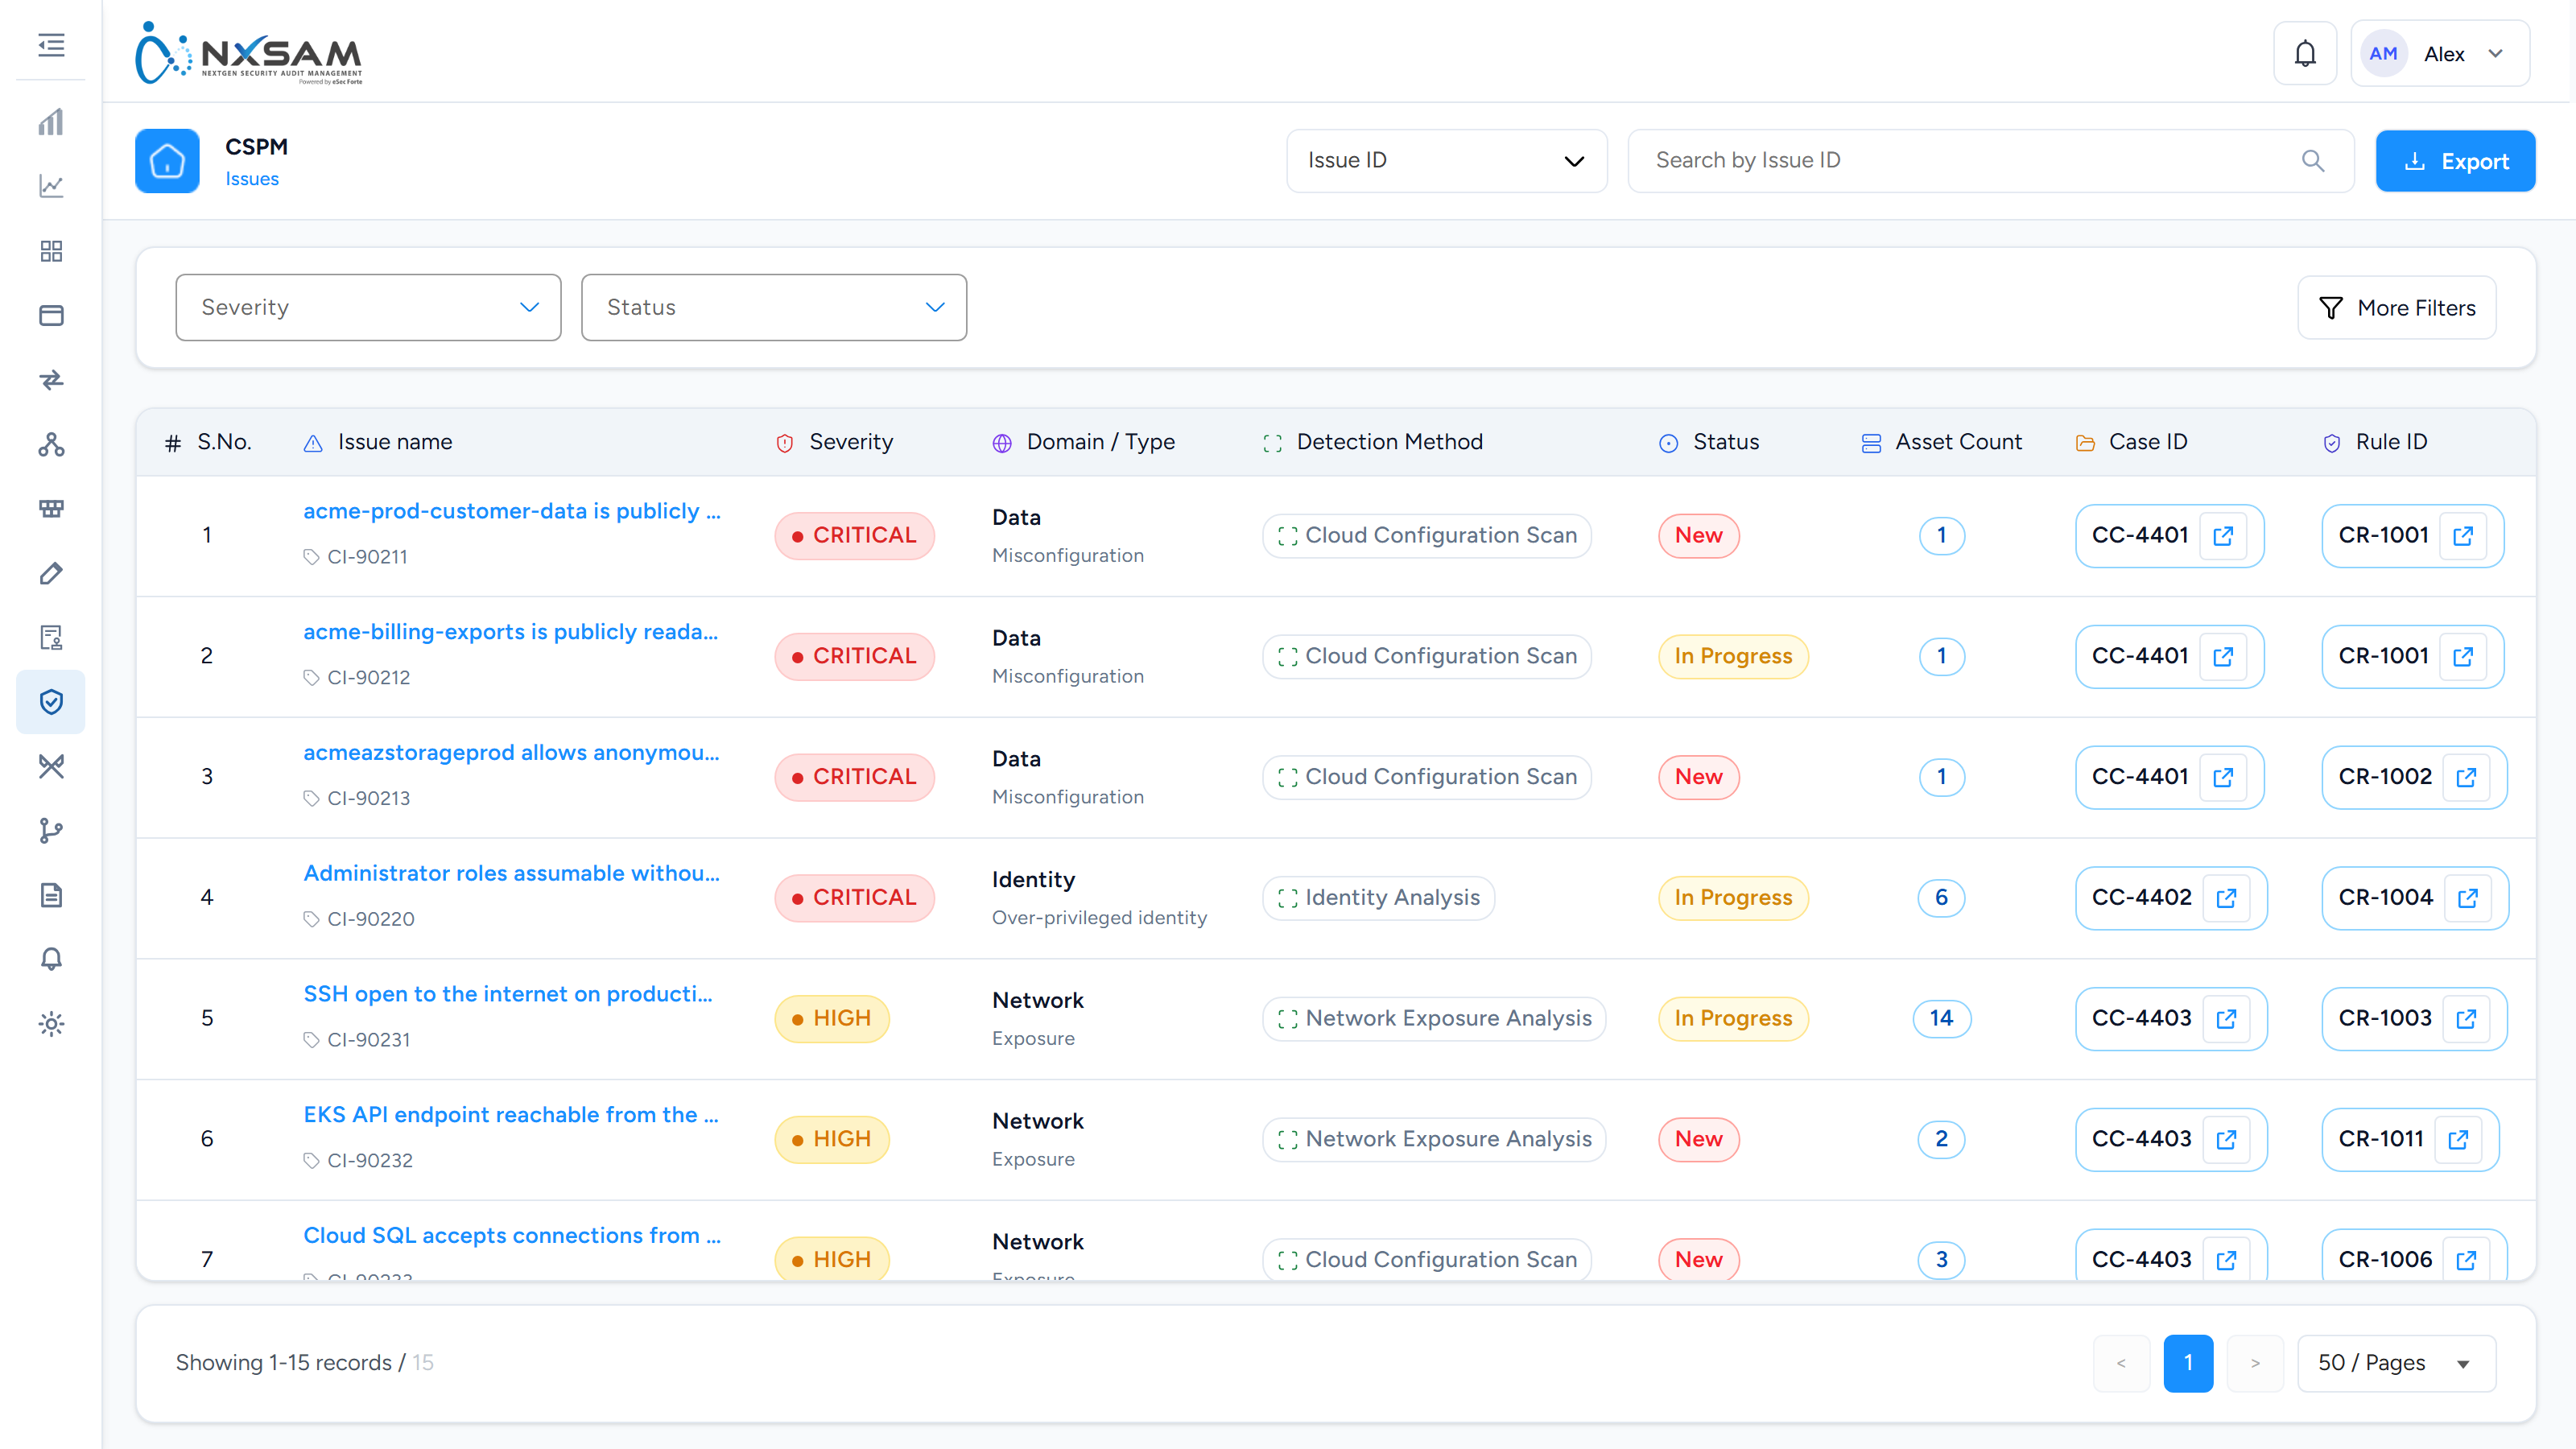
CSPM Policies
Named groups of rules as configured in the posture platform, and whether each group is switched on. Explains why a rule that exists is or is not producing issues.
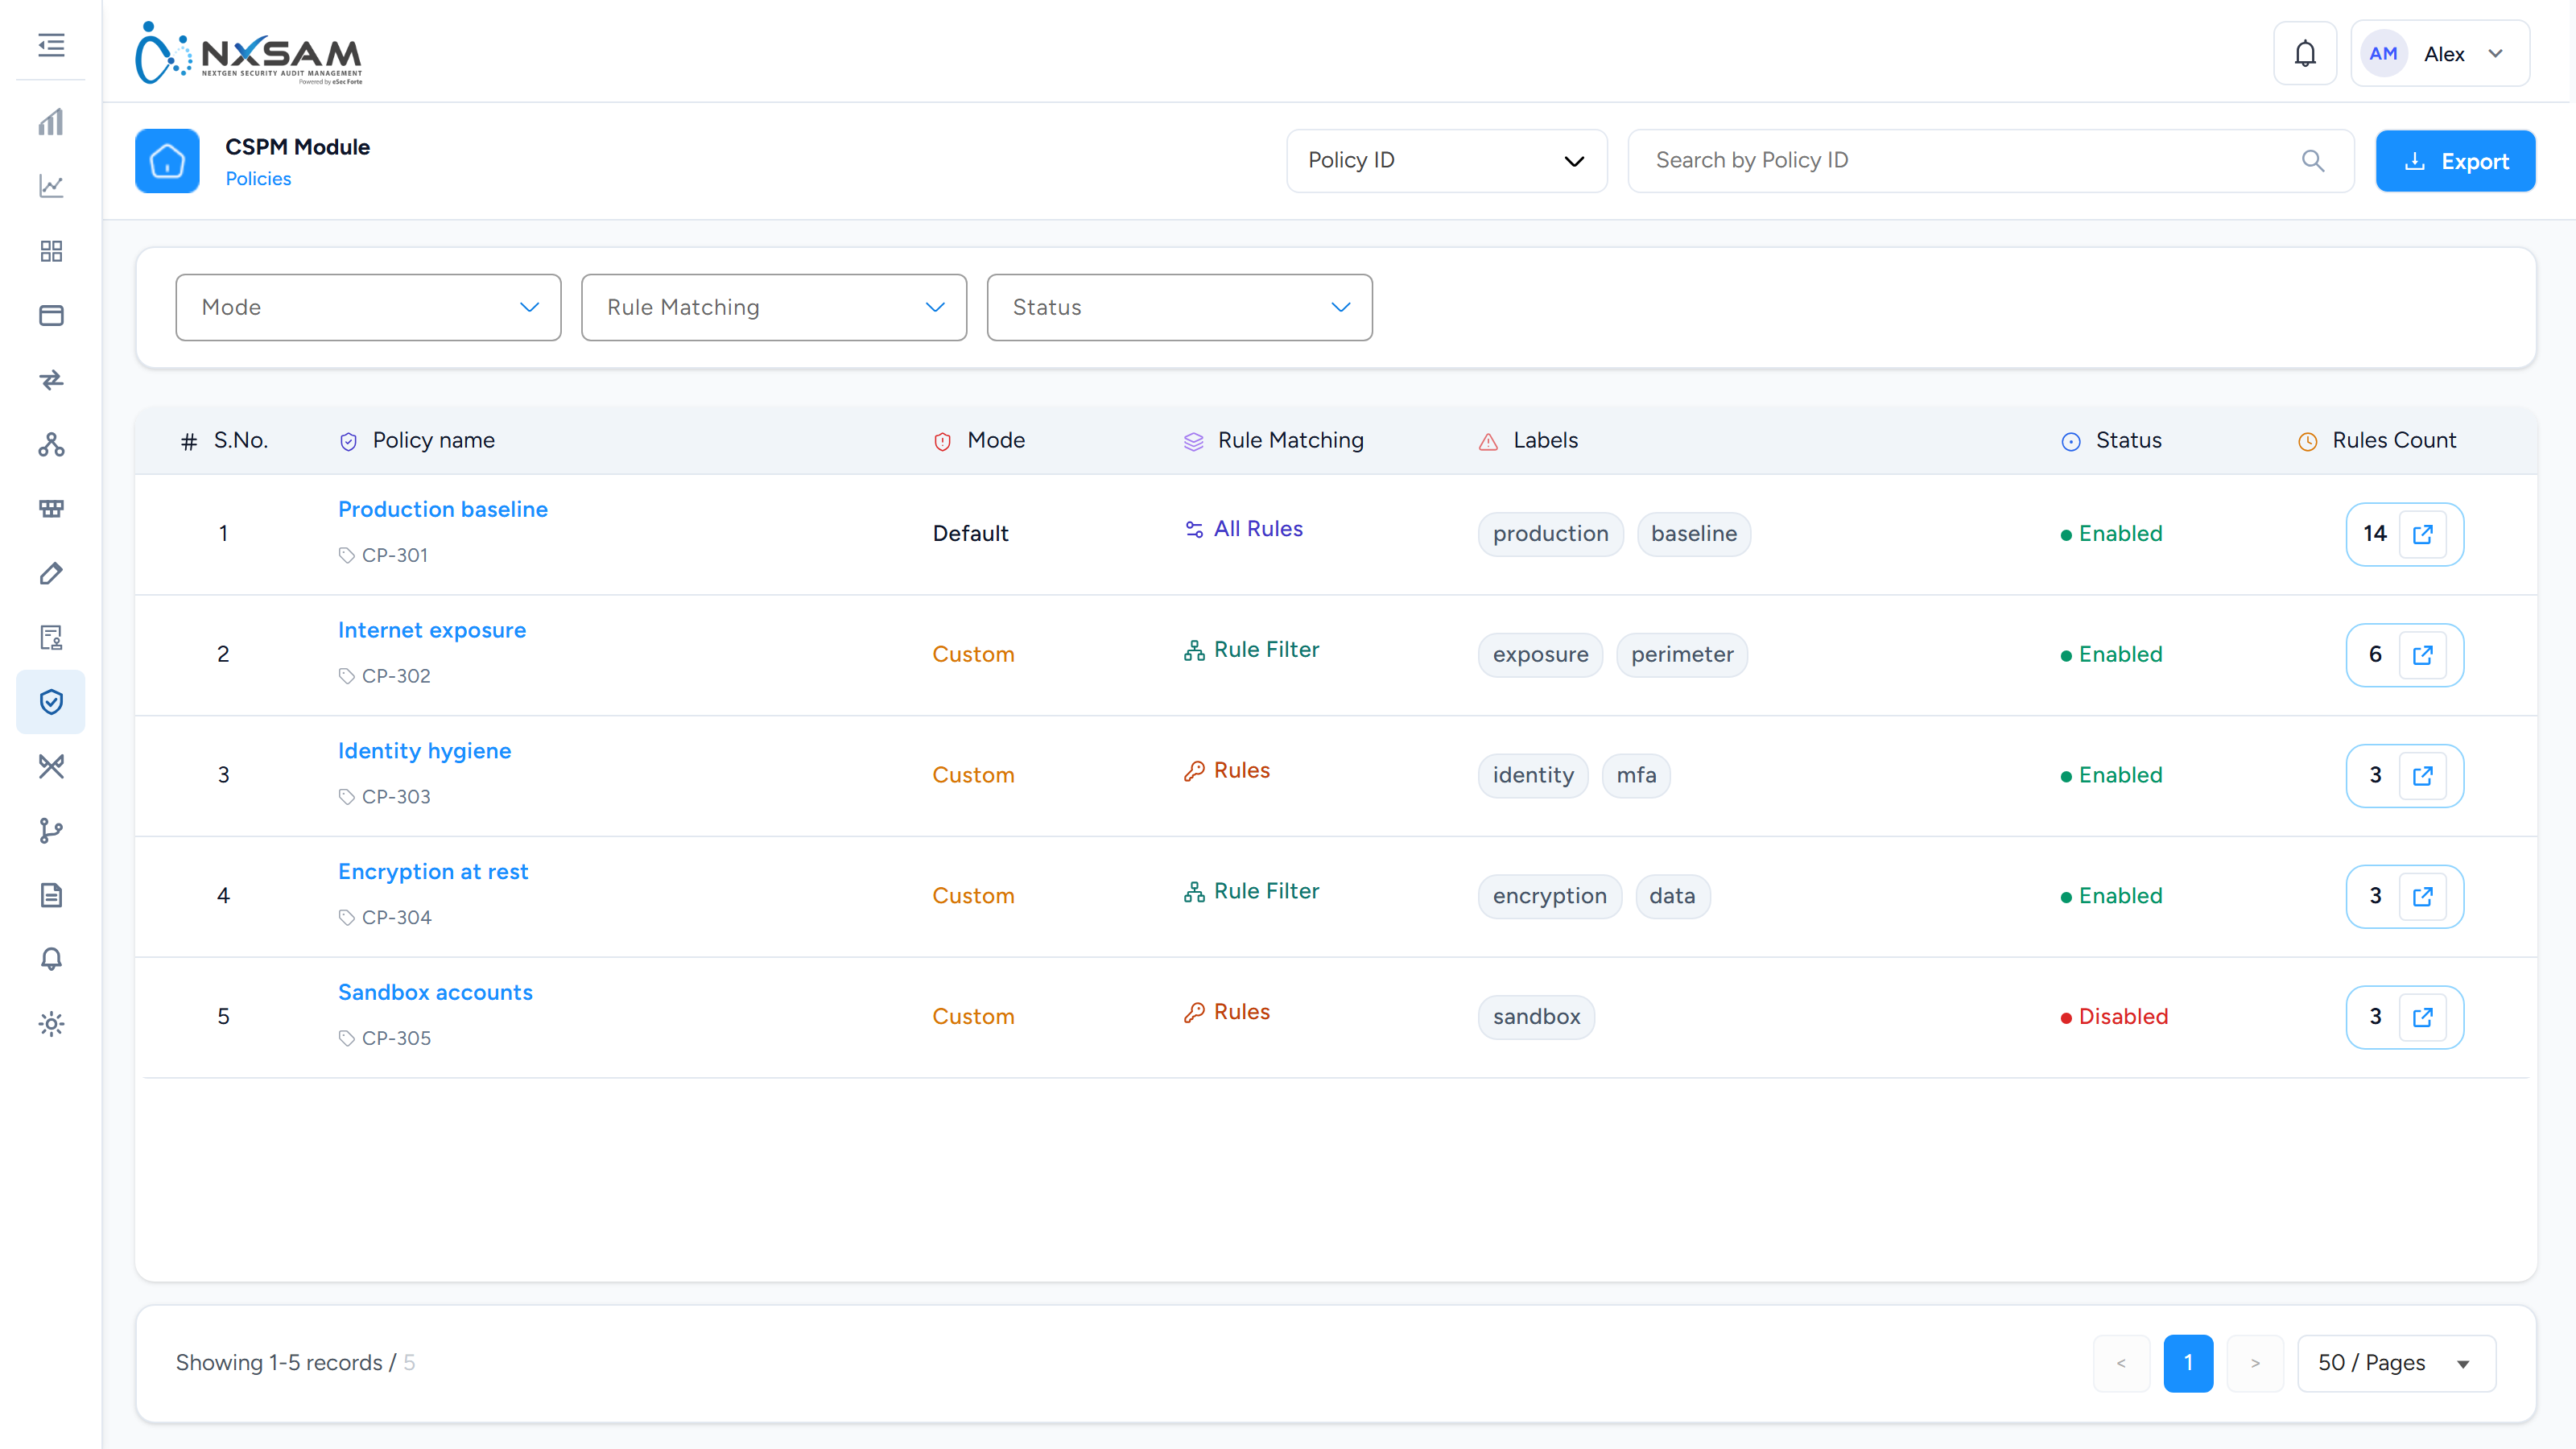
CSPM Policies
The individual checks behind those standards, with the severity each raises.
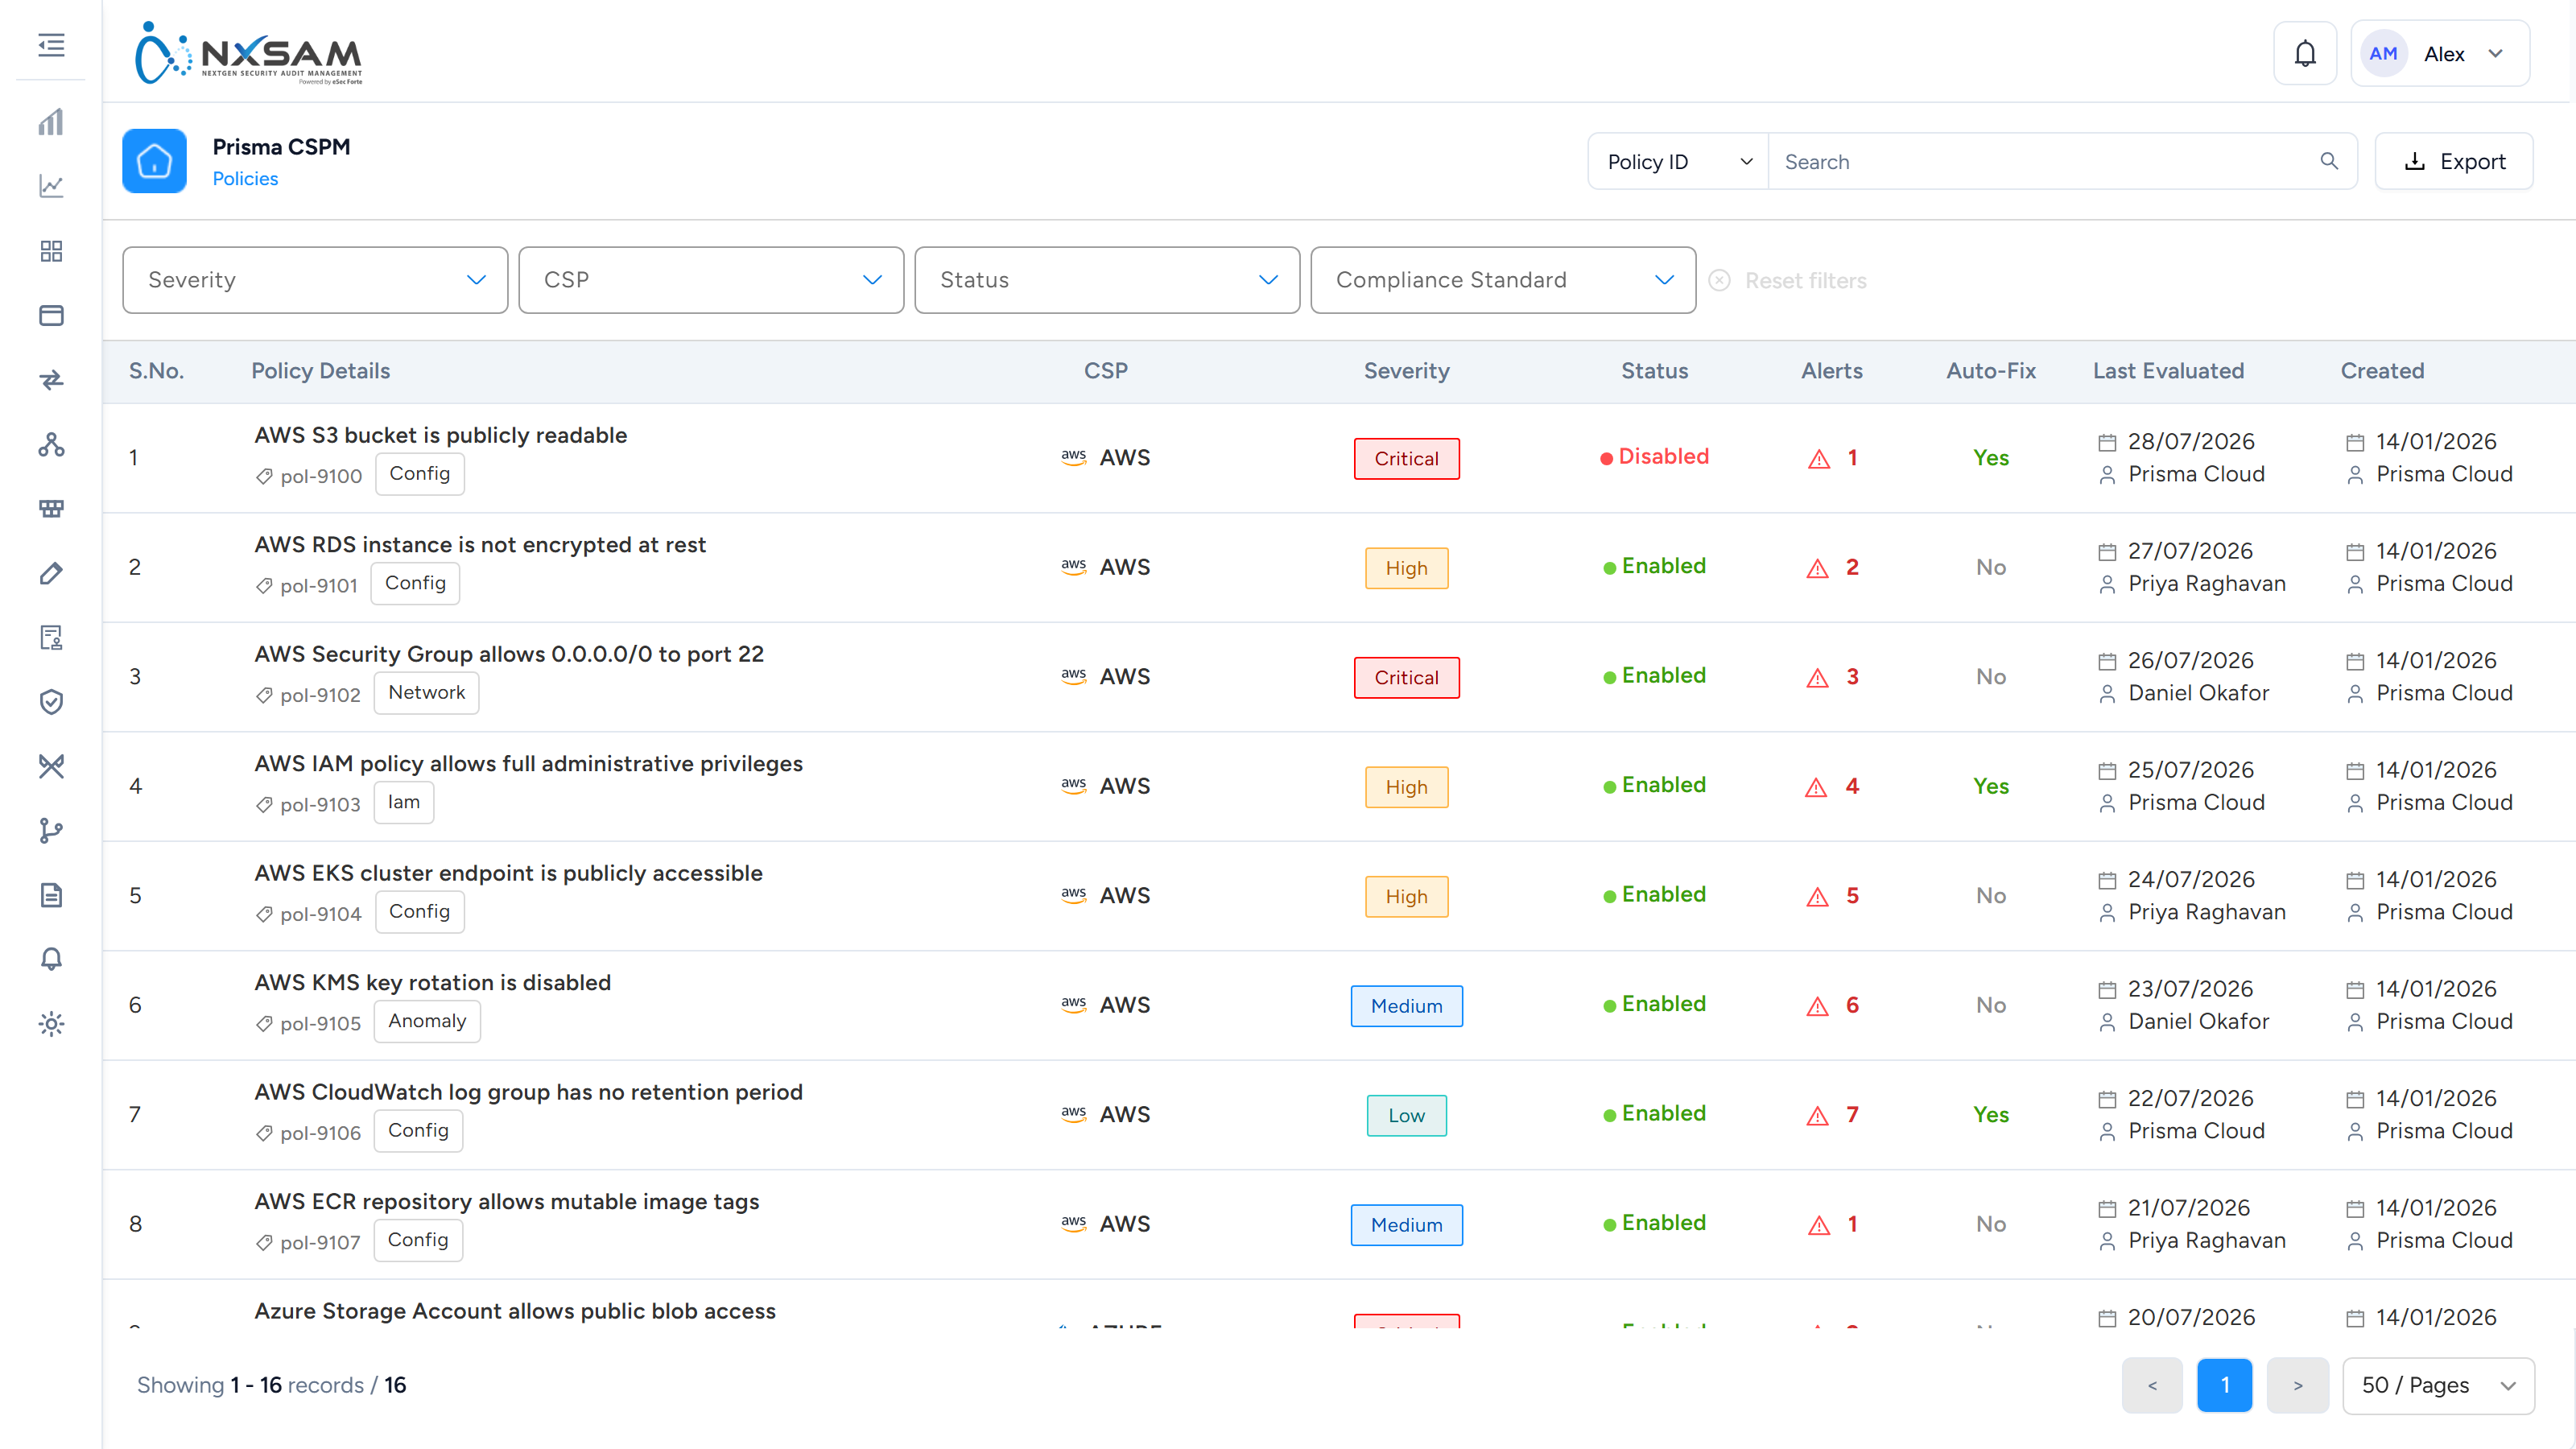
CSPM Rules
The individual checks behind the issues, with whether each is enabled and how many issues it has raised.
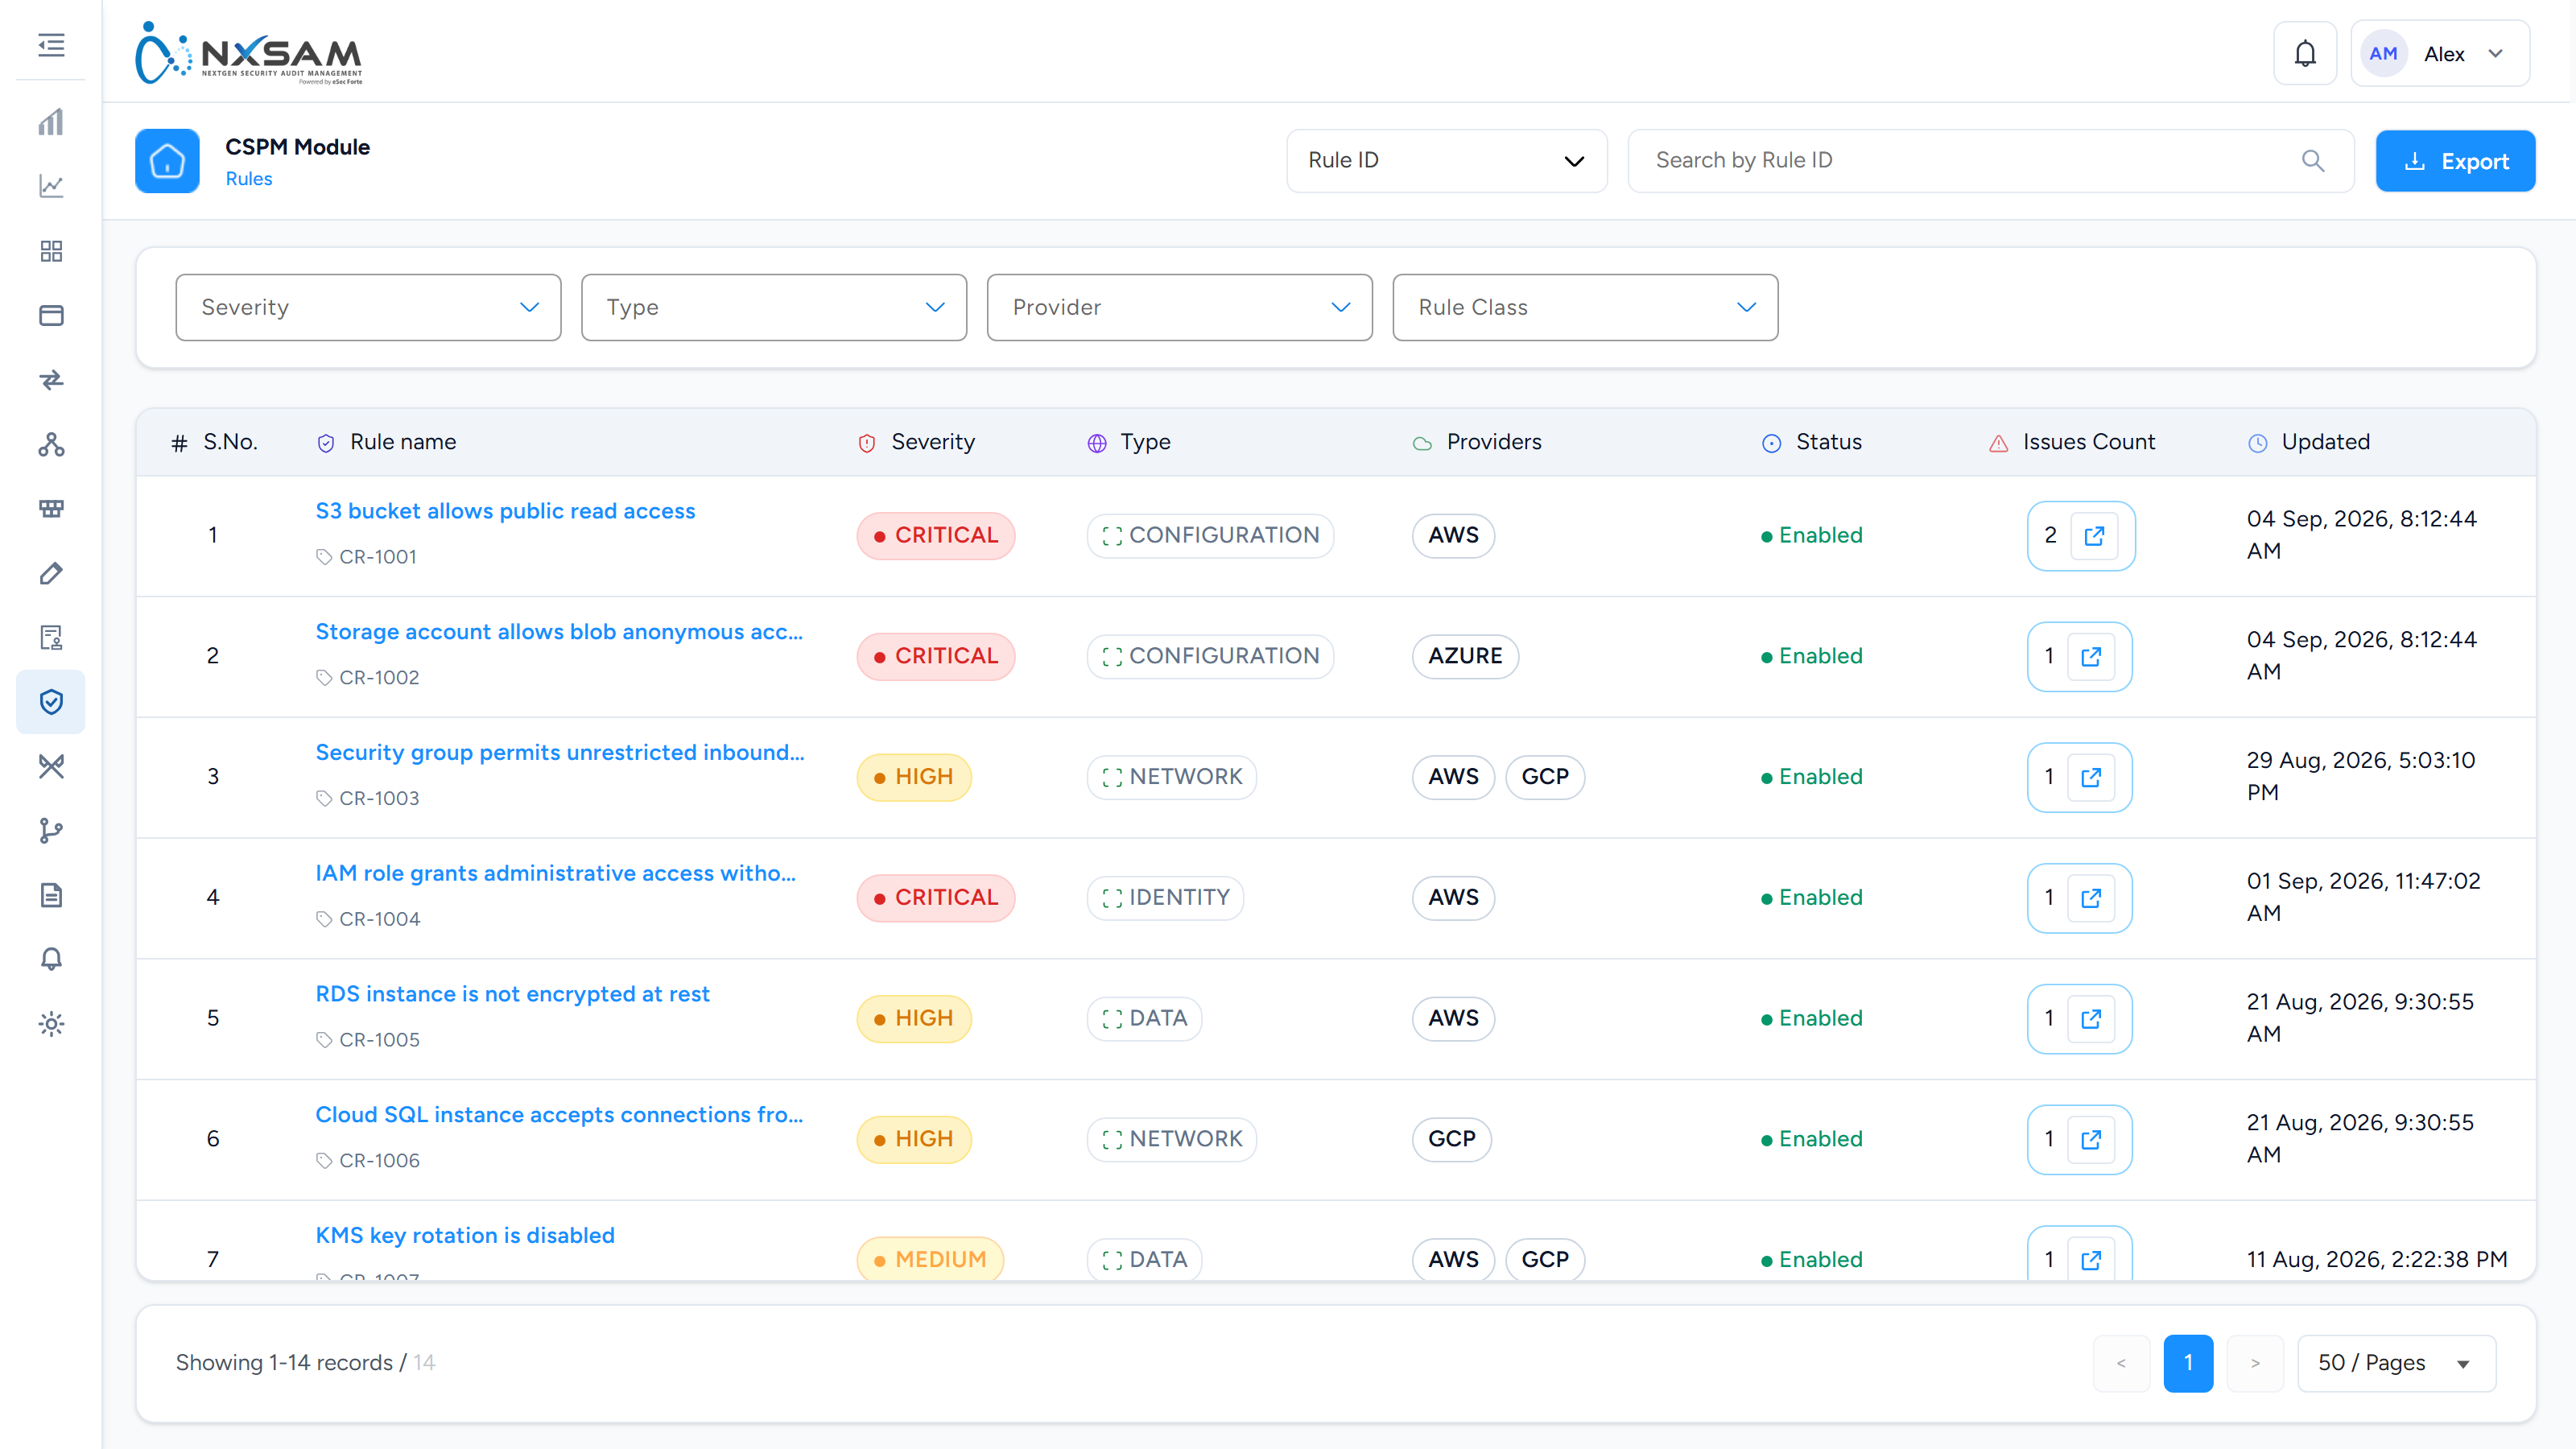
Cloud Security (CSPM): support reference
Internal. The customer-facing explanation is in the screen reference.
CSPM is a reporting surface, not a working module: nine screens across two families, no row actions on any of them. Everything it shows comes from a cloud posture platform, and almost every ticket is really a question about that platform or about scope.
Two families of screens — establish which one the caller is on
| Family | Screens | Fed by |
|---|---|---|
| Prisma CSPM | Asset Inventory, Alerts, Compliance, Policies | Prisma Cloud CSPM |
| CSPM | Assets, Issues, Cases, Rules, Policies | Cortex CSPM, SentinelOne CSPM |
Both families have a screen called Policies and both have an asset list. A caller who says "the CSPM policies page is empty" may be on either, and the two are fed by different integrations with different sync paths — so the first question on any CSPM ticket is which family, and the quickest way to settle it is the column set: Prisma's asset list has Total Policies and Alerts Distribution; the CSPM one has Issues → and Cases →.
The CSPM family also has a vocabulary Prisma does not: a rule raises issues, and issues are grouped into cases. Callers use "alert", "finding" and "issue" interchangeably; on the CSPM screens only issue exists.
Sync paths differ between the two CSPM sources
- Cortex CSPM has two sync actions on its integration page: Master Sync brings the reference data — rules and policies — and Sync brings the assets, issues and cases. An estate with rules and policies but no issues has had a master sync and no data sync, which is the normal state right after configuration.
- SentinelOne CSPM has a single Data Sync.
Both pages show Sync Status, Last Sync Type, Last Initiated At, Last Processed At and Last Completed At. Initiated without Completed is a sync still running or one that failed; look at the status before concluding the data is missing.
Nothing is edited here
There are no row actions because there is nothing to change. Alerts are resolved by fixing the cloud resource or by changing the policy in the source platform; NxSAM reflects the result at the next sync.
A caller looking for a way to close an alert here is looking for something that does not exist, and pointing them at the source platform is the whole answer.
Policy against reason
Two columns that are easy to conflate and answer different questions:
| Column | Means |
|---|---|
| Policy | The rule that was evaluated |
| Reason | The specific configuration that failed it |
The pair is the point. The policy says what is required; the reason says what is actually there. A reason column that merely restates the policy is a source-platform configuration issue, not a display fault.
Three integrations, three vendors, one module
Prisma Cloud, Cortex CSPM and SentinelOne all feed CSPM, with separate credentials. Prisma additionally appears as a container integration, which is a different connection entirely. Prisma feeds the Prisma CSPM screens only; Cortex and SentinelOne feed the CSPM screens only.
"We already connected Prisma" is a common reason for an empty CSPM module — the container one was connected.
All three ship unconfigured, so an empty screen with a prompt is the correct first-run display rather than a fault.
Standards are opt-in
The compliance standards list ships with everything available and only some enabled. A customer reporting that a benchmark "isn't being assessed" usually has it disabled here.
Rules, issues and cases do not have to reconcile either
On the CSPM screens:
- An issue touches one or more assets; its Asset Count is that number. The sum of asset counts across issues exceeds the number of assets, because one asset can carry many issues. That is not double counting.
- A case's severity is set by the platform and does not have to equal its worst issue.
- A rule that is disabled can still show an Issues Count — those issues are historical and nothing is re-evaluating them.
- A policy's Rules Count is the rules it contains, not the rules producing issues.
Alerts, assets and policies do not have to reconcile
- An asset with no alerts is compliant, or not covered by any enabled policy.
- A policy with no alerts is either satisfied everywhere or applies to no asset present.
- Total Policies on an asset counts what applies to it, not what failed.
Sums that "do not add up" across the three screens are usually this, and are not an error.
What to collect before escalating
- Which family of screens — Prisma CSPM or CSPM — and which integration feeds it.
- Which cloud account, and which cloud provider — the same policy name exists across AWS, Azure and GCP.
- The alert ID and its policy ID (Prisma), or the issue ID with its case and rule IDs (CSPM).
- When the last sync ran, which kind it was, and whether it completed.
- Whether the standard concerned is enabled (Prisma), or whether the rule and its policy are enabled (CSPM).
- For empty modules: which integration was configured — the container Prisma connection is the usual wrong answer.
Red Teaming
Red Teaming
Red teaming records adversarial exercises — assessments that test whether an attacker could achieve a specific objective, rather than enumerating weaknesses.
How it differs from penetration testing
The two are often conflated, and the distinction shapes what the findings look like.
| Penetration test | Red team exercise | |
|---|---|---|
| Question asked | What weaknesses exist in this system? | Could an attacker achieve this objective? |
| Scope | A defined system | Whatever the objective requires |
| Success measure | Coverage of the target | Whether the objective was reached |
| Also tests | The system | The system and whether anyone noticed |
A red team exercise may reach its objective through a chain of individually unremarkable weaknesses. No single finding looks severe; the path is what matters.
What findings look like here
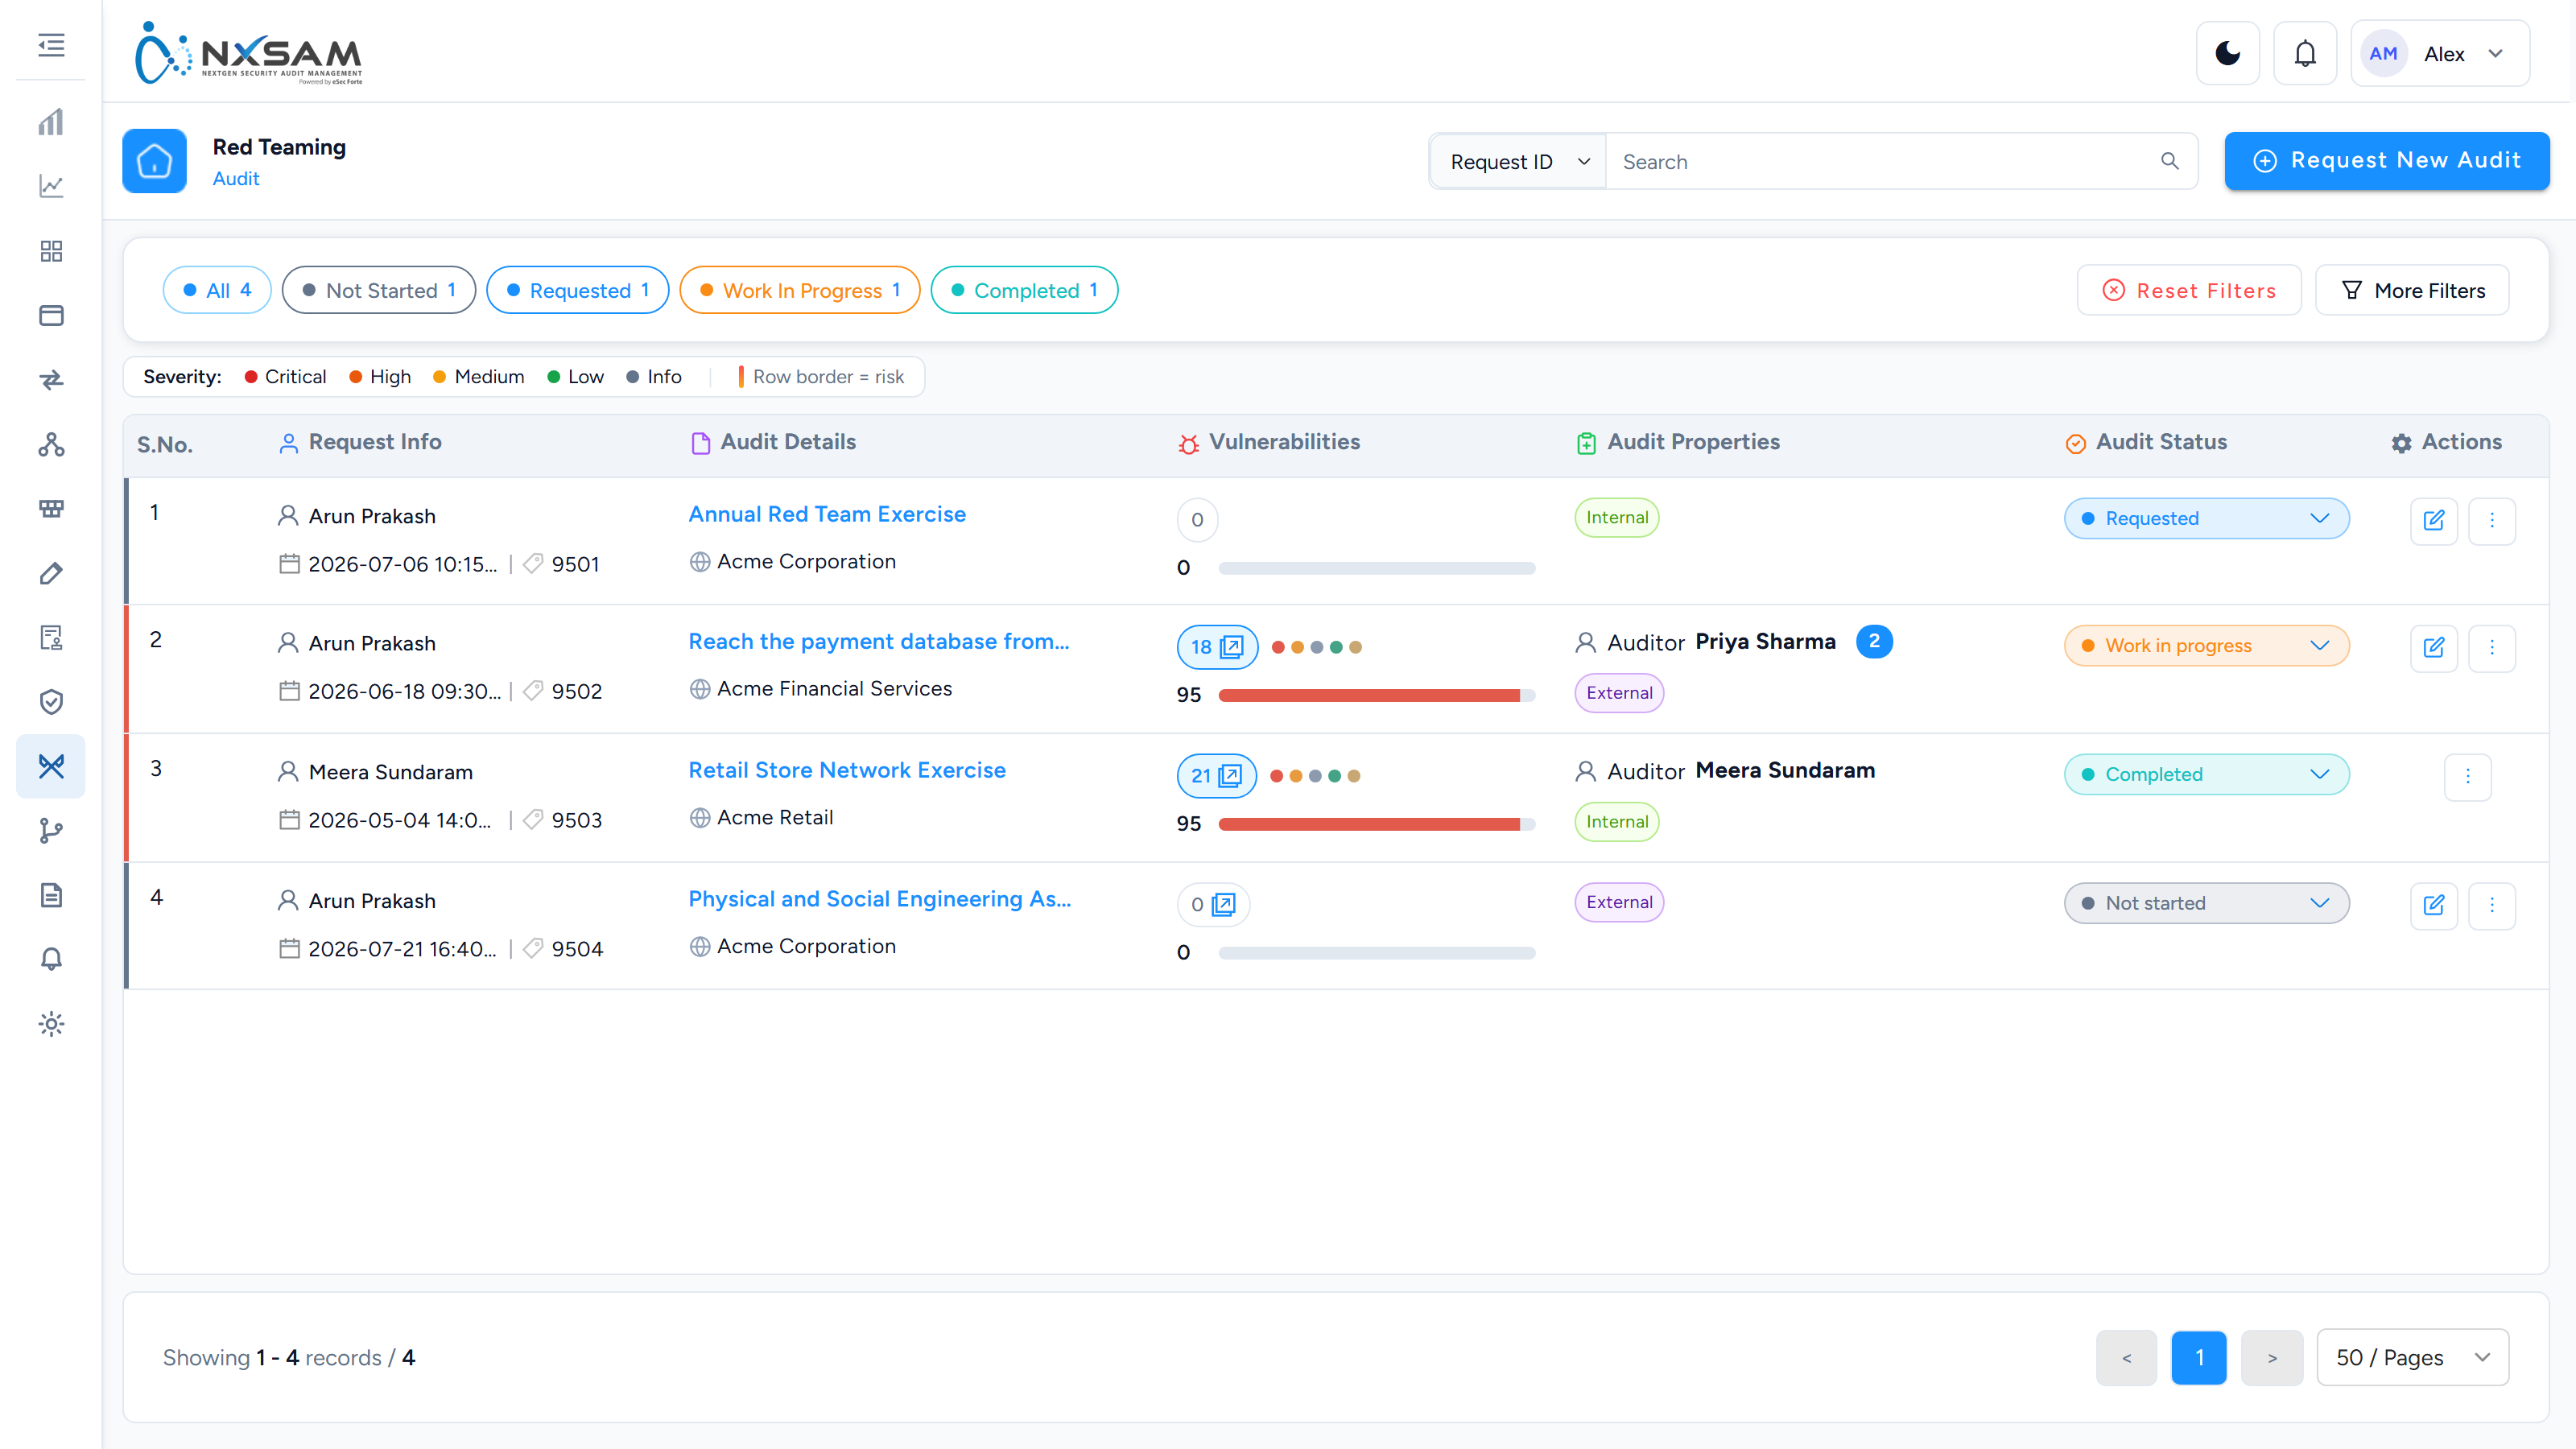
Red team findings are narrative. They describe a route: this access led to that credential, which permitted this movement, which reached the objective.
Two consequences for how they are handled:
- Severity reflects the path, not the step. A finding rated Critical may involve several individually minor weaknesses. Do not down-rate the parts.
- Fixing one step may break the chain — but usually only that chain. The underlying weaknesses often remain available for a different route.
Detection matters as much as prevention
A red team exercise also tests whether your monitoring noticed. "The objective was achieved and nothing alerted" is a finding in its own right, and often the more important one, because it applies to every future attack rather than one path.
Working with the results
- Read the narrative before the findings list. The list without the story loses the point.
- Address the chain, not only its steps. Ask what else the same weakness enables.
- Treat detection gaps as findings. They deserve owners and dates like any other.
- Re-run periodically. A red team result is a statement about one point in time against one objective.
Red Teaming: every screen, column and action
The smallest module in the product, and deliberately so — a red team engagement produces a handful of findings that matter rather than a list to work through.
The audit list
An engagement is tracked as an audit, with the same columns as the other assessment modules:
| Column | What it holds |
|---|---|
| Request Info | Who commissioned the engagement, when, and the request ID |
| Audit Details | The engagement name and its target |
| Vulnerabilities | How many findings it produced, with the severity split |
| Audit Properties | Type, cycle, scope and whether the engagement is considered |
| Audit Status | The engagement's state |
Row actions — five
| Action | What it does |
|---|---|
| View Vulnerabilities | The findings from this engagement |
| Assign Auditors | Who runs the engagement |
| Edit Audit Details | Name, dates, scope and properties |
| View Status History | Every status change, with who made it |
| Delete Audit | Soft delete |
The menu is shorter than VA's or AppSec's on purpose. There is no re-audit, no audit chain and no severity configuration, because a red team engagement is a discrete exercise rather than a repeating scan — you commission a new one, you do not re-run the old one.
The findings list
| Column | What it holds |
|---|---|
| VID | The finding's identifier, to quote in discussion |
| Vulnerability | What was achieved and how |
| Risk | The team's own rating |
| Status | Where the finding has got to |
The only row action is Delete Vulnerability. Findings are entered by the team as they work and edited in place, so there is no separate edit dialog to open.
Validation statusesSaved, Submitted, Approved, Closed, False Positive — the same five as
Application Security, in this module's own table.
Why the findings read differently
A scanner finding names a weakness. A red team finding names an outcome — domain admin obtained, customer data reachable, a payment altered — and then explains the path that produced it.
That has two consequences for anyone supporting this module:
- Risk is judged, not derived. There is no CVSS score behind it. The team rates the finding on what it let them do, so two findings with identical technical severity can be rated differently and both be right.
- The path matters more than the endpoint. A finding that chains four low-severity weaknesses is the point of the exercise, and closing any one link resolves it. Reading only the individual weaknesses misses what was actually demonstrated.
Detection is part of the result
A red team engagement tests the response as much as the estate. Whether the activity was noticed, by what, and how quickly, is recorded with the findings — and an engagement where nothing was detected is a significant result even if few technical weaknesses were found.
This is why the module has no SLA columns. A red team finding is not a queue item with a remediation clock; it is evidence for a decision about defensive capability.
Red Teaming: find the right screen
Every screen in this module, what each one is for, and where it lives. Use it to find the right screen quickly, and to confirm you are on the one a colleague means — several screens in this product have similar names and different jobs.
Screenshots come from a demonstration data set, so the figures are illustrative. Click any screenshot to open it at full resolution.
Red Teaming Findings
What an engagement achieved and how — attack paths rather than a list of weaknesses.
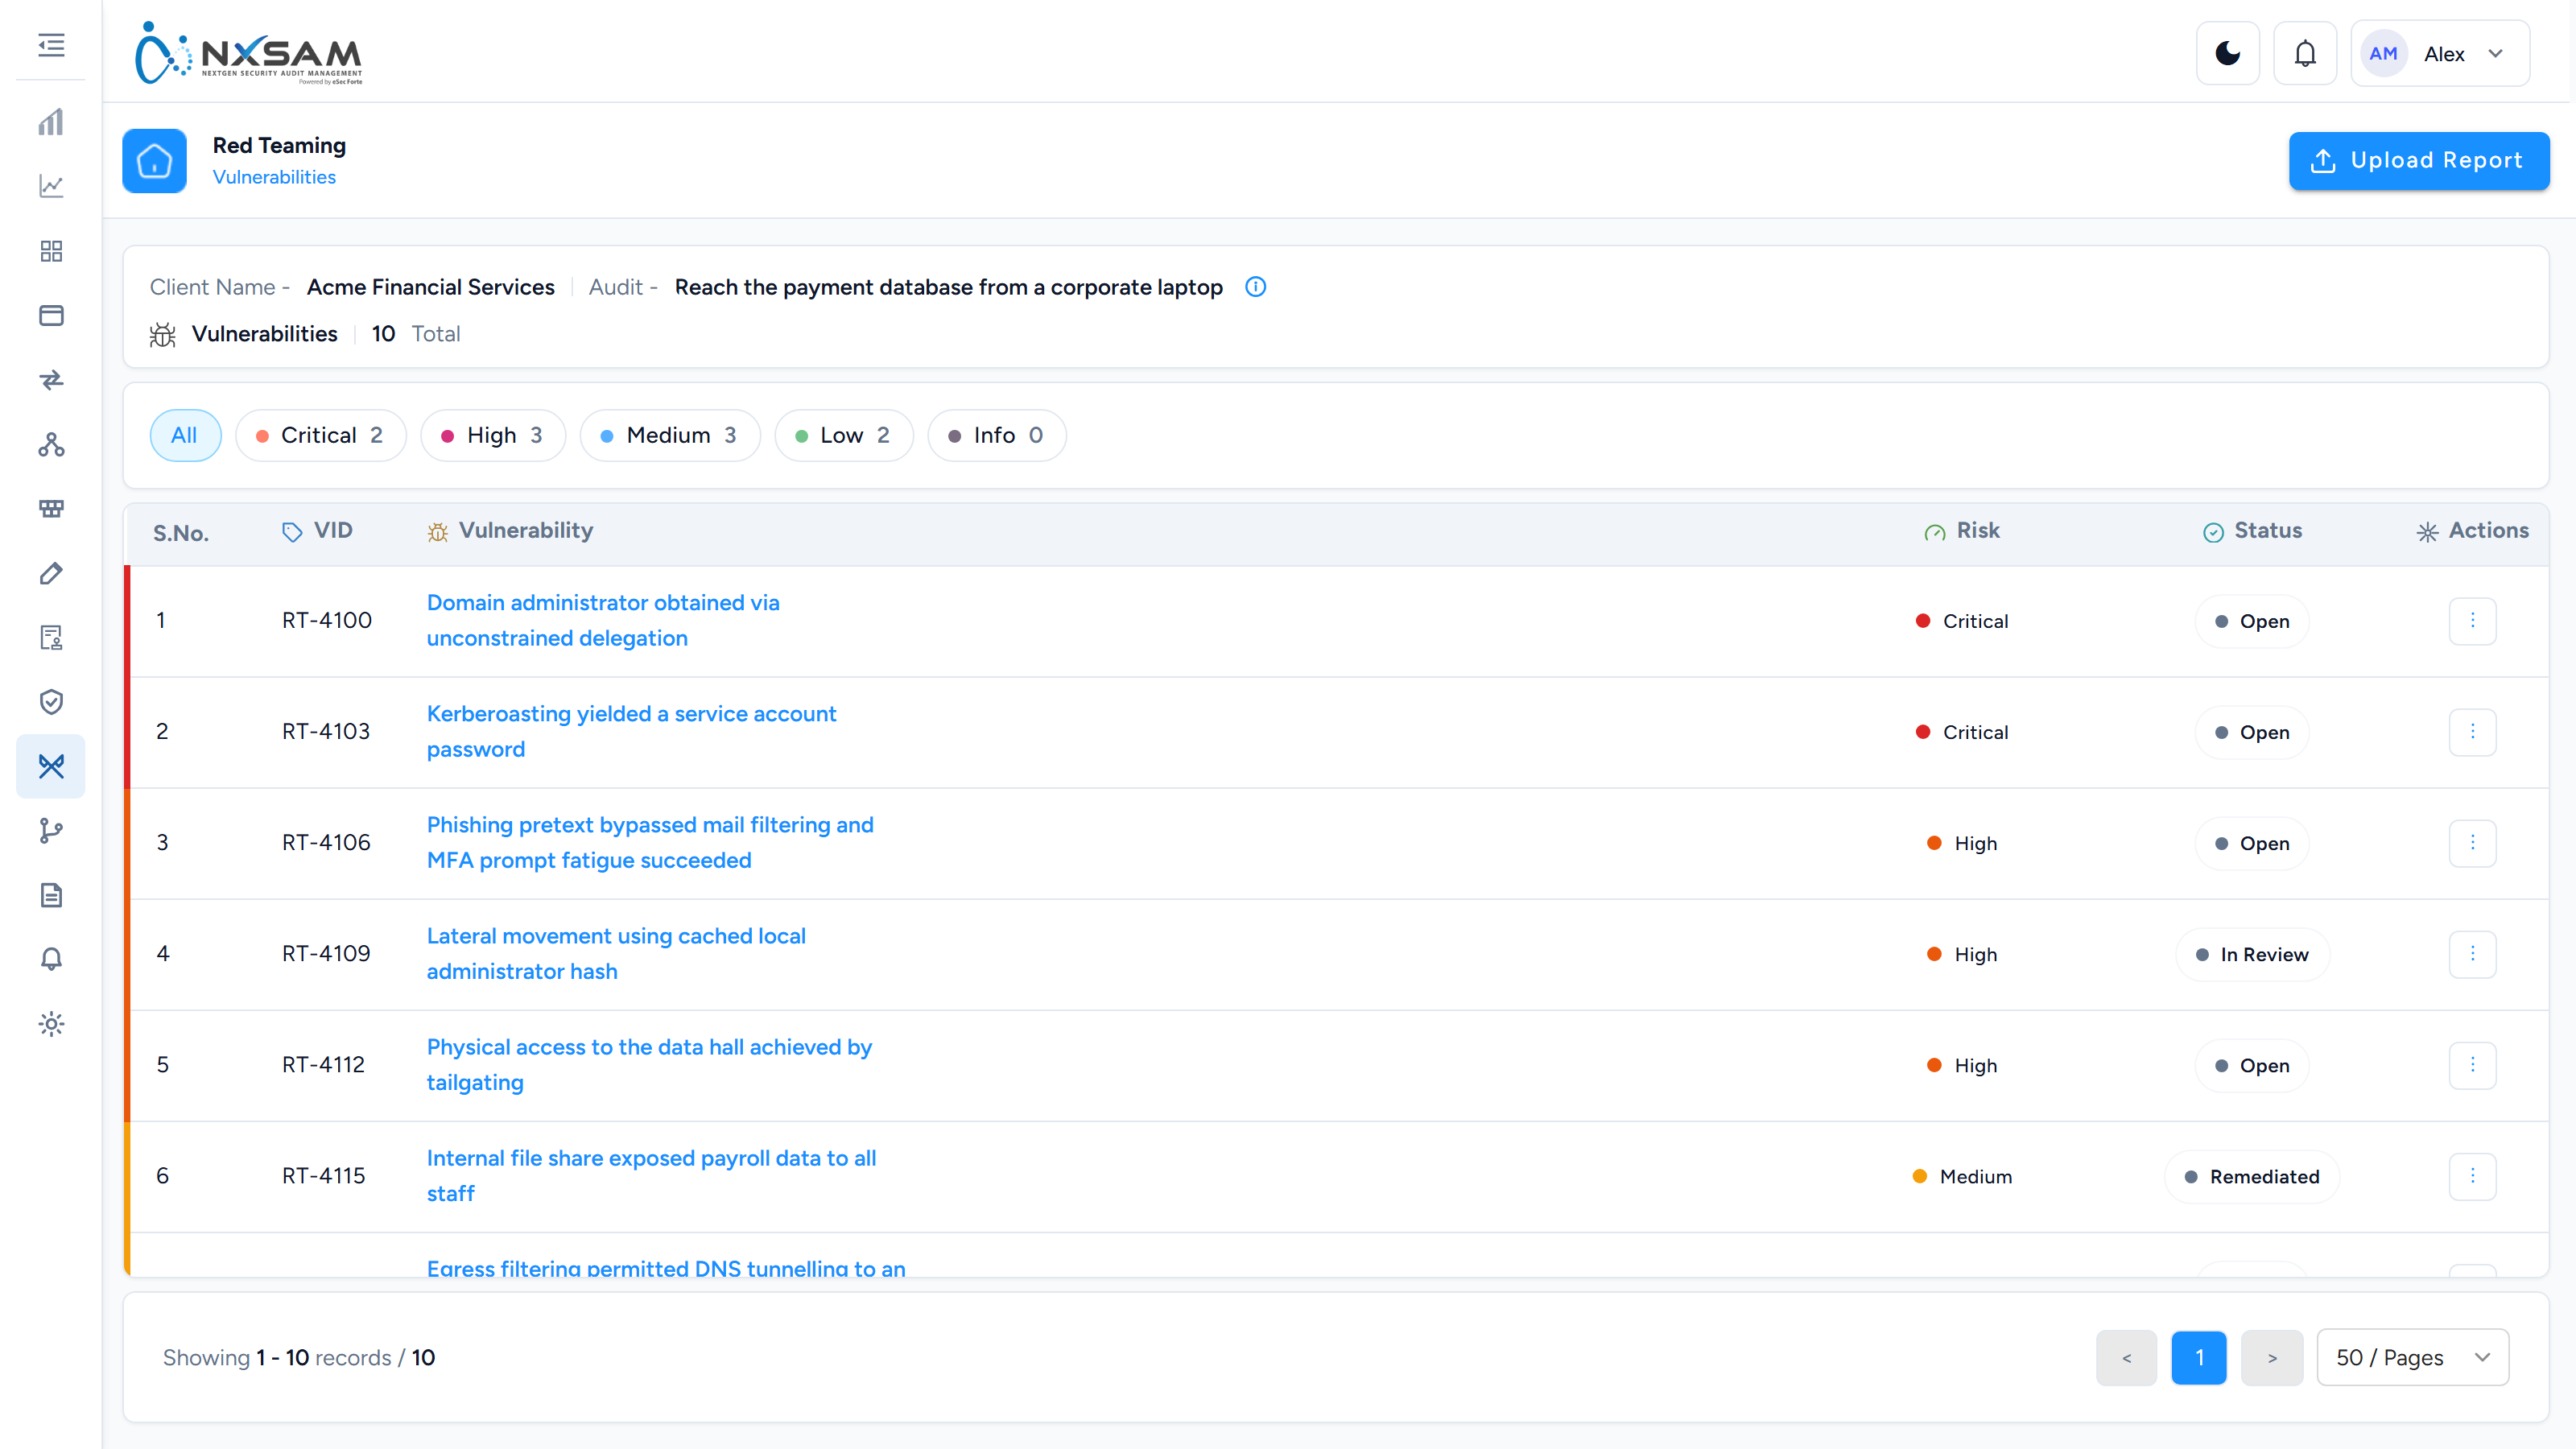
Red Teaming: support reference
Internal. The customer-facing explanation is in the screen reference.
The smallest module in the product, and deliberately so. A red team engagement produces a narrative and a handful of findings rather than a scanner's inventory, so the module records the engagement and its outcomes rather than trying to model the exercise.
Findings are reached through the engagement
The vulnerabilities screen is opened from an audit. Navigating to it directly — from a bookmark, or an old link — returns to the audit list, because there is no engagement to show findings for.
A caller reporting that "the vulnerabilities page keeps bouncing me back" is describing that behaviour, not a fault.
Its statuses are its own
Red Teaming carries its own validation status list, separate from Application Security's and from Network Security's. Quoting a status from another module may name a value this one does not have.
The confirmation dialog here also differs from the other modules', which is cosmetic but worth knowing when comparing screenshots.
Volumes are small on purpose
An engagement with eight findings is normal. Low counts are not evidence that an import failed — there is usually no import at all, because findings are recorded by the team that ran the exercise.
If a customer expects scanner-scale numbers here, the expectation is the problem.
Reports carry the narrative
The value of a red team engagement is the attack path, not the finding count. Where the narrative lives in an uploaded report rather than in the findings, the module holds the report and the findings summarise it.
What to collect before escalating
- The engagement (audit) name and ID.
- The finding's identifier and its status, quoted — this module's list is its own.
- Whether the caller reached the findings screen from the engagement or directly.
- Whether the engagement's report has been uploaded, for narrative questions.
RLCM
RLCM — Regulatory & Line Compliance Management
RLCM is where compliance work lives. Where the security modules ask what is wrong with our systems, RLCM asks can we demonstrate that we meet our obligations — to a regulator, a standard, or an internal policy.
The building blocks
| What it is | |
|---|---|
| Control | A single thing you must do — "access is reviewed quarterly". The atom of compliance. |
| Template | A reusable set of controls, typically representing a standard or a regulation. |
| Audit | One assessment against a template, at a point in time. |
| Assessment | The act of going through an audit's controls and recording how you fare on each. |
| Finding | A control that is not adequately met. |
| Risk register | Risks arising from those gaps, tracked over time. |
| Framework | An external standard or regulation broken into its own requirements, each mapped to the controls that satisfy it. |
The relationship: a template defines controls; an audit applies a template to a part of your organisation; an assessment records the answers; findings capture the gaps; the risk register tracks what those gaps mean.
Why templates matter
Most organisations answer to several frameworks at once, and those frameworks overlap heavily. Templates let a control be defined once and reused, so evidence gathered for one obligation can serve another.
Master controls are maintained centrally, and templates draw on them. Improving a control definition improves every template using it.
Frameworks: answering many standards with one set of controls
Most organisations are held to several standards at once, and the standards overlap heavily — access review, incident response and change control appear in nearly all of them under different numbering. Assessing each standard separately means answering the same question several times and keeping several sets of evidence.
The Common Control Framework screens exist to avoid that. A framework is loaded as its own list of requirements — the clauses of the standard, with the standard's own reference codes — and each requirement is mapped to the controls in your library that satisfy it. You then assess the controls once, and every framework mapped to them reads the result.
Three things follow, and each has a screen:
- Frameworks — which standards you hold yourself to, their version, who issued them, how many requirements each has, and what proportion of those requirements are mapped to at least one control. That proportion is the framework's Compliance %.
- Requirements — the clauses of one framework, by section, each showing how many controls it is mapped to. A requirement mapped to nothing is a gap: a clause you are bound by and have no control for.
- Control map — for one requirement, the controls already mapped and the ones not yet mapped, with Map and Unmap between them.
Requirements can be typed in one at a time or uploaded as a CSV — the upload screen offers a sample file in the exact layout it accepts, and keeps a log of every upload with what it accepted and rejected.
Compliance % measures mapping, not passing
A framework at 100 % has a control for every requirement. It says nothing about whether those controls are met — that is what the assessments say. A framework can be fully mapped and badly failed, or thinly mapped and passing everything it covers. Read the two figures together.
How an audit runs
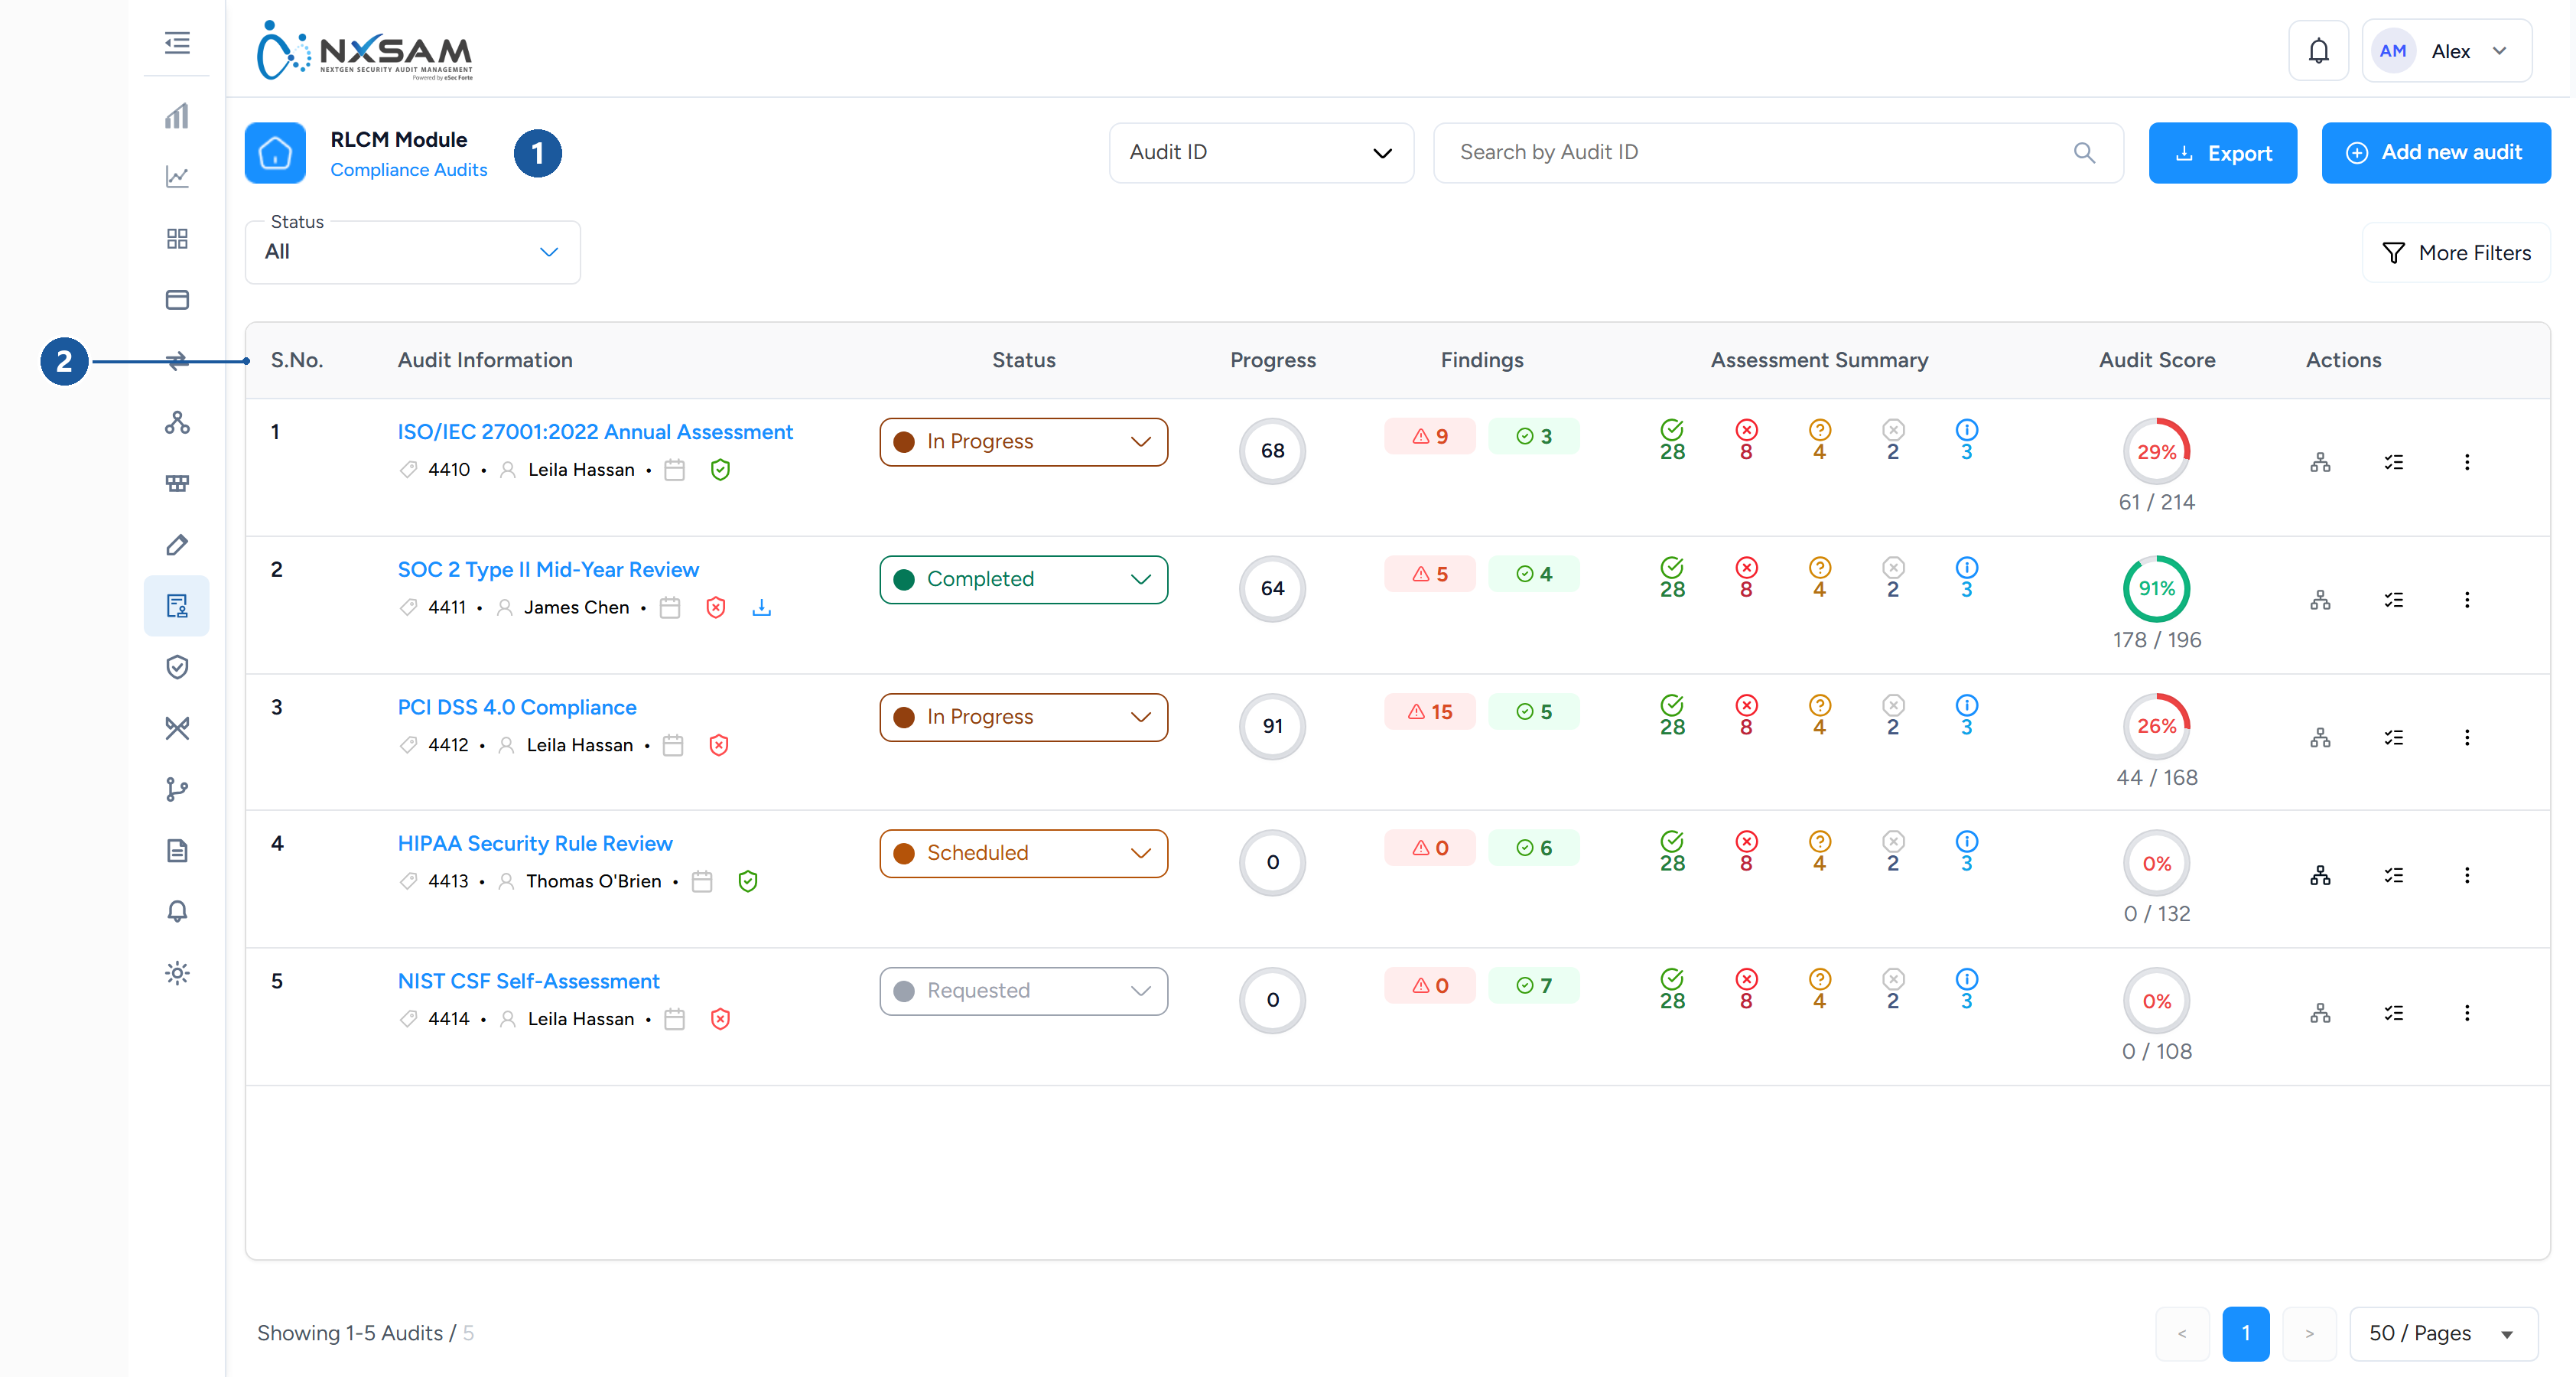
1 where you are · 2 audit and framework
- Create the audit from a template, scoped to whatever you are assessing.
- Assess each control — met, not met, partially met, or not applicable — with evidence and commentary.
- Raise findings where controls are not adequately met.
- Track remediation against those findings.
- Close the audit when the assessment is complete.
Audits recur. Last year's audit stays as the record of that point in time; this year's is a new audit against the same template, which is what makes trend and improvement visible.
Findings here are not vulnerabilities
An RLCM finding is a control gap — something you cannot yet demonstrate. It is not a technical weakness in a system, and it is tracked separately from the security modules.
The two are related in practice: a control requiring timely patching is demonstrated by the SLA performance the security modules record. But they are separate objects with separate lifecycles, and conflating them causes confusion in reporting.
Risk register
Where a control gap represents ongoing exposure, it is recorded as a risk: rated, owned, and tracked until treated. This is the bridge between "we do not meet this control" and "here is what that means for the business and who is dealing with it".
Getting started
If you are new to RLCM, the useful order is: look at an existing template to see how controls are structured, then open a completed audit to see how those controls were assessed and what findings resulted. The structure is much clearer from a worked example than from the configuration screens.
Configuring risk in RLCM
RLCM scores compliance risk rather than technical severity, so it has its own scoring model — separate from the CVSS-derived severity used elsewhere in NxSAM. These screens define that model.
Why it is separate
A missing control is not a vulnerability. It has no CVSS score, no exploit, and often no technical impact at all — its significance is regulatory. Scoring it on the same scale as a remote code execution would be meaningless in both directions.
So RLCM keeps its own rating scale, its own status values, and its own weighting.
The pieces
| Screen | What it sets |
|---|---|
| Risk rating master | The scale itself — the levels a compliance risk can be rated at |
| Risk master status | The states a risk moves through as it is treated |
| Risk configuration | How ratings are assigned to findings |
| Risk score configuration | How individual ratings combine into an overall score |
| Risk property master | Additional attributes to record against a risk |
| Weight configuration | The relative weight of controls, sections or domains |

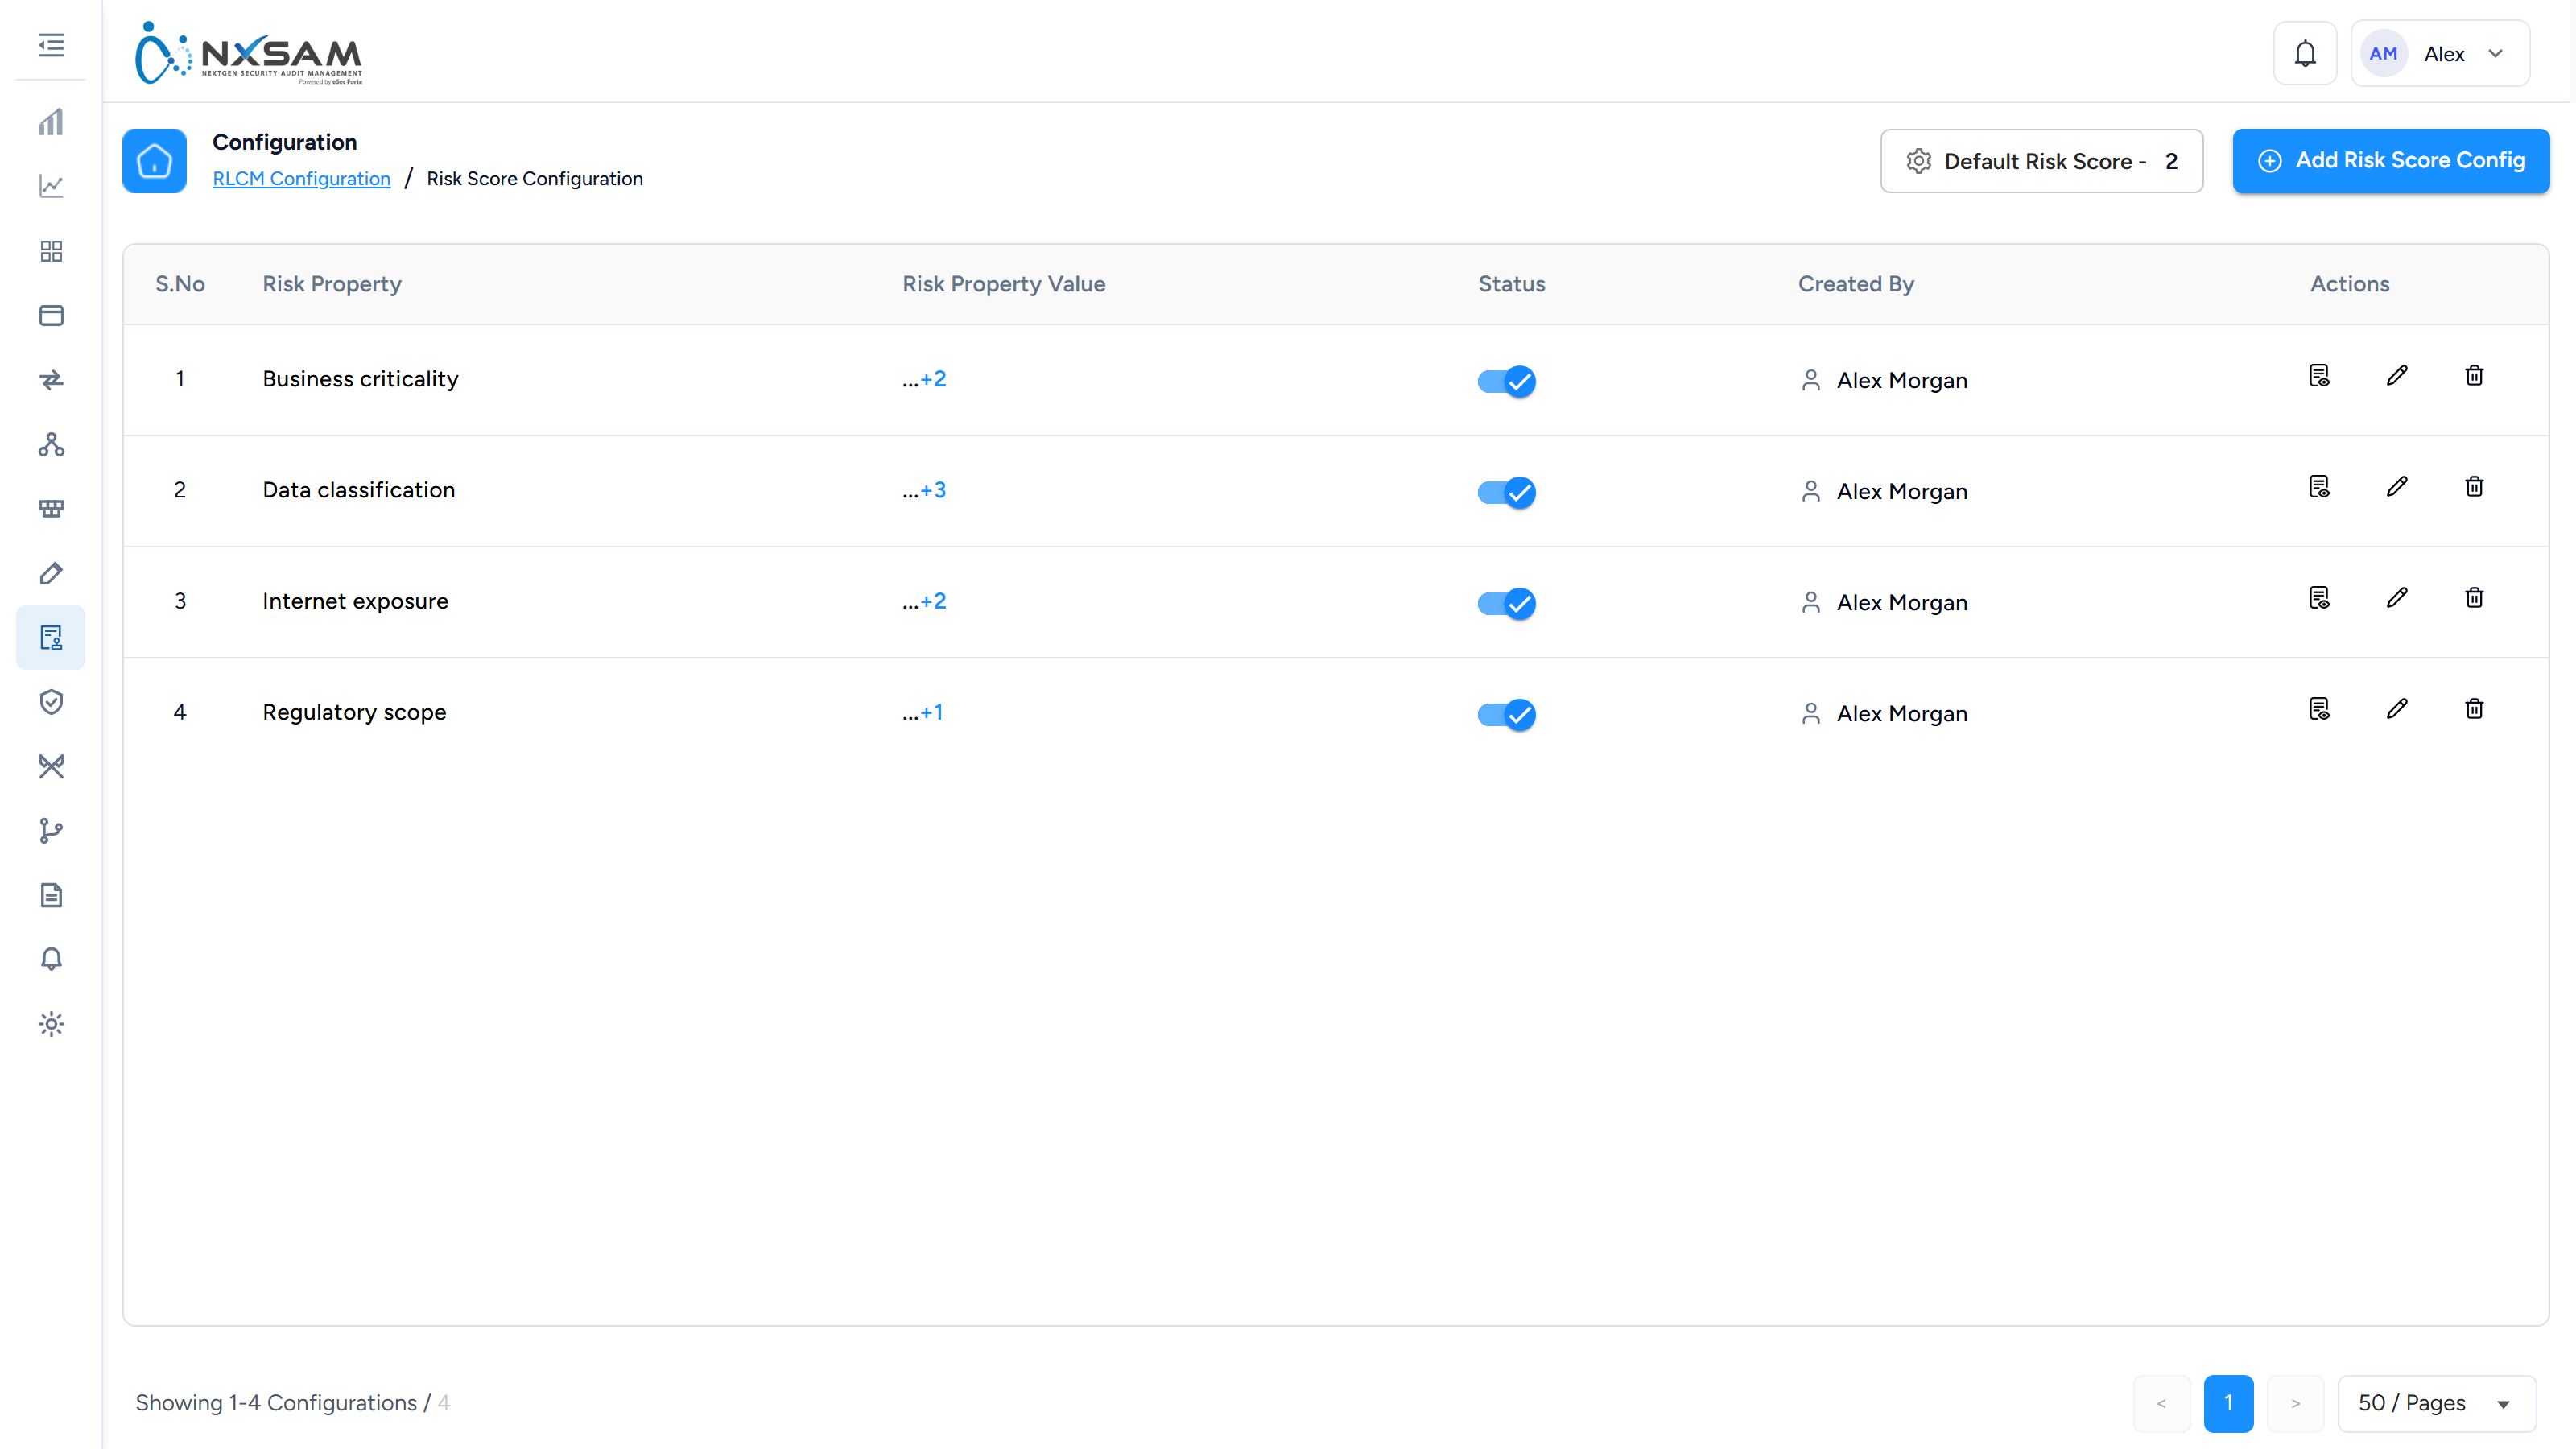
Weighting is what makes a score meaningful
Without weights, every control counts equally, and an audit is scored on the proportion of controls passed. That reads well and says little: failing a core access-control requirement counts the same as failing a documentation one.
Weighting lets a framework's own emphasis be reflected — so the score moves most when the things that matter most are failing. It is the difference between a score that tracks compliance posture and one that tracks paperwork volume.
Re-weighting changes historical scores
Scores are computed from the current configuration. Change the weights and previously completed audits will score differently when their score is next displayed.
If a trend line moves without any audit activity, a weighting change is the first thing to check.
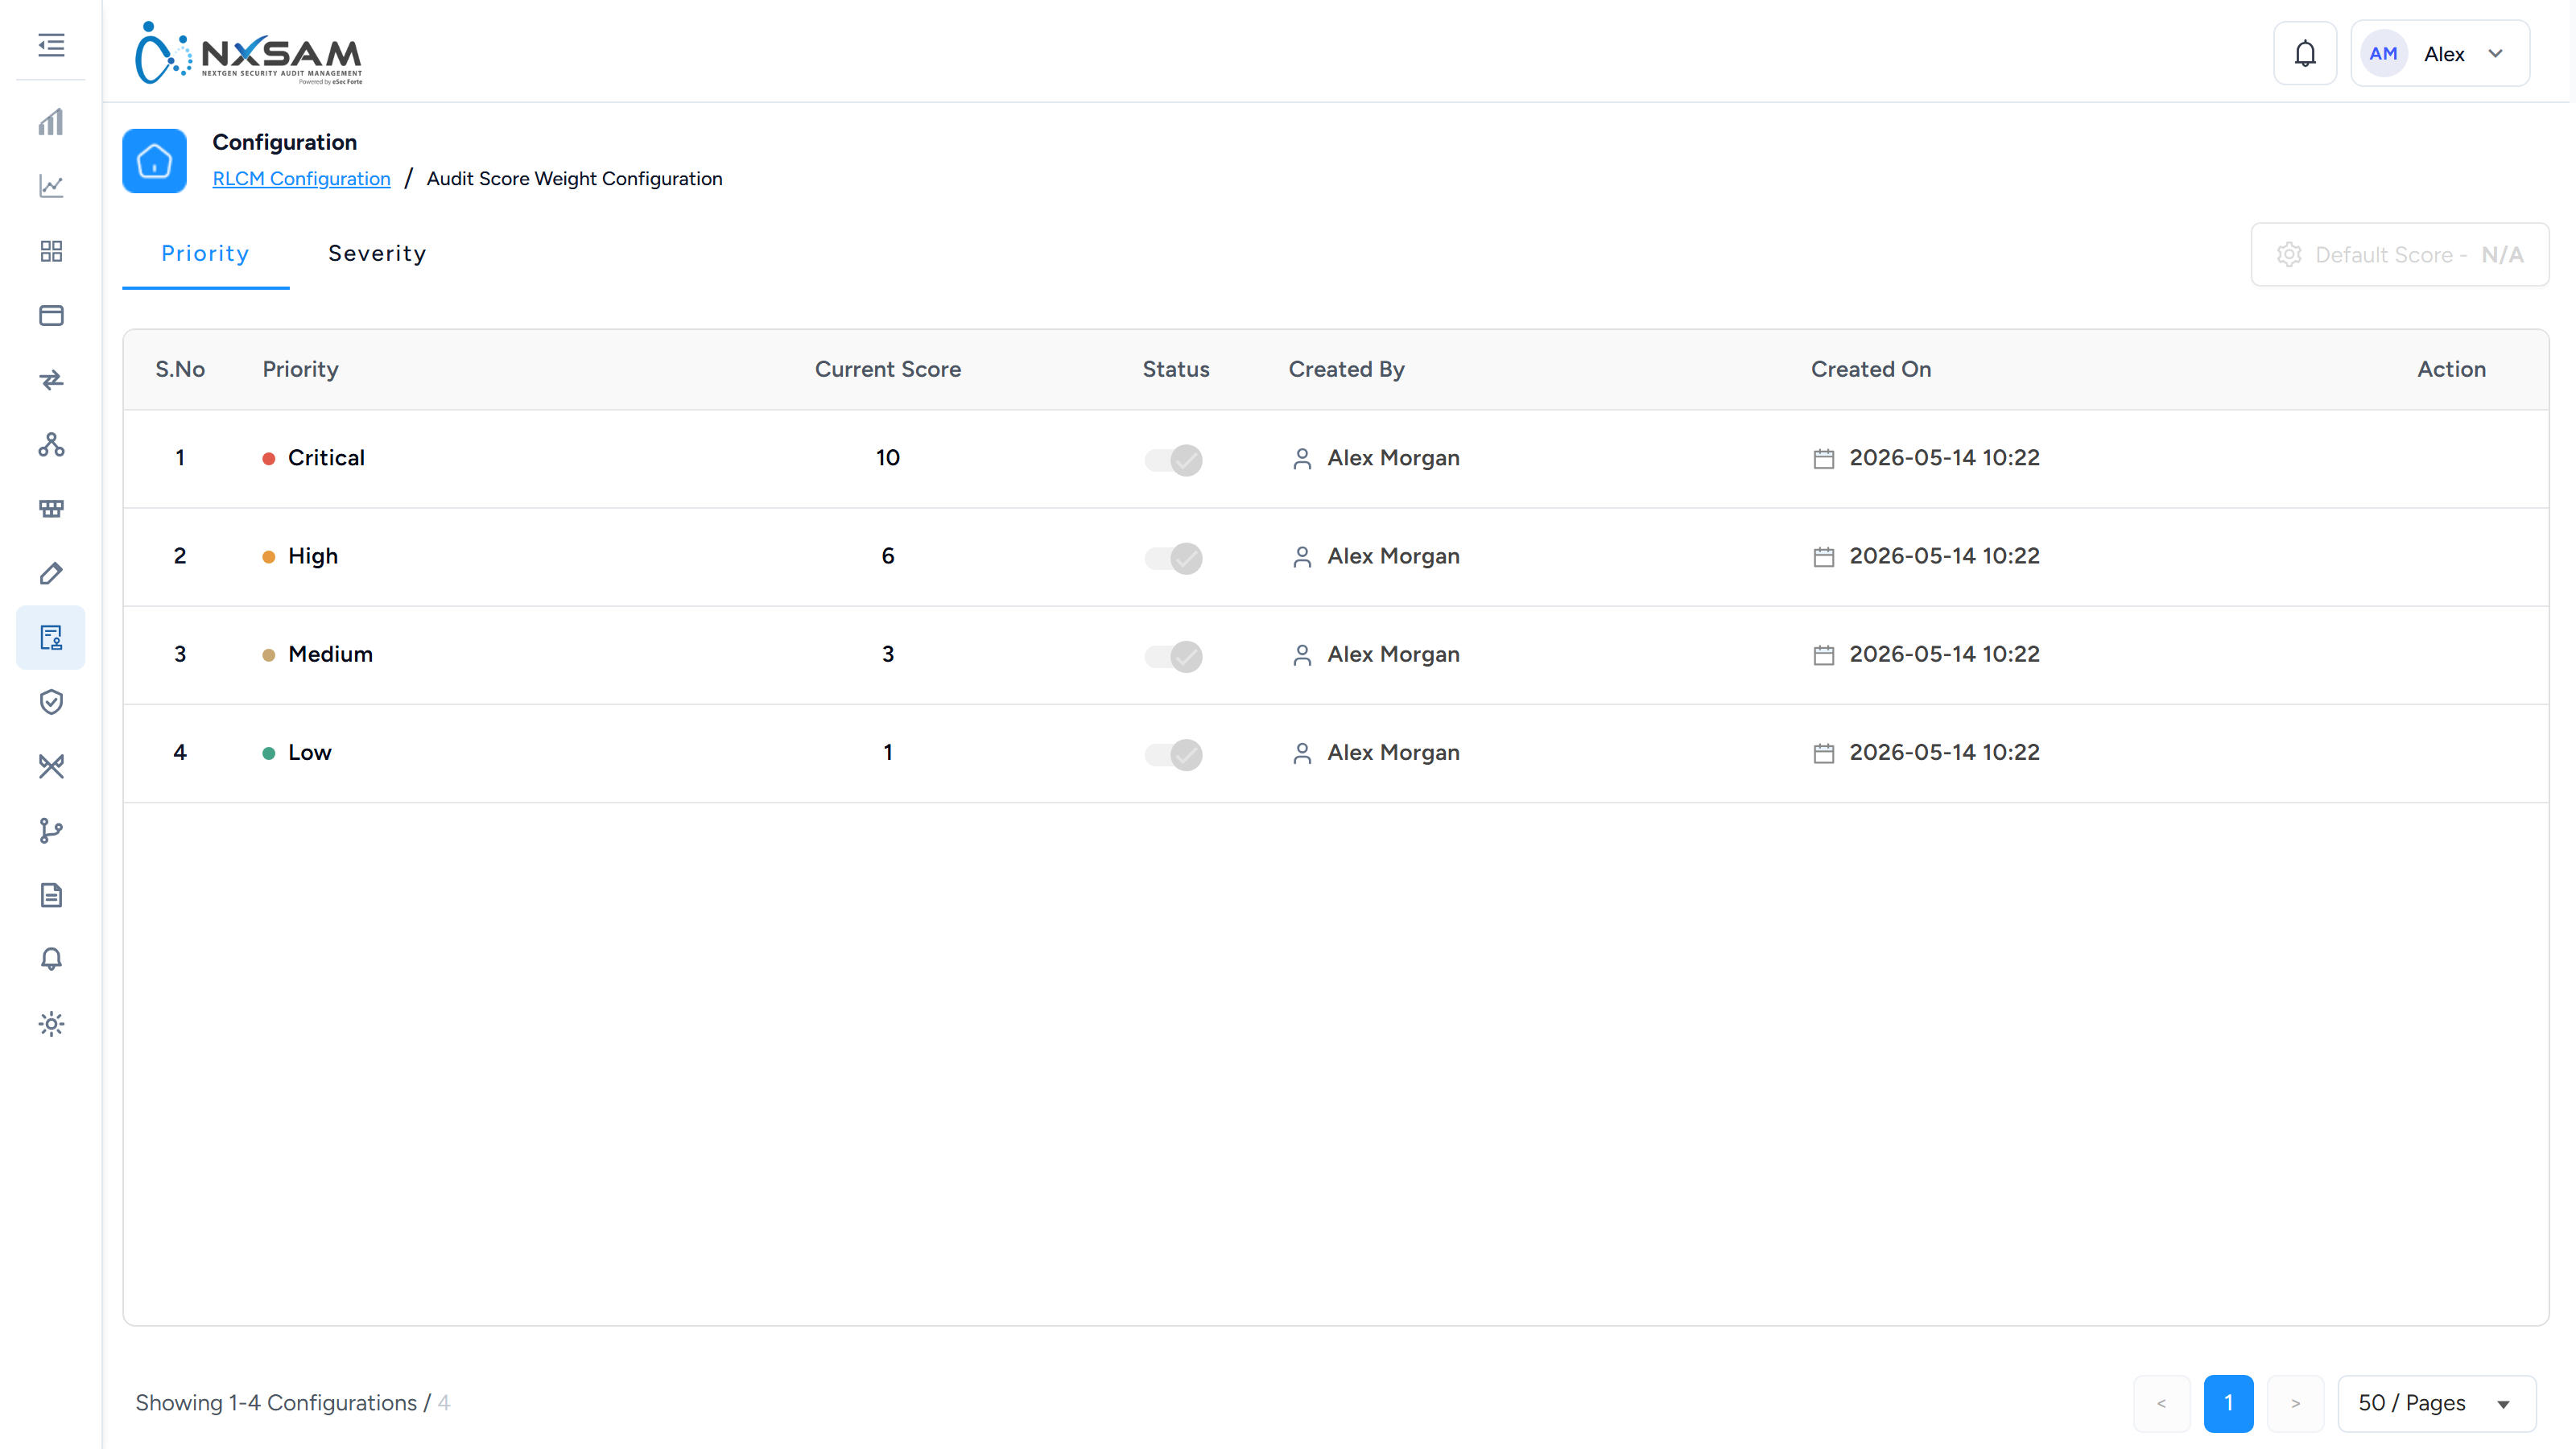
Vendor user form setting
Controls what an external vendor user sees and can fill in when responding to a TPRM assessment. Vendor users are outside your organisation, so this is a disclosure decision as much as a usability one — anything exposed here is visible to a third party.
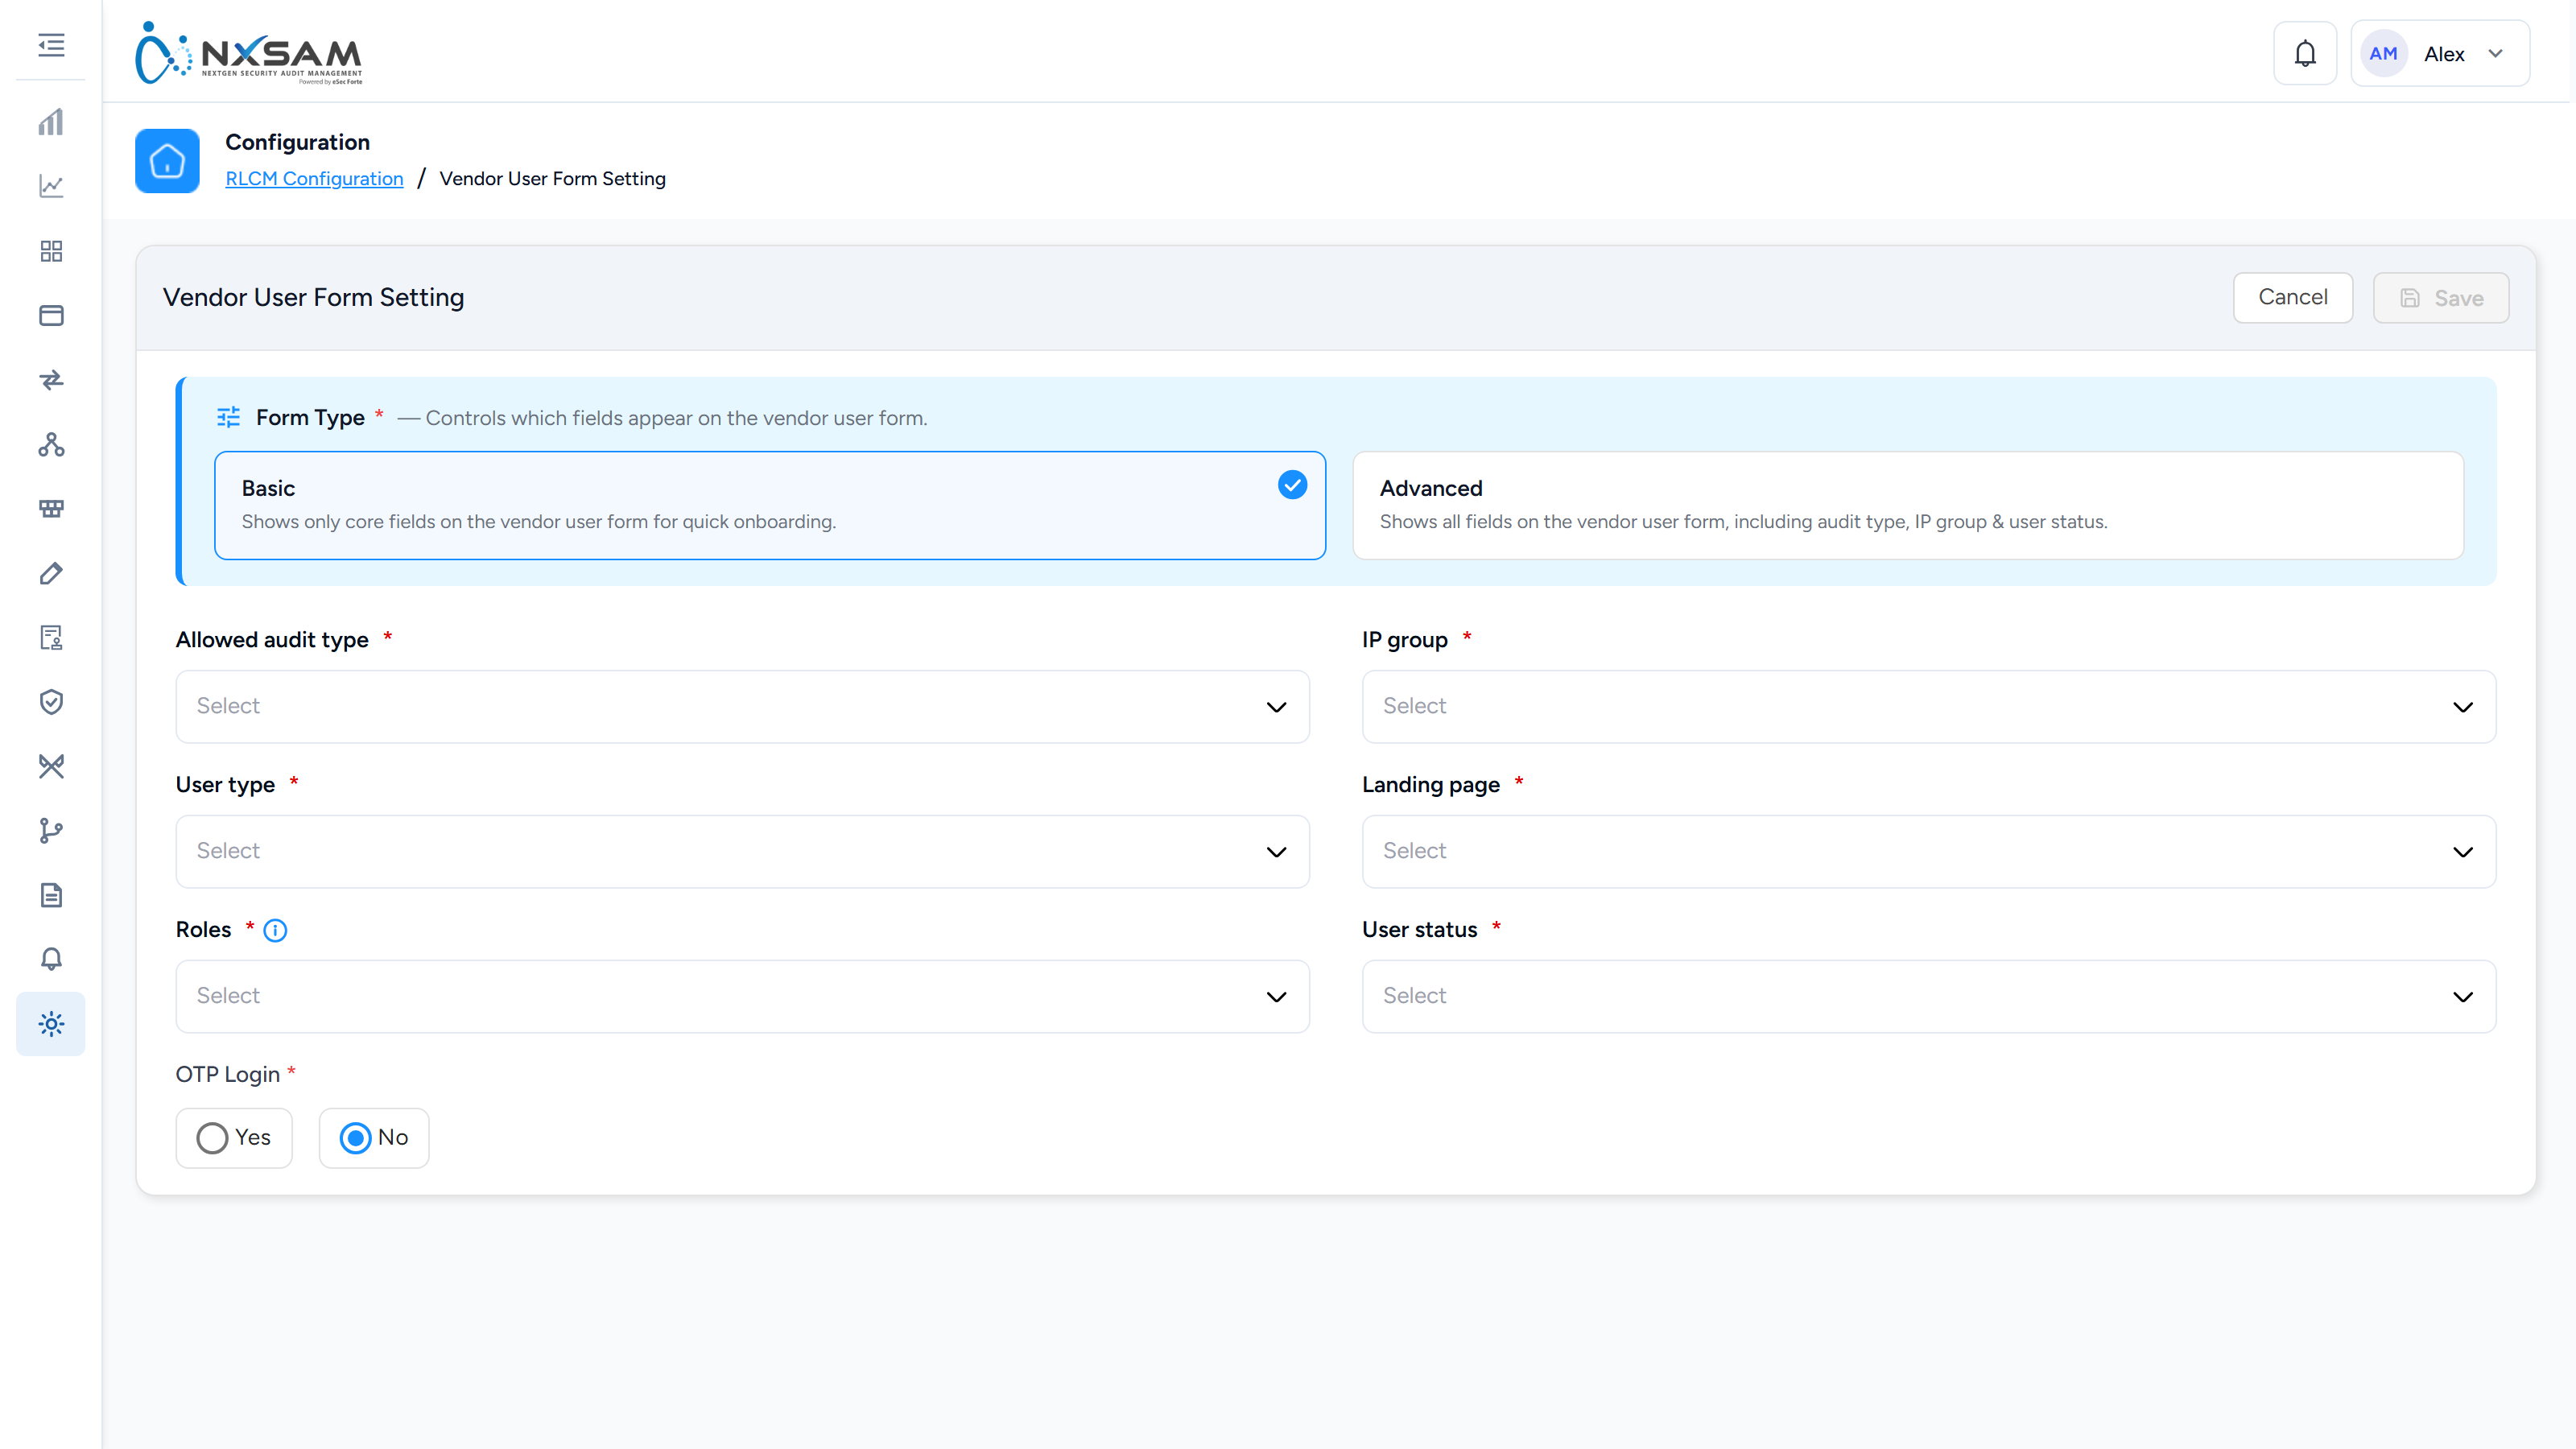
Recurring assessments
Schedules assessments to be raised automatically — annually, half-yearly or quarterly — against a template and category, for a vendor or for the organisation itself. When the date arrives the audit is created with its default POC, reviewer and auditor already assigned, and appears in the audit list like any other.
This is what turns "we assess our critical suppliers every year" from an intention into something that happens without anyone remembering. Pending First Cycle is how you tell the difference between the two: a configuration that is active but has never run has not proved anything yet.
The panel is titled Purging Configurations
Nothing on this screen deletes data. Every control on it creates or schedules an assessment; the heading is misleading rather than a hidden behaviour.
RLCM: every screen, column and action
The module has a three-role review model that nothing else in the product uses, and most of its screens are shaped around it.
POC, Reviewer, Auditor — the three inputs
A control is answered three times, by three roles, and all three answers are kept:
| Role | Provides |
|---|---|
| POC | The point of contact for the control — the person who owns the process being assessed |
| Reviewer | An internal check of that answer |
| Auditor | The independent conclusion |
The control screens carry a column per role: POC Input, Rev Input, Auditor Input,
and a Control status details view showing POC, REVIEWER, AUDITOR side by side.
Disagreement between the three is the point, not a fault
A control where the POC says compliant and the auditor says not is exactly what the model is for. The three columns preserve that disagreement rather than overwriting it, which is what makes the assessment defensible later.
NA on the control-management table marks a control the POC has declared not
applicable — which the reviewer and auditor can still disagree with.
Assessments
| Screen | Columns |
|---|---|
| Assessment list | Audit ID, Audit Details, Status, Last Status Update, Control Status |
| Assessment detail | Sections, Control Details, POC response, Control Status |
| Assessment detail (v2) | Sections, Control Details, Current Level, User Input, and the AI Evidence Analysis Status with its AI Score where AI evidence analysis is switched on |
| Audited controls | Section, Control, Current Level, POC Input, Rev Input, Auditor Input |
| Control management | Sections, Control Details, Status, POC, Reviewer, Auditor, NA |
Current Level is the maturity or compliance level currently claimed for the control, as distinct from pass/fail — RLCM assesses degree rather than a binary.
Row action: View Audit Finding.
Control Details carries what used to be two columns — the control's reference ID and its name — in one cell, reference first. Sorting and searching still work on either part.
AI evidence analysis
Where an administrator has enabled it, the assessment detail carries two extra cells per control: AI Evidence Analysis Status and AI Score. The platform reads the evidence uploaded against a control and suggests a compliance finding with a confidence score out of 100. The status is pending until that run completes, and shows failed — with the reason on hover — if the evidence could not be read.
Clicking the status opens the AI Evaluation: the AI Confidence Score, an AI Summary of what the evidence shows, and the AI Finding it suggests. The auditor's own form shows the same panel beside the answer, so the suggestion is read alongside the evidence rather than instead of it.
The AI evaluation is a suggestion to the auditor, not an answer
Nothing here records a result. The auditor's input is still the auditor's — the evaluation is there to make reading a large evidence pack faster, and a confidence score is a statement about how clearly the evidence supports the finding, not about whether the control is met. An auditor who disagrees with it should simply answer differently; the disagreement is preserved like every other disagreement in this module.
Evidence analysis runs on a schedule and within a per-audit spending cap that the administrator sets. A control that stays pending for a long time has usually run into that cap — see System: AI configuration.
Save response against Submit response
The assessment screen offers both, and they are not the same action:
| Button | Effect |
|---|---|
| Save response | Records the answer and leaves the control where it is |
| Submit response | Records it and advances the control to the next person |
| Reject | Sends the control back for rework, with the reason |
Saving is how a long questionnaire is worked over several sittings. Nothing moves, nobody is notified, and the answer is not visible as complete.
A saved response has not been submitted
This is the most common reason an assessment appears stalled with every control apparently answered. The answers exist; they were never submitted, so the control is still pending on the person who wrote them.
Pending On is the column that settles it — it still names the author rather than the next reviewer.
Where a screen offers a bulk submit, it applies the same advance to every selected control at once. Use it after working through a section; it does not save unsaved edits for you.
Audits
| Column | What it holds |
|---|---|
| Audit Information | The assessment |
| Status | Where it is |
| Progress | How much has been answered |
| Findings | How many failures it produced |
| Assessment Summary | The rolled-up result |
| Audit Score | The weighted score |
Progress and Audit Score answer different questions. Progress is how much of the work is done; score is how well it went. An assessment at 40% progress has a score computed from 40% of the controls, and it will move as the rest are answered — which is why an in-flight score should not be reported.
Findings and the risk register
Both share a shape:
| Column | What it holds |
|---|---|
| Finding ID / Audit & Finding Info | Identity and provenance |
| Control Details | Which control failed |
| Risk & Observations | What the failure means and what was observed |
| Status | Where the finding has got to |
Actions: Add Risk, Map Existing Risk, Status History, View Audit Finding History.
Add Risk and Map Existing Risk are the module's central decision
A control failure is not itself a risk — it becomes one when someone decides it matters. Add Risk creates a new entry in the register. Map Existing Risk attaches the failure to a risk already recorded.
Mapping is nearly always the right answer when the same weakness has been found before: one risk with six contributing findings is a register an executive can read, where six separate risks saying the same thing is not.
The control library
| Screen | Columns |
|---|---|
| Controls | Control Details, Answer & Comments, Process Groups / Standards, Priority |
| Master library | Control Details, Process Groups / Standards, Justification & Evidence |
| Library map | Control Details, Process Groups / Standards |
| Assessed controls | Name, Type, No. of Controls Mapped, Passed Controls, Failed Controls, Failed Control Severity Wise |
Justification & Evidence on the master library is what makes a control reusable. The evidence recorded once against the master answers the same control wherever it appears — which is the whole economics of the unified control framework.
Standards, sections and templates
| Screen | Columns |
|---|---|
| Standards | Standard Name, Created By |
| Sections | Reference ID, Section Name, Section Description, Total Controls, Total Sub Sections, Sequence |
| Section controls | Control Details, Answer & Comments, Process Groups / Standards, Skip Rule, Sequence |
| Templates | Template Details, Category Name, Total Controls, Total Sections, Organization, Created By |
| Audit categories | Category Name, Template Count, Audit Type, Created By |
| Domains | Domain Name, Created By |
| Process groups | Process Name, Created By |
| UCF | UCF, Control Count, Created By |
Template actions: View Template Details, Edit Template Details, Clone Template, Export Template, Delete Template.
Clone Template is how a standard gets tailored without losing the original. An organisation adapting ISO 27001 to its own scope clones the template and edits the copy; editing the original changes every assessment that uses it.
Sequence on sections and controls sets reading order in the assessment and the report. It is not cosmetic — an assessment presented out of order is materially harder to review.
Template Details and Control Details each fold a reference ID and a name into one cell. Answer & Comments on a section's controls shows what kind of answer the control demands and whether a comment is mandatory; Process Groups / Standards shows what the control is tagged with, collapsing to a count when there are many. Skip Rule marks a control that a skip rule can hide from an assessment — either because the rule is defined on this control, or because this control is one the rule hides — so a control that is "missing" from an assessment can be checked here before anyone assumes it was deleted.
Common control framework (CCF)
Three screens, reached in sequence: a framework, its requirements, and the control map for one requirement. Their purpose is explained in the overview; this is what is on them.
Frameworks
| Column | What it holds |
|---|---|
| Framework | The standard's name and your reference ID for it |
| Ver. | Which edition or year |
| Type | The kind of standard |
| Authority | Who issues it — ISO, NIST, a regulator |
| Req. | How many requirements it has |
| Compliance % | The proportion of requirements mapped to at least one control |
| Status | Active or inactive |
| Actions | View the requirements, Edit, Delete |
Add Framework asks for the framework name, a reference ID, the authority, type,
version, a description, an Initial status, and two periods: the Validity period in
months (12 by default) and the Warning period in days before expiry (30 by default).
The reference ID accepts letters, numbers and . _ - only.
Frameworks marked as a System Framework ship with the product and cannot be edited or deleted; their requirements are likewise marked System Requirement. Everything you add yourself can be.
Requirements
One framework's clauses. The header cards give the framework's shape at a glance: Total requirements, Mapped to controls, Unmapped (gaps) and Avg controls / req.
| Column | What it holds |
|---|---|
| Ref. Code | The standard's own numbering for the clause |
| Section | Which part of the standard it sits in |
| Requirement | The clause, with its full description on the detail |
| Mapped Controls | How many controls satisfy it |
| Coverage | Whether it is mapped at all |
| Actions | Open the control map, Edit, Delete |
Add Requirement takes the reference ID (the standard's own code, such as a clause number), a requirement name, its section, a group, and the description. Upload CSV loads many at once — Download Sample gives the accepted layout, and the upload keeps Requirement Upload Logs recording what each run accepted and rejected. Export Requirements downloads the list.
Unmapped (gaps) is the number to work down. Every requirement in it is a clause you are held to and have no control for. It is also the number an external assessor will ask about first, because it is the one that cannot be argued.
Control map
Two lists for one requirement: Mapped Controls and Unmapped Controls, with Map and Unmap to move a control between them and Select All for bulk moves. The unmapped list can be filtered by the control's priority and domain, so a requirement about access control can be mapped from the access-control controls without scrolling the whole library.
Mapping is reversible and does not touch the control or any assessment of it. What it changes is the framework's Compliance % and the requirement's Coverage, both of which update as soon as the map is saved.
Risk configuration
| Screen | Columns |
|---|---|
| Risk master | Risk Details, Status, Likelihood, Impact, Risk Level, Risk Score, Created By |
| Risk levels | Risk, Min Risk Score, Max Risk Score, Created By |
| Risk rules | Risk, Priority, Audit Property, Status, Created By |
| Risk score config | Risk Property, Risk Property Value, Status, Created By |
| Risk properties | Property Name, Property Type, Order, Required, Created By |
| Risk rating master | Risk, Colour, Risk Order |
| Risk master status | Risk Master Status, Colour, Status Order, Comment Required, Evidence Required, Closed Type |
| Score weighting | level, Current Score, Status, Created By, Created On |
Likelihood × Impact produces Risk Score, and Risk Levels turn that score into a band. Changing the band boundaries re-rates every existing risk immediately, with no assessment activity — the same trap as the CVSS mapping elsewhere in the product.
Evidence Required is enforced, and is the one that blocks people
A risk status flagged Evidence Required cannot be selected without an attachment. A user reporting that a status "does nothing" when clicked is usually hitting this, because the requirement is not stated until the save is attempted.
Comment Required behaves the same way, and Closed Type decides which statuses stop a risk counting as open.
The configuration viewers show the rules as they will evaluate: Audit Property,
Condition, Value for risk rules, and Value, Risk Score for scoring.
History and evidence
| Screen | Columns |
|---|---|
| Risk history | Auditor, Update On, Status |
| Risk master status history | Auditor, Status, Comments and Attachments |
| Closure document | Auditor, Status, Comments and Attachments |
| Finding summary | Status, Count |
Comments and Attachments is the audit trail an assessor is judged on. A risk closed with no attachment has no evidence that it was closed for a reason, and that is precisely what an external auditor samples.
Reporting from an assessment
Download Xls Report exports the assessment as a spreadsheet — the form compliance teams work in, because they annotate it and send it back to control owners.
Request New PDF queues a fresh PDF. It is a request rather than a download because the document is rendered in the background: the existing PDF stays available while the new one builds, and a report that "has not updated" is usually one whose regeneration has not finished.
Recurring assessments
Configuration, Client, Default Assignees (POC, Reviewer, Auditor), Frequency,
Starts From, Next Audit, Status, and a history of Raised On, Audit,
Raise Result, Audit Status.
Each row is a standing instruction to raise an assessment automatically on a frequency — annually, half-yearly or quarterly — against a chosen template and category, for a vendor or for the organisation itself. When the date arrives the audit is created with the default POC, reviewer and auditor already assigned, and appears in the audit list like any other.
The four figures across the top answer whether the schedule is actually working:
| Figure | What it tells you |
|---|---|
| Active Configurations | How many schedules are switched on, out of the total defined |
| Next Scheduled Audit | The date and configuration that will fire next |
| Last Auto-Created Audit | The most recent audit this screen produced |
| Pending First Cycle | Active configurations that have never yet run — the ones worth checking |
| Vendors Configured | How many of the vendors you can see have a schedule at all |
Raise Result in the history is the one to read after a date passes: a configuration can be active, reach its date, and still fail to raise — a deleted template or an assignee who has left will do it — and nothing else on the screen shows that.
The panel is titled Purging Configurations
It does not purge anything. Nothing on this screen deletes data — every control on it creates or schedules an assessment. The heading is misleading rather than a hidden behaviour, but it is alarming enough to be worth saying plainly.
Control similarity
Control Name, Broad Match, Precision Match, with a sync state showing when the index
was last refreshed.
Compares a new questionnaire against controls already assessed. Broad Match catches controls covering the same ground in different words; Precision Match is a close textual correspondence. A high broad match with a low precision match usually means the same requirement worded for a different framework — reusable evidence, different phrasing.
The Needs sync state means the index has not been rebuilt since controls changed, so matches will be stale.
RLCM: find the right screen
Every screen in this module, what each one is for, and where it lives. Use it to find the right screen quickly, and to confirm you are on the one a colleague means — several screens in this product have similar names and different jobs.
Screenshots come from a demonstration data set, so the figures are illustrative. Click any screenshot to open it at full resolution.
Assessed Controls
Controls that have been evaluated, with the evidence and the conclusion reached.
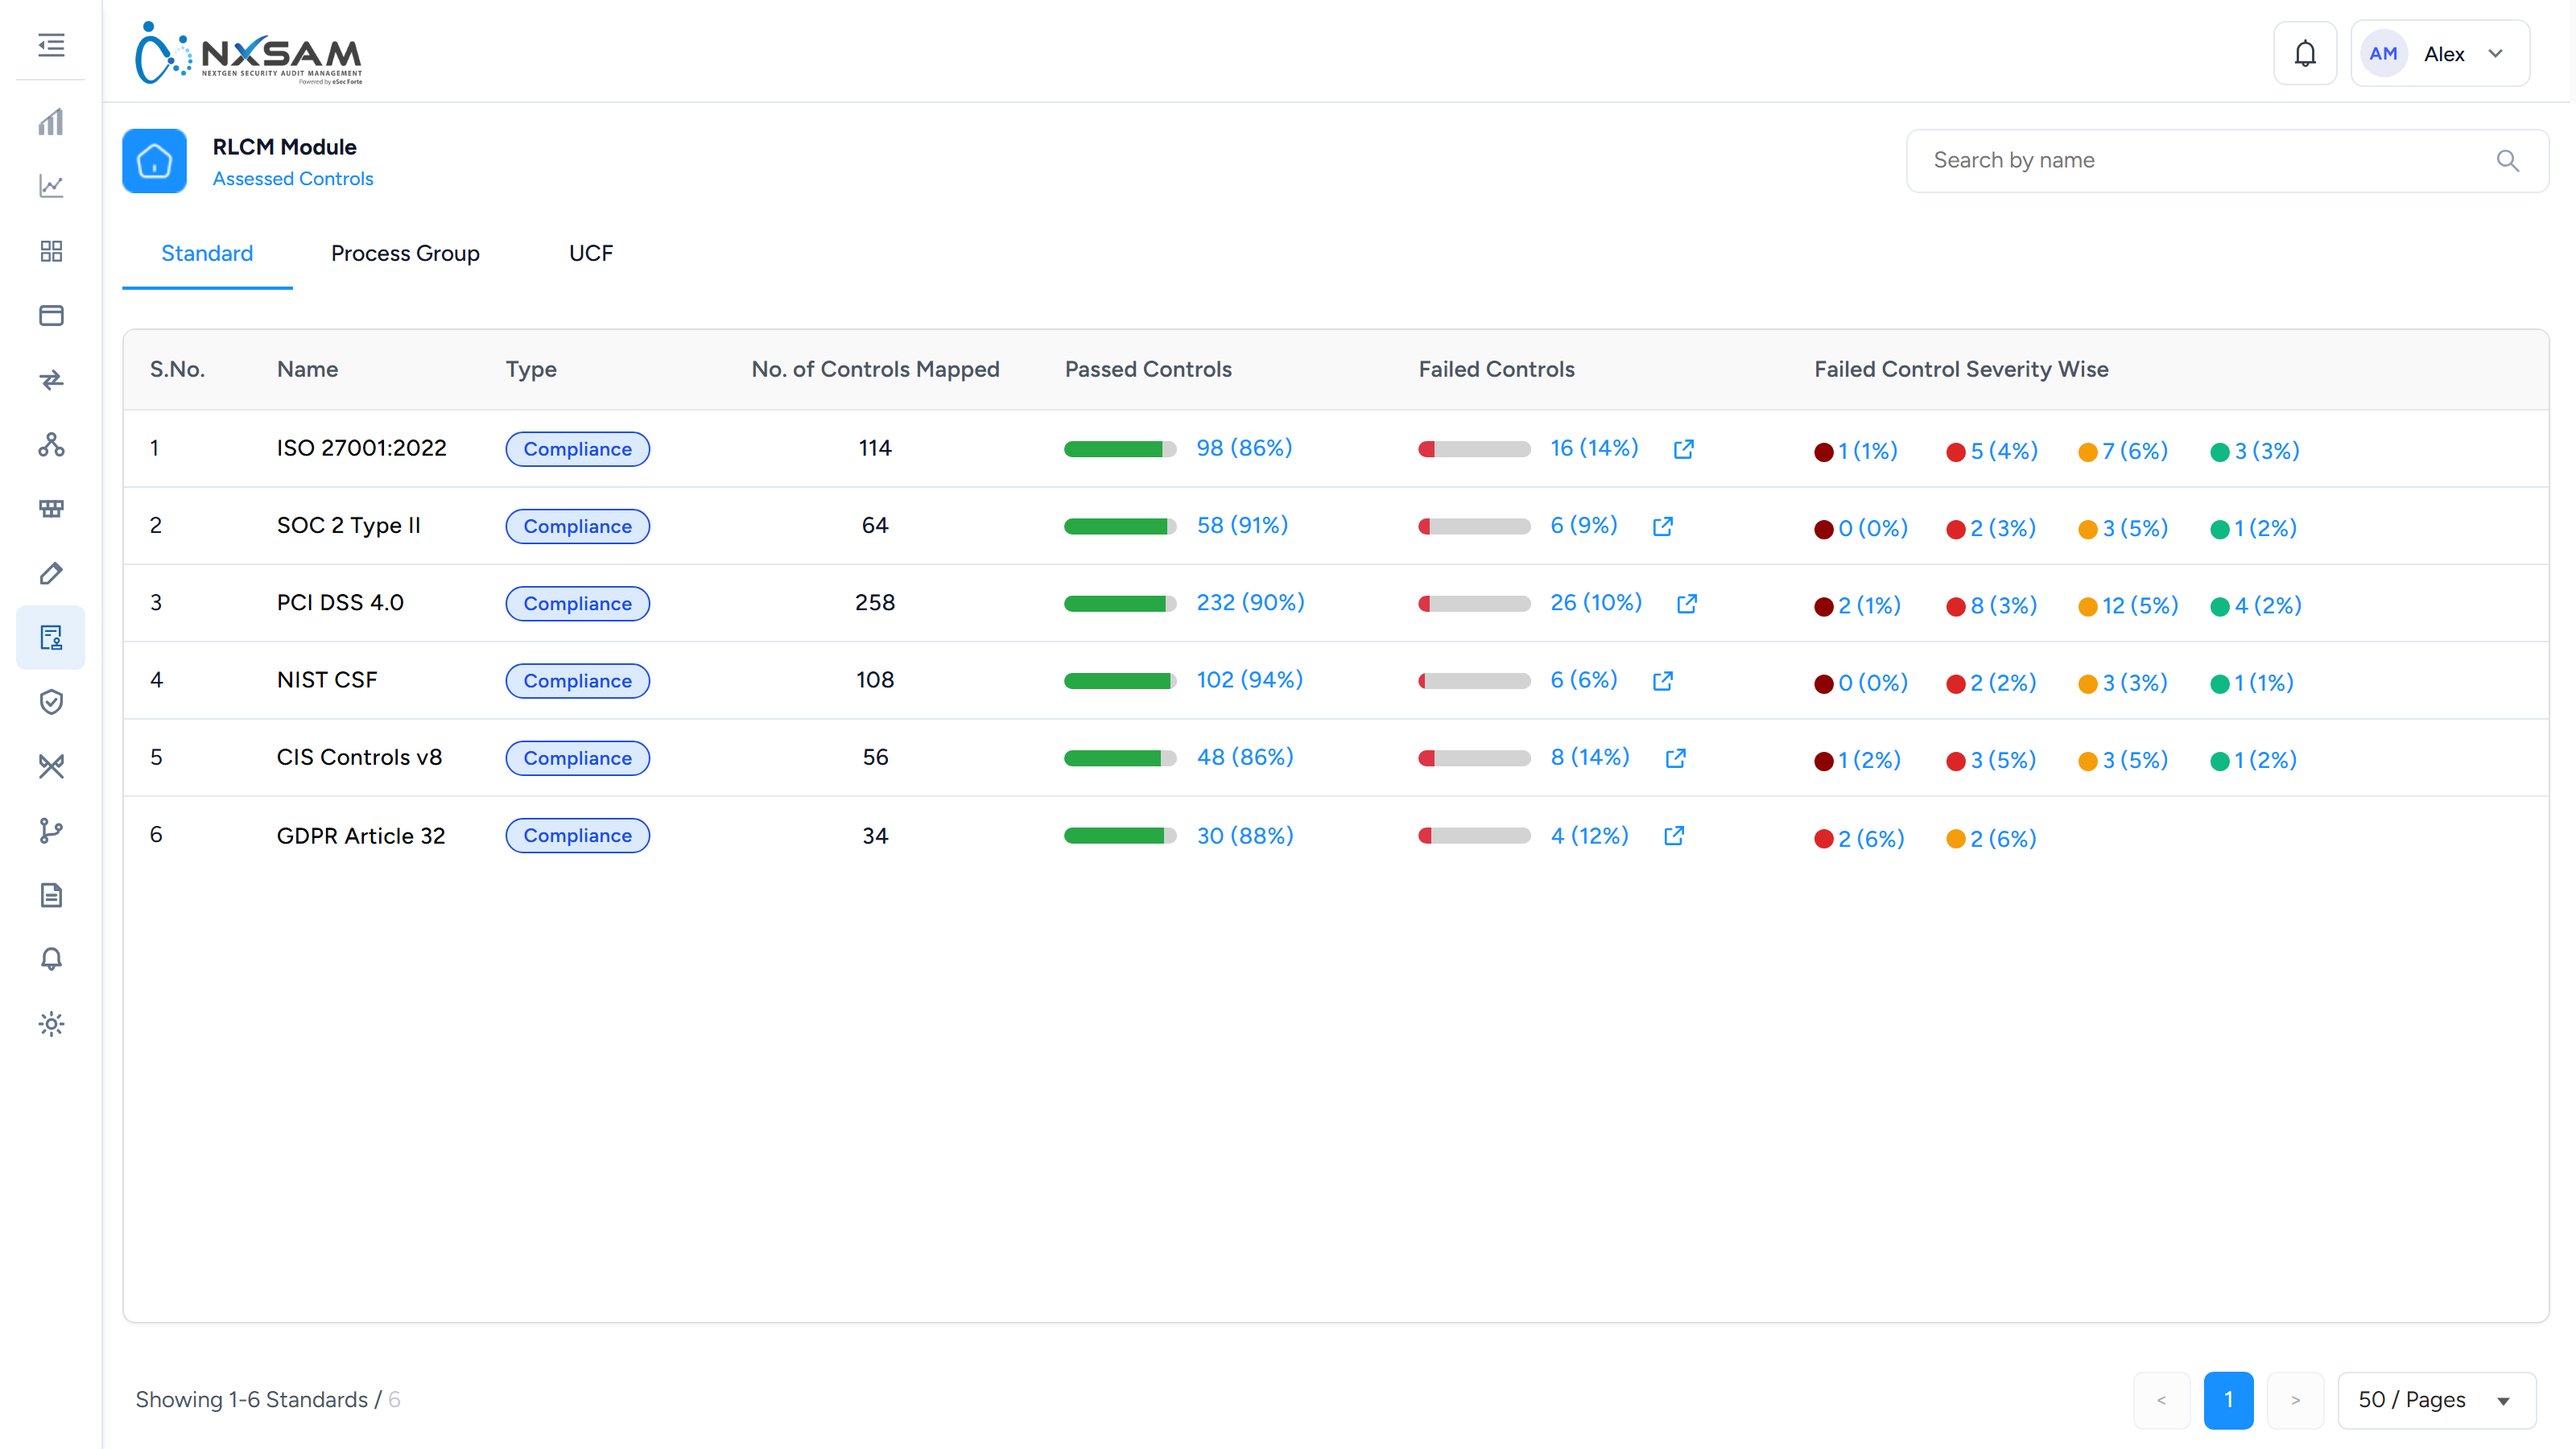
Assessment Templates
A reusable set of controls and questions, so two assessments of the same kind cover the same ground.
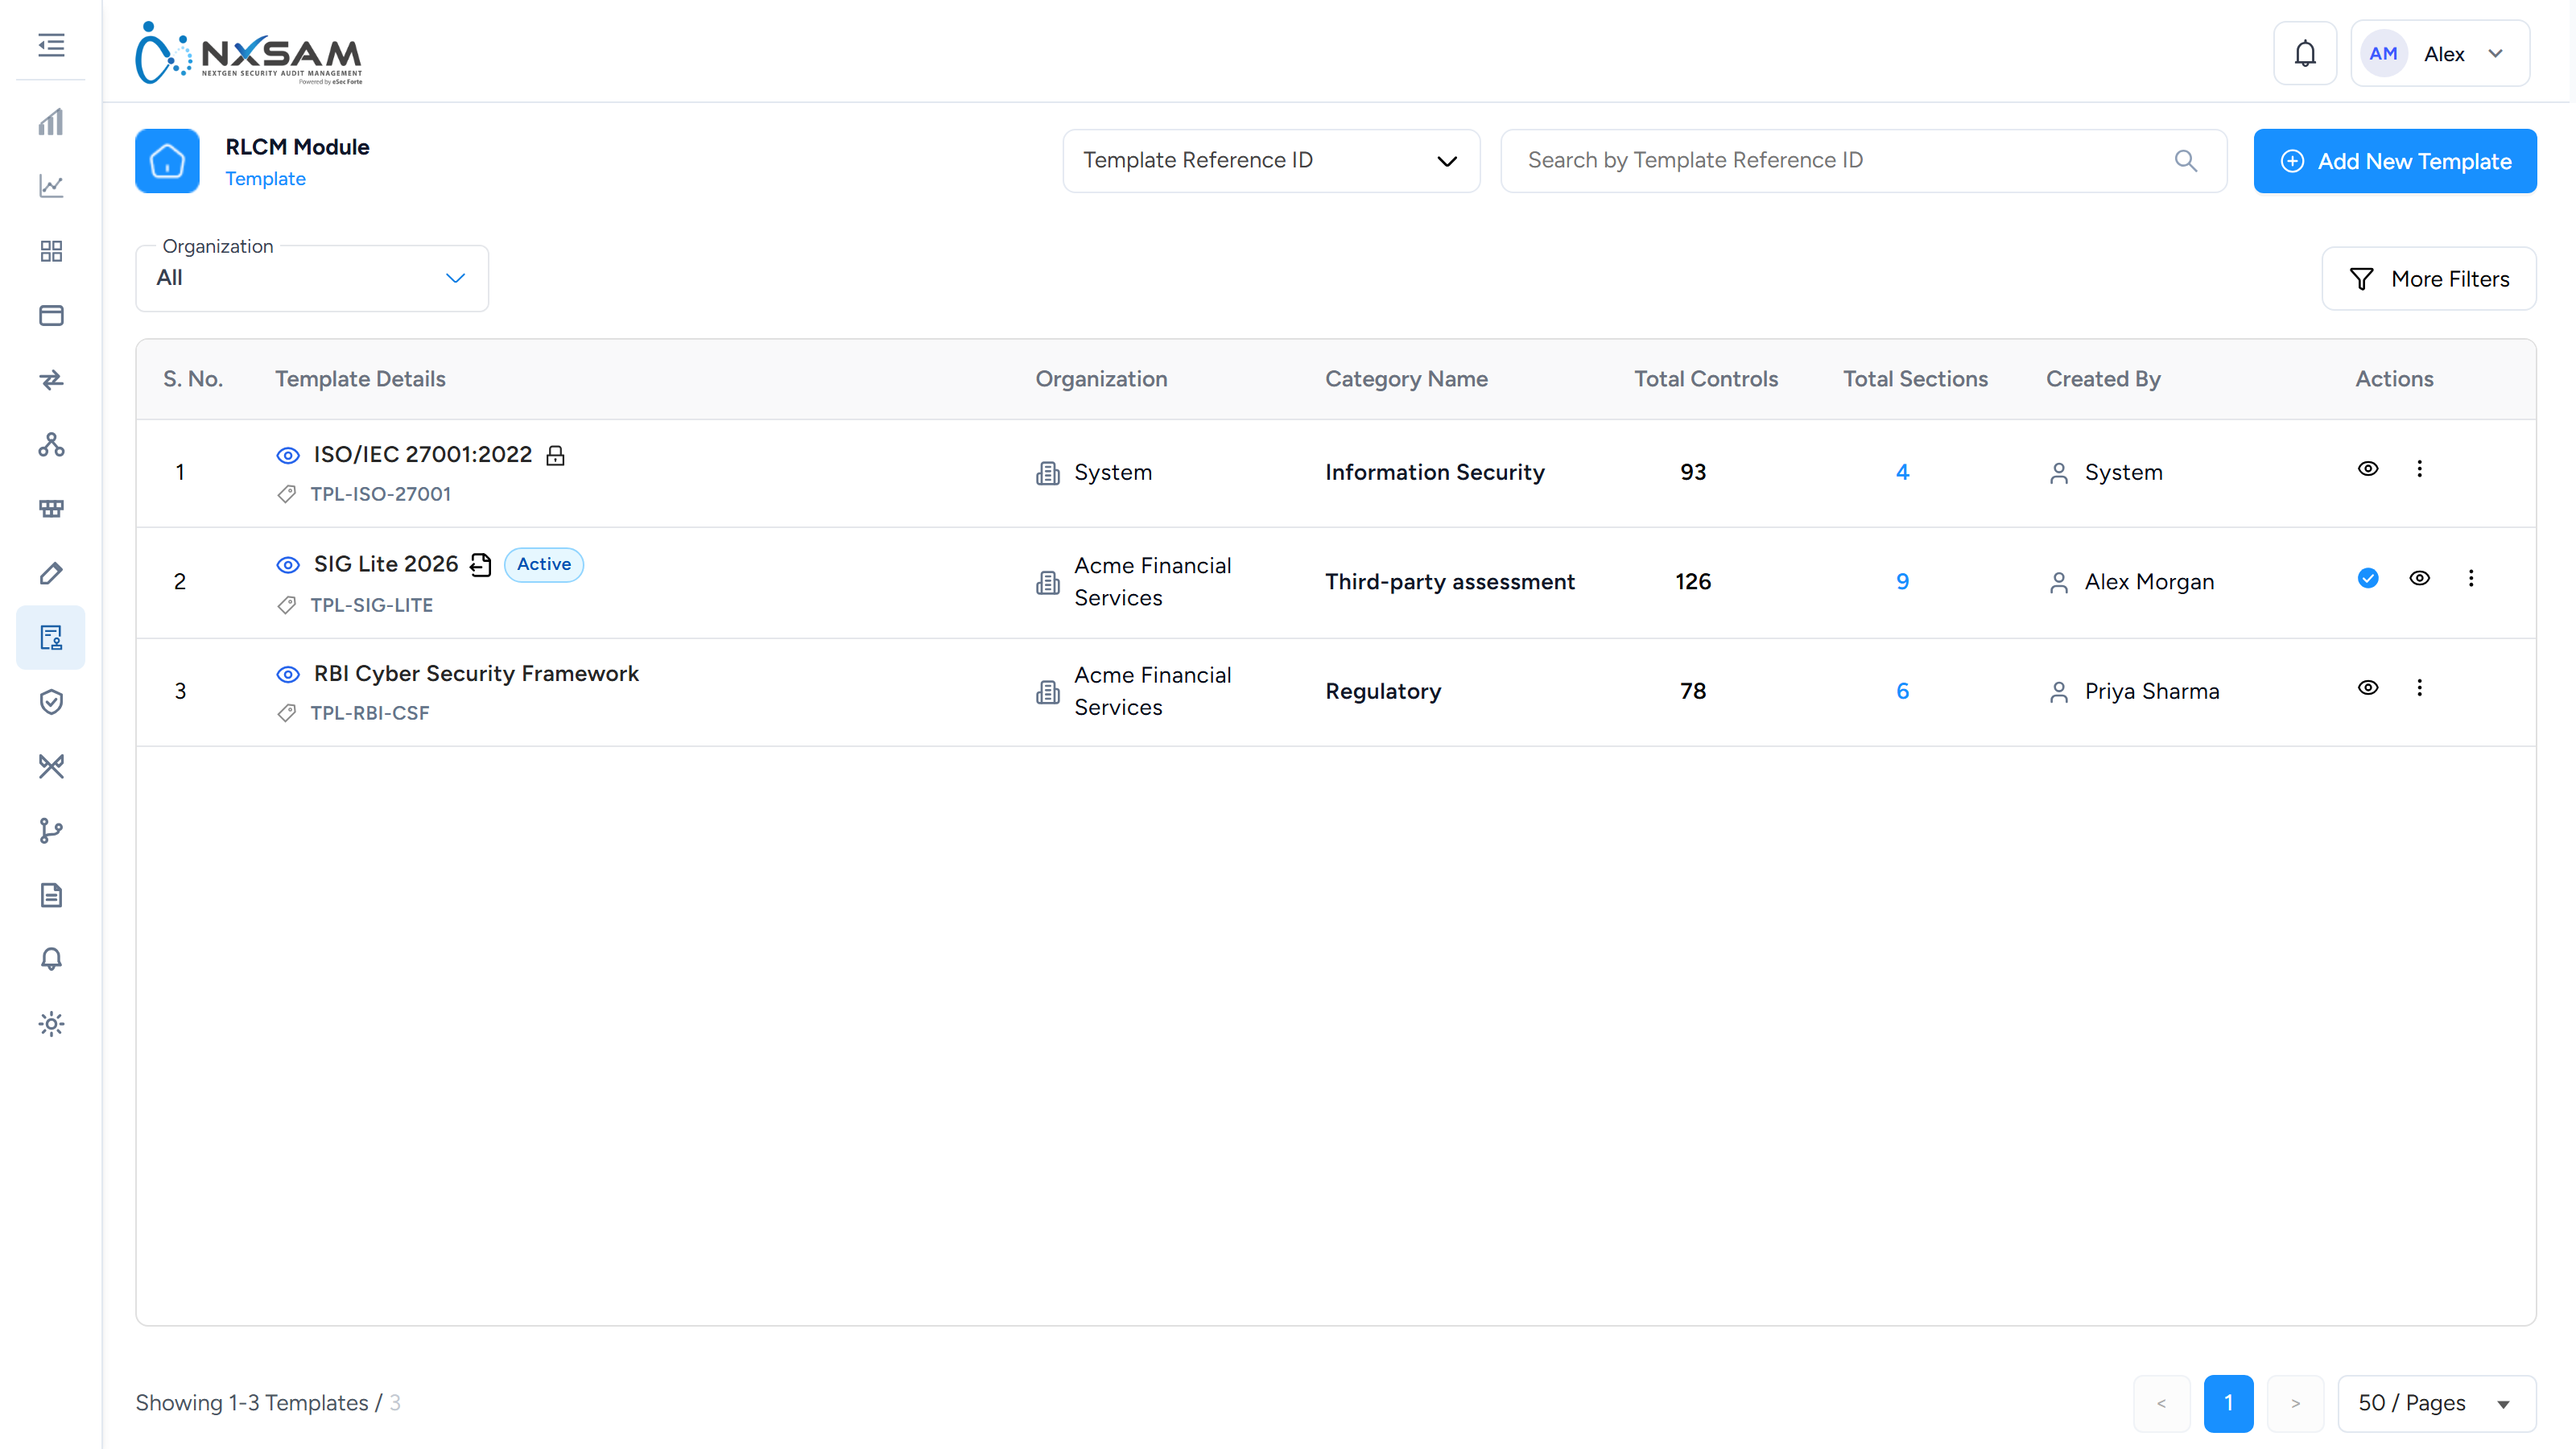
CCF Control Map
For one requirement, the controls already mapped and the ones not yet mapped, with Map and Unmap between them. Mapping changes coverage; it touches no assessment.
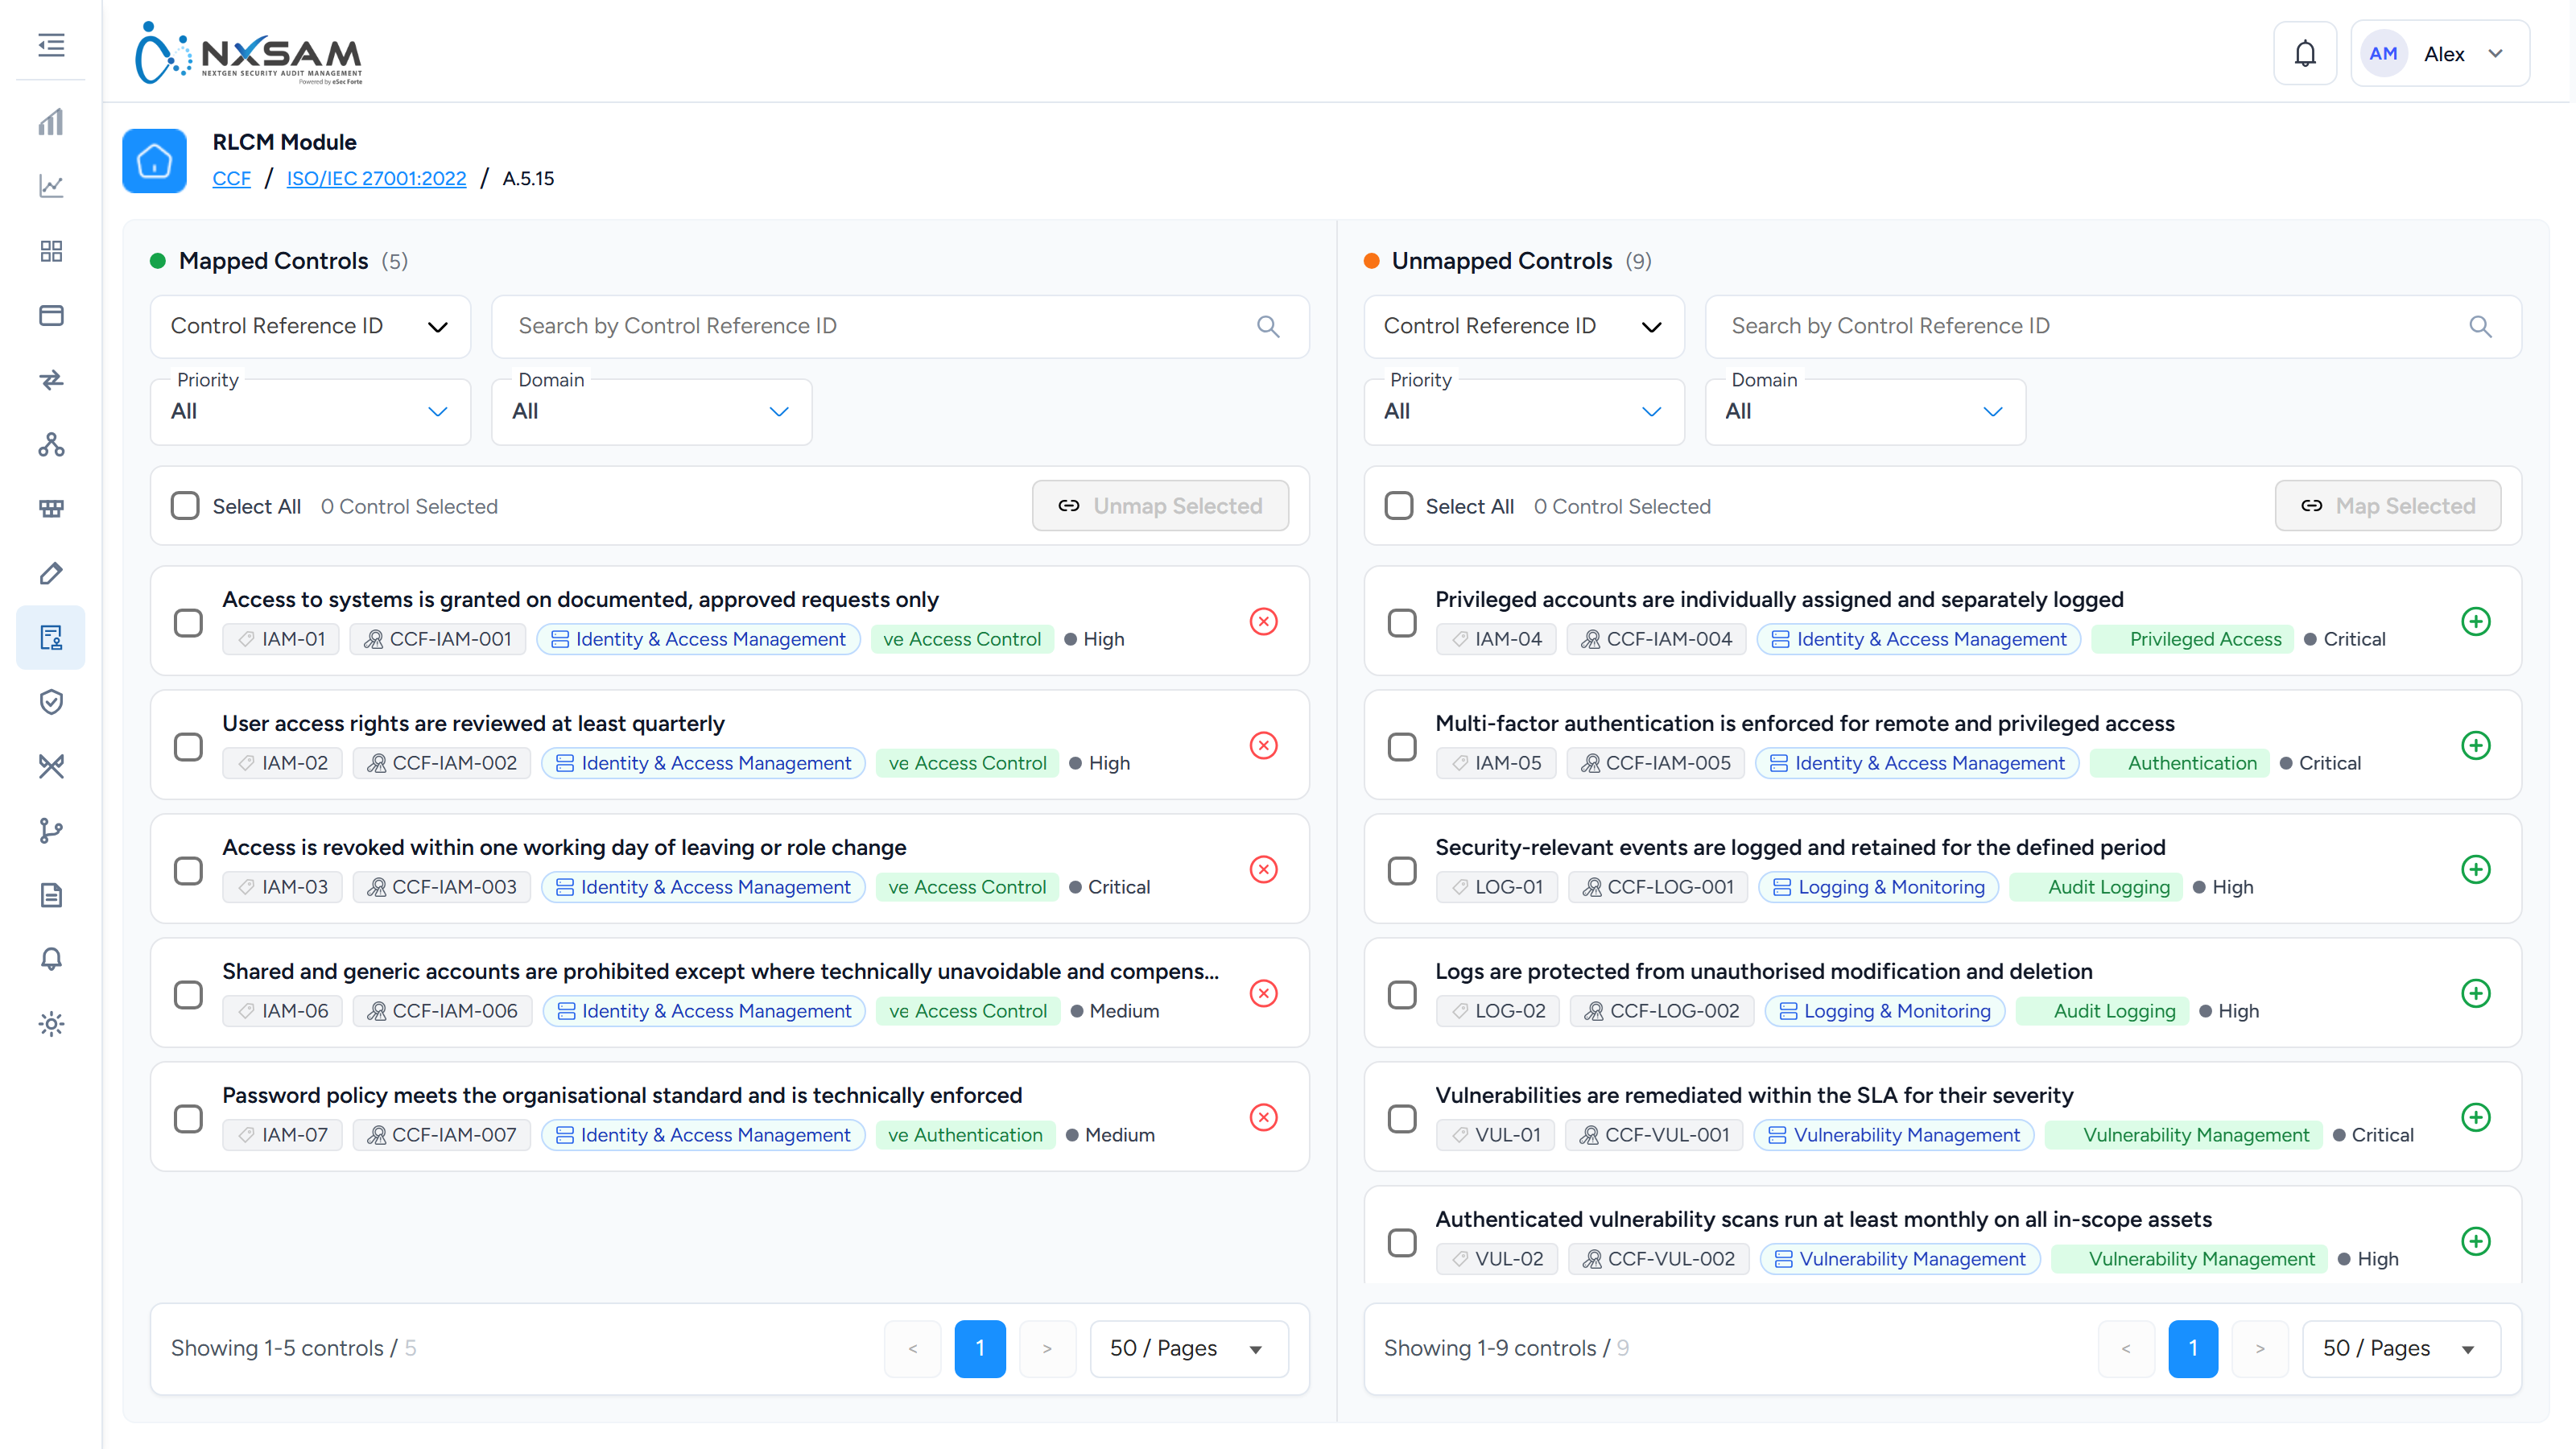
CCF Frameworks
The external standards you hold yourself to, each with its requirement count and the proportion of requirements mapped to at least one control. Compliance % here measures mapping, not passing.
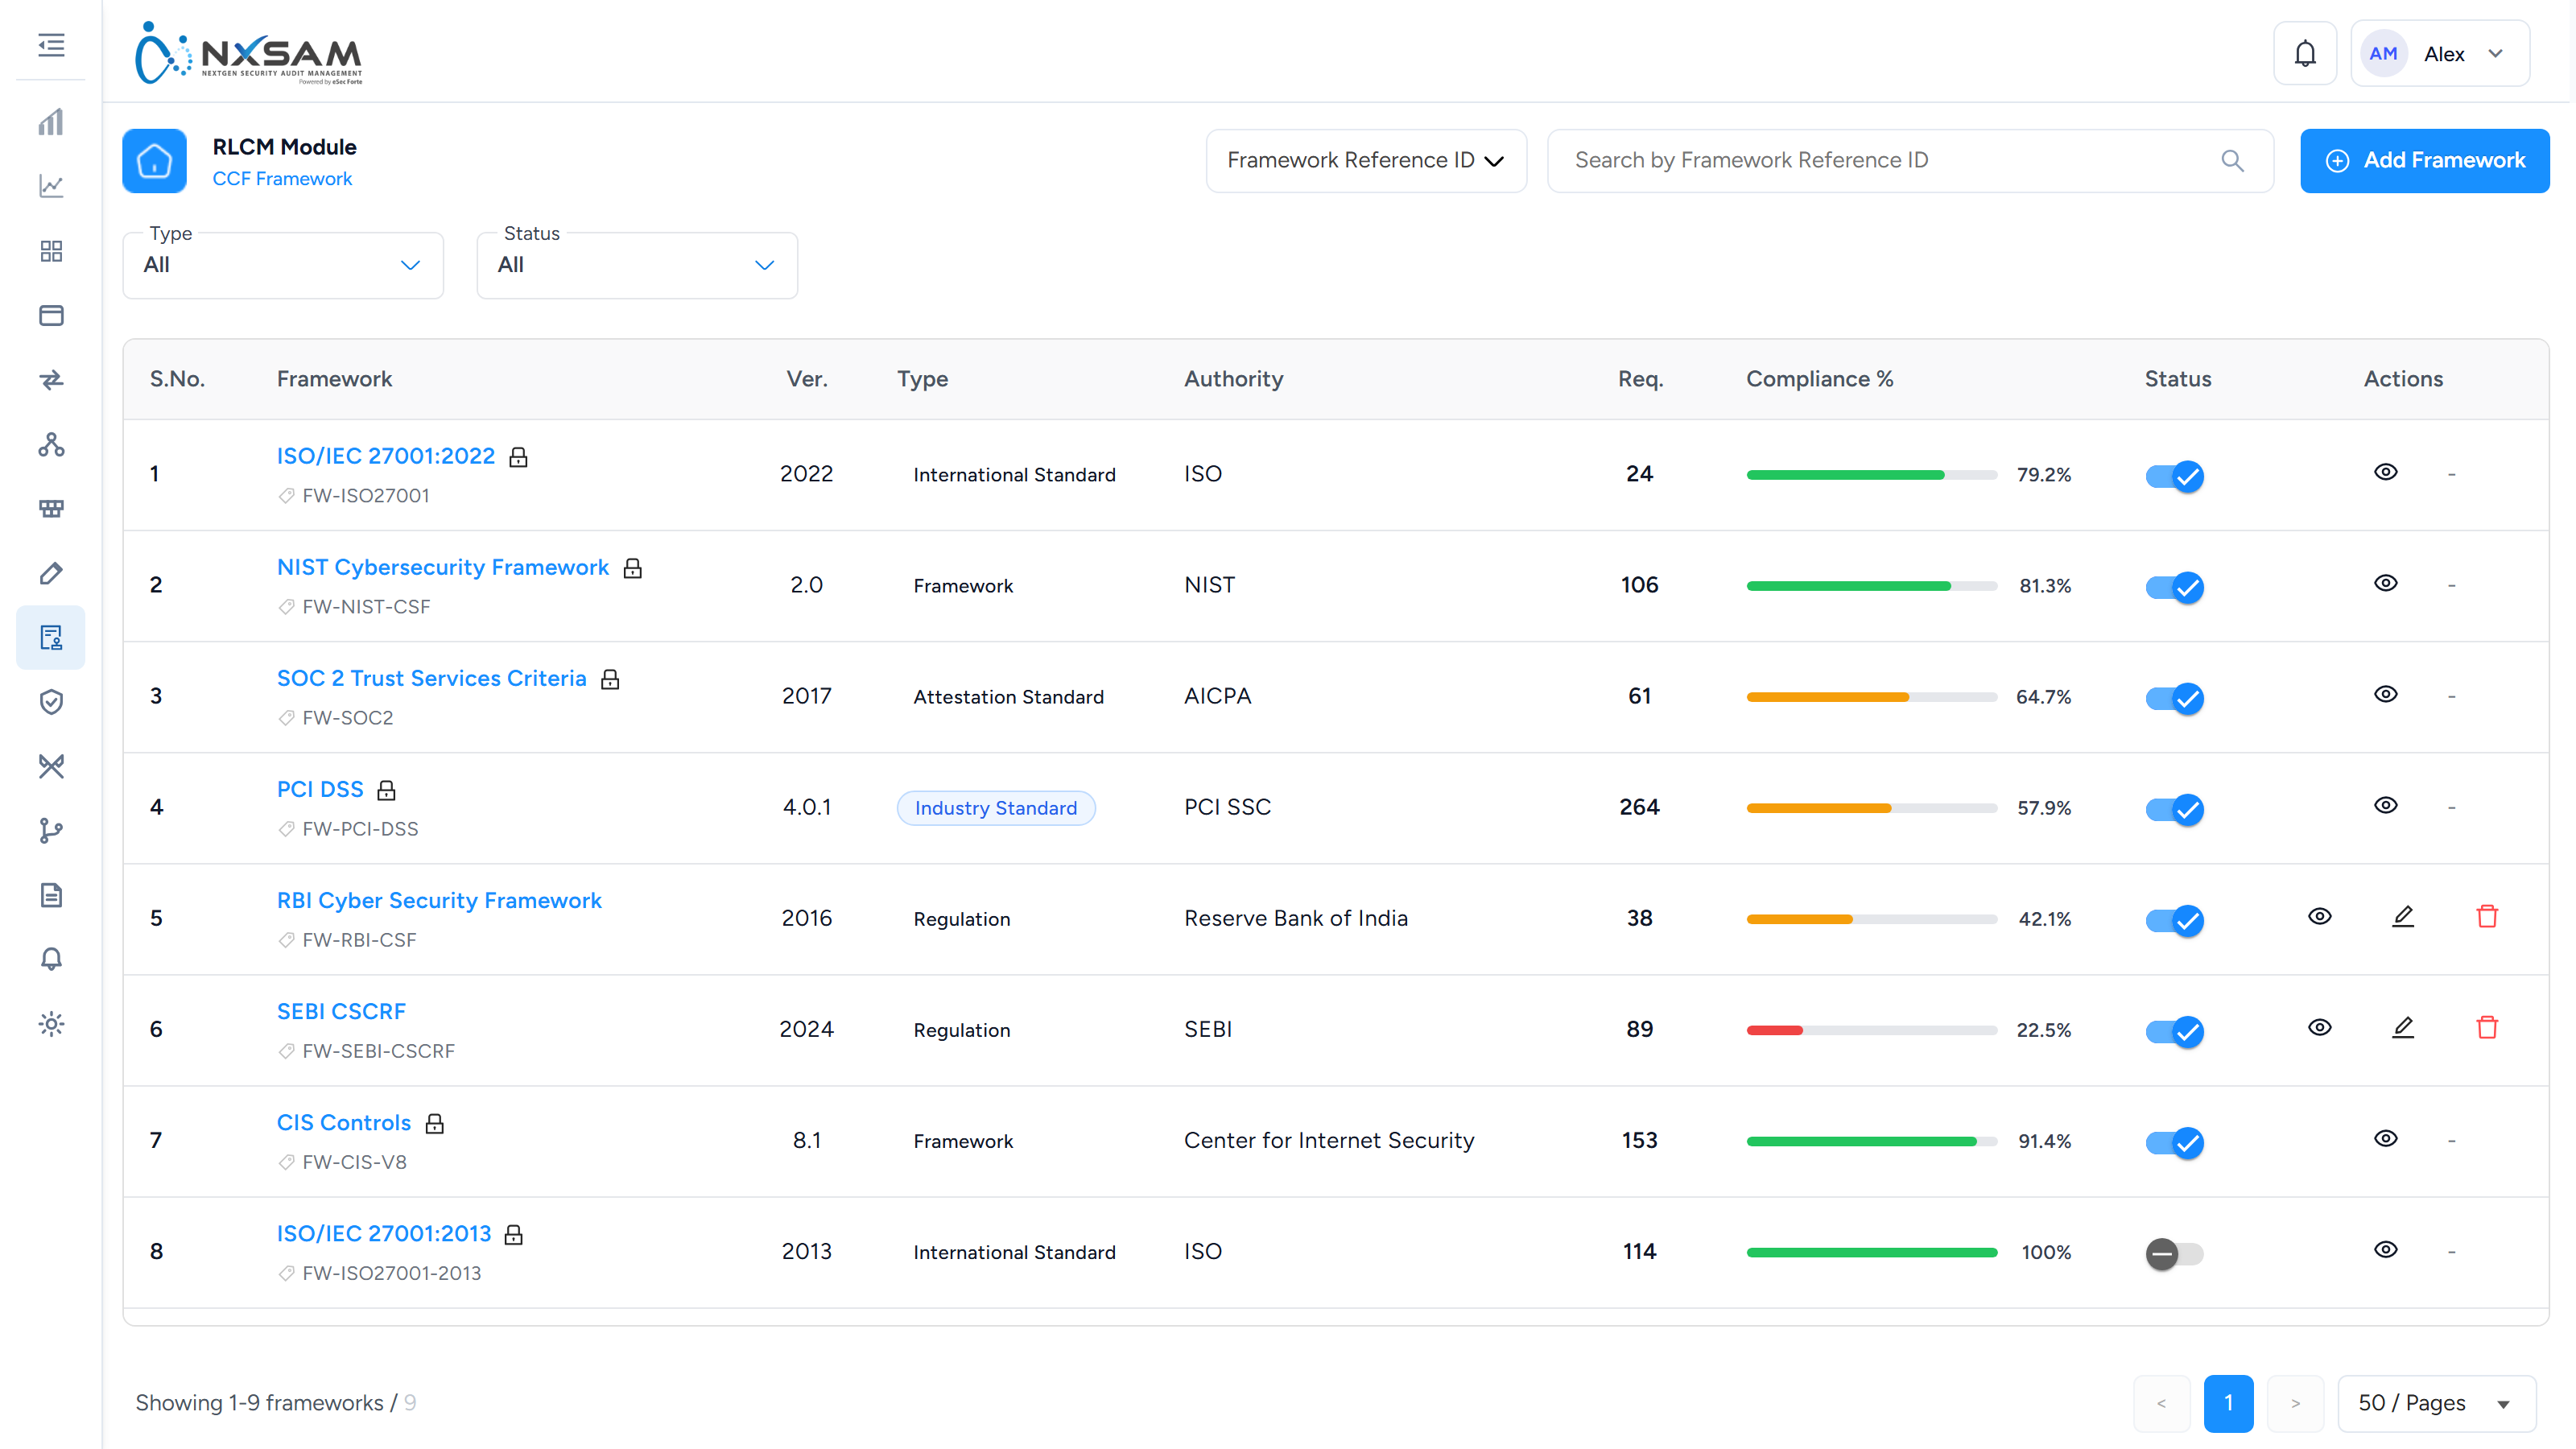
CCF Requirements
One framework's clauses by section, each showing how many controls satisfy it. Unmapped (gaps) is the number to work down — every one is a clause you are held to and have no control for.
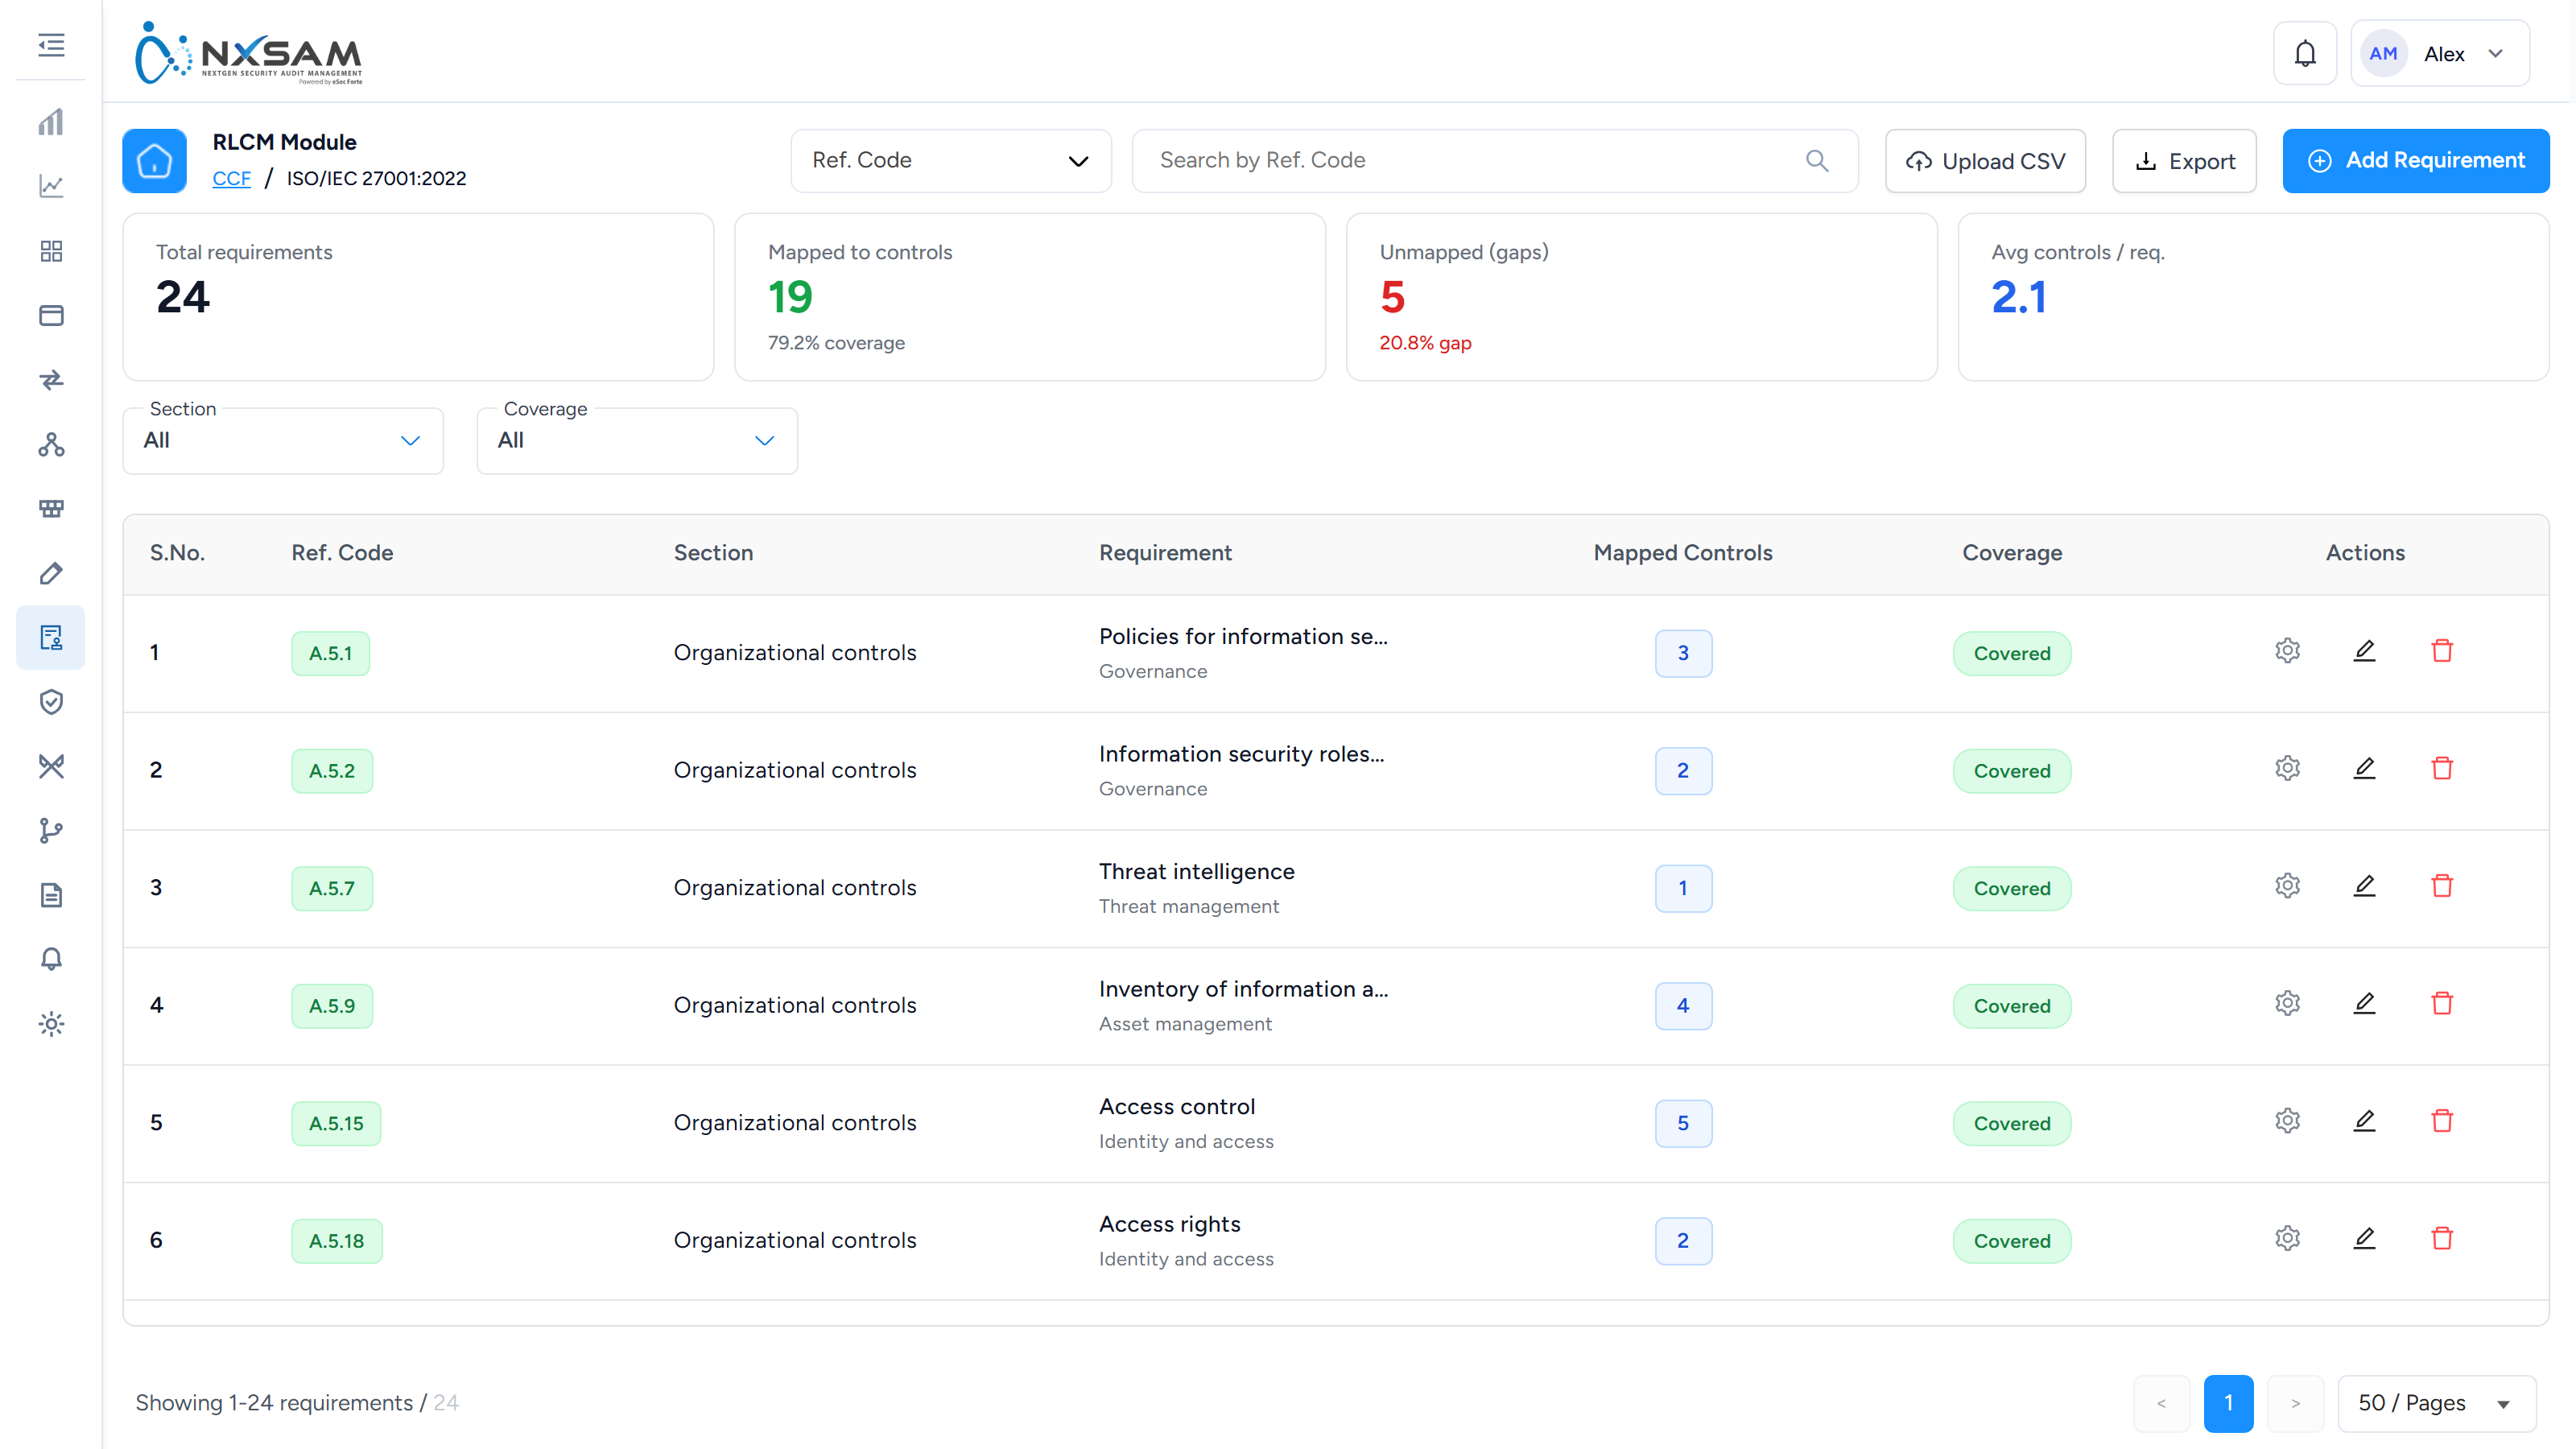
Compliance Assessments
Assessments in progress and completed, with their control status and review state.
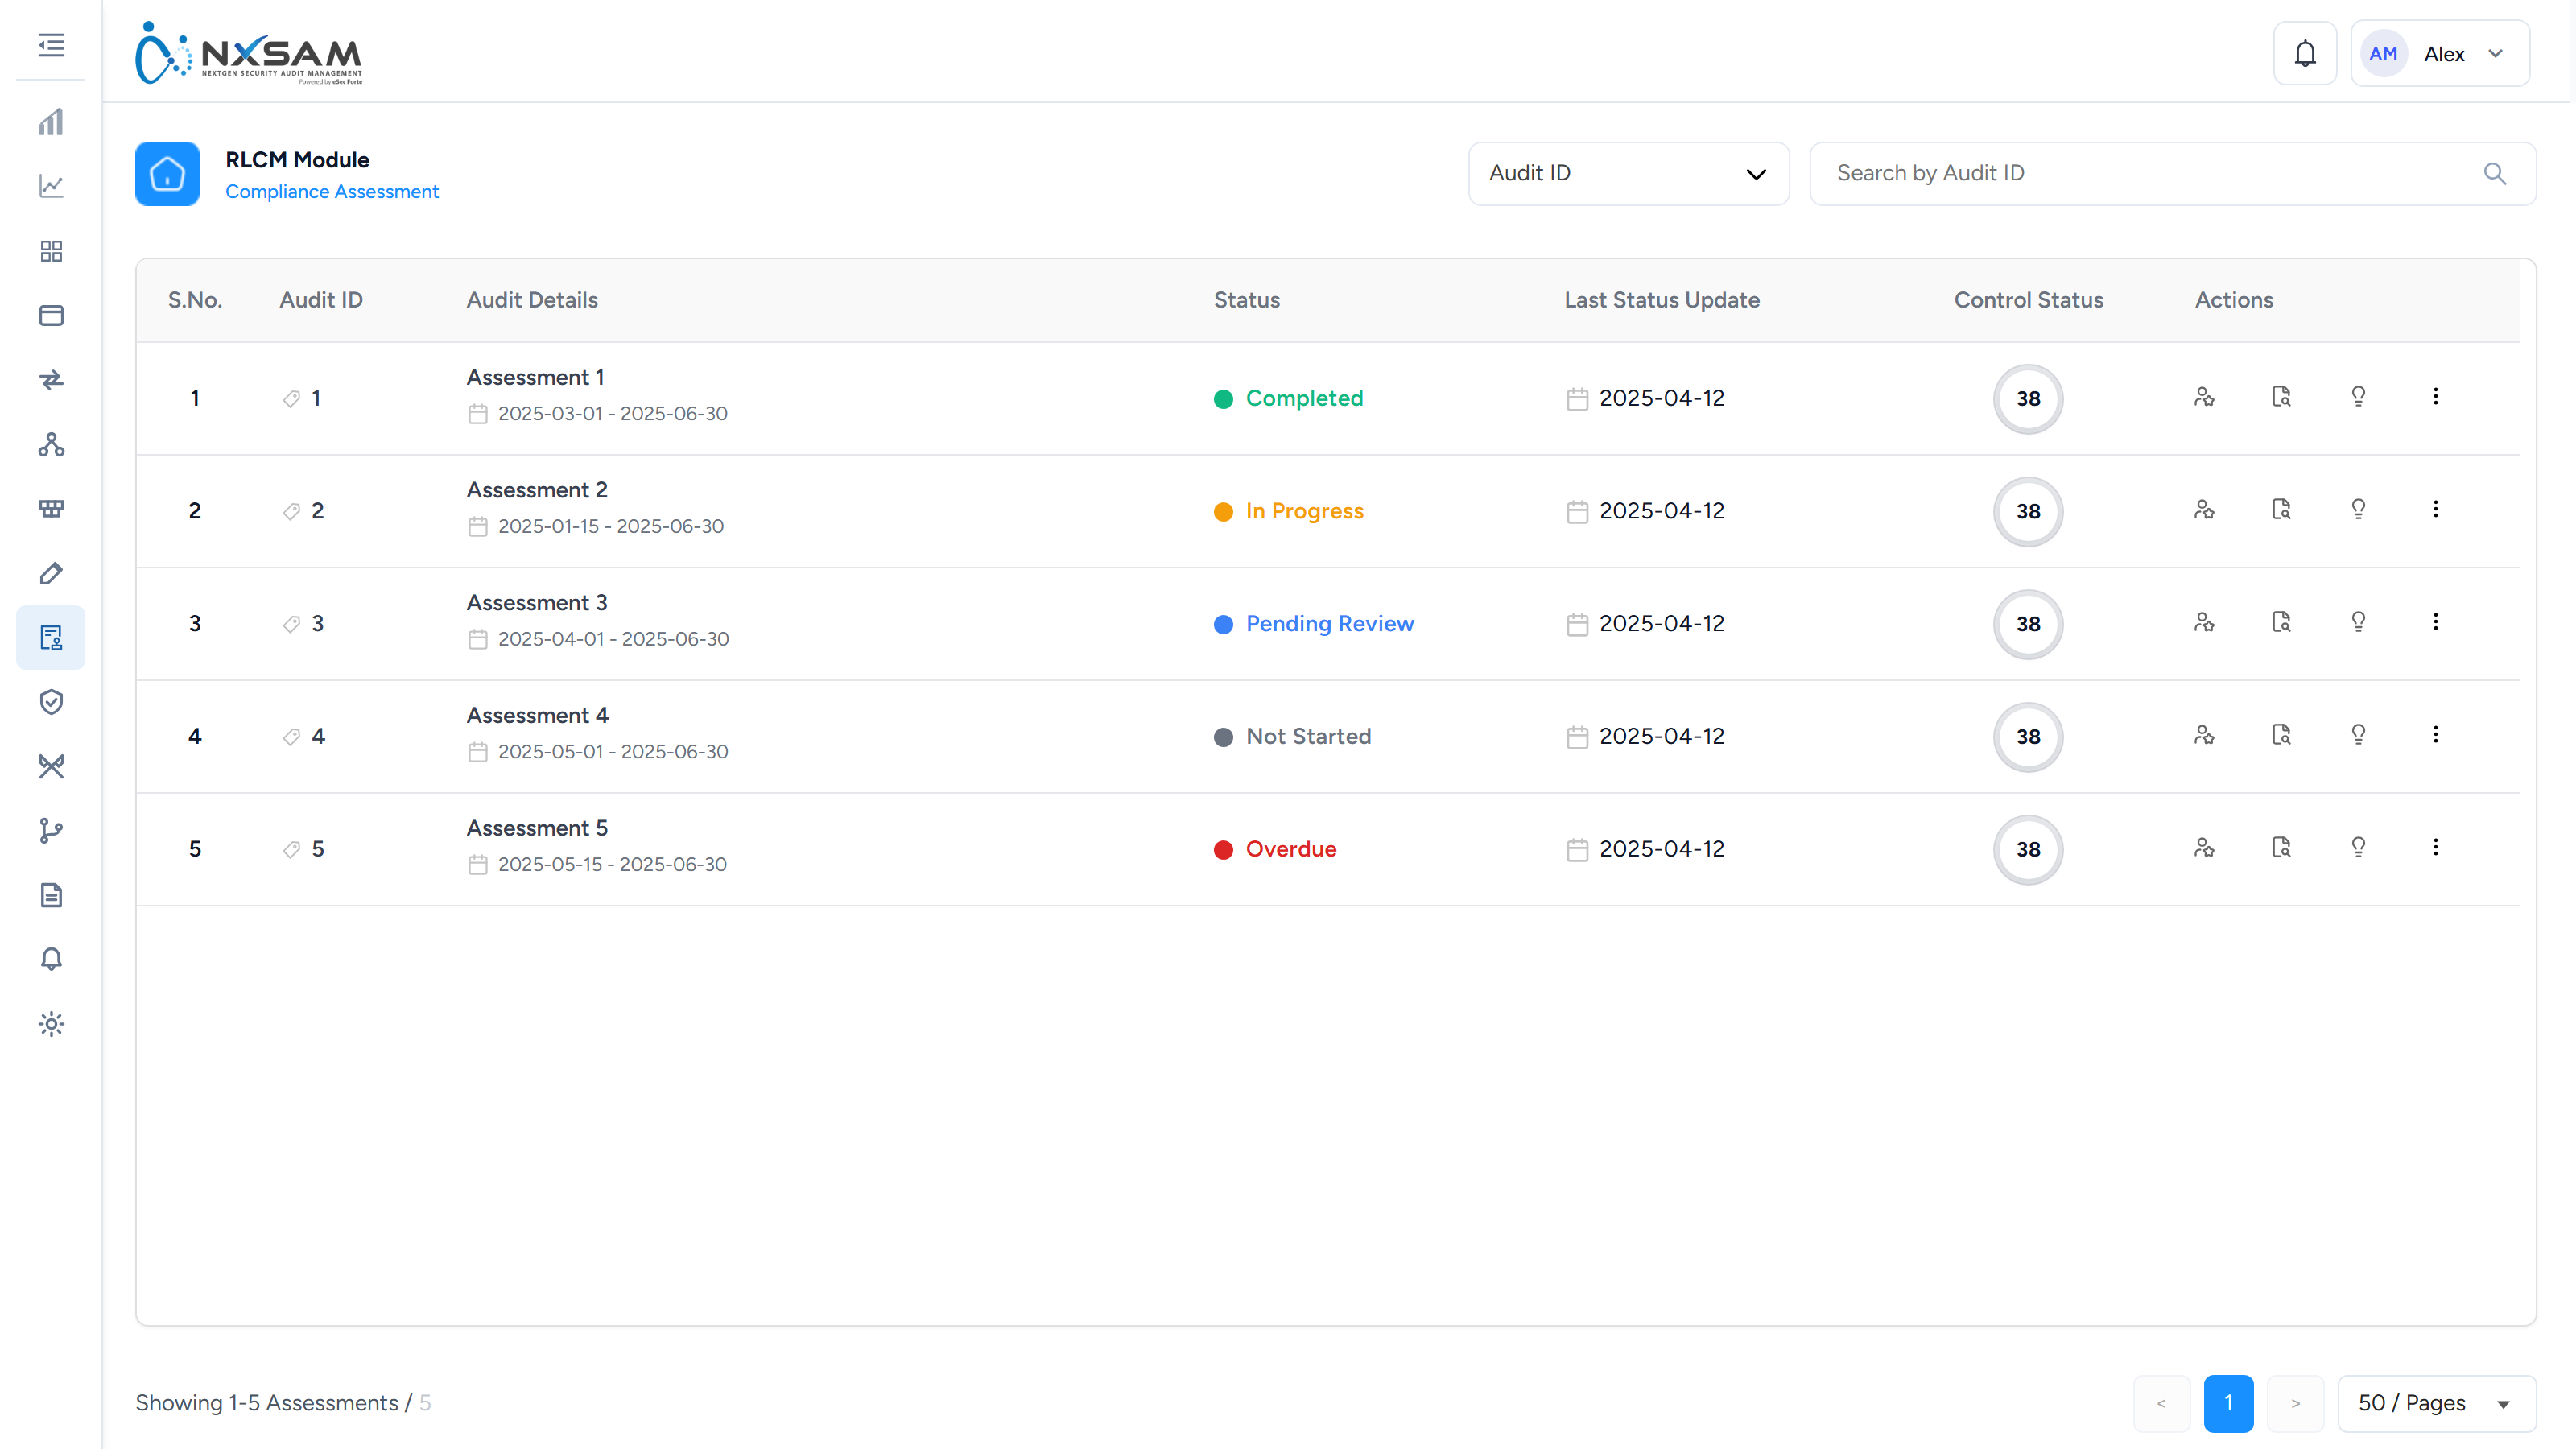
Compliance Risks
Risks raised from control failures, tracked and treated separately from technical vulnerabilities.
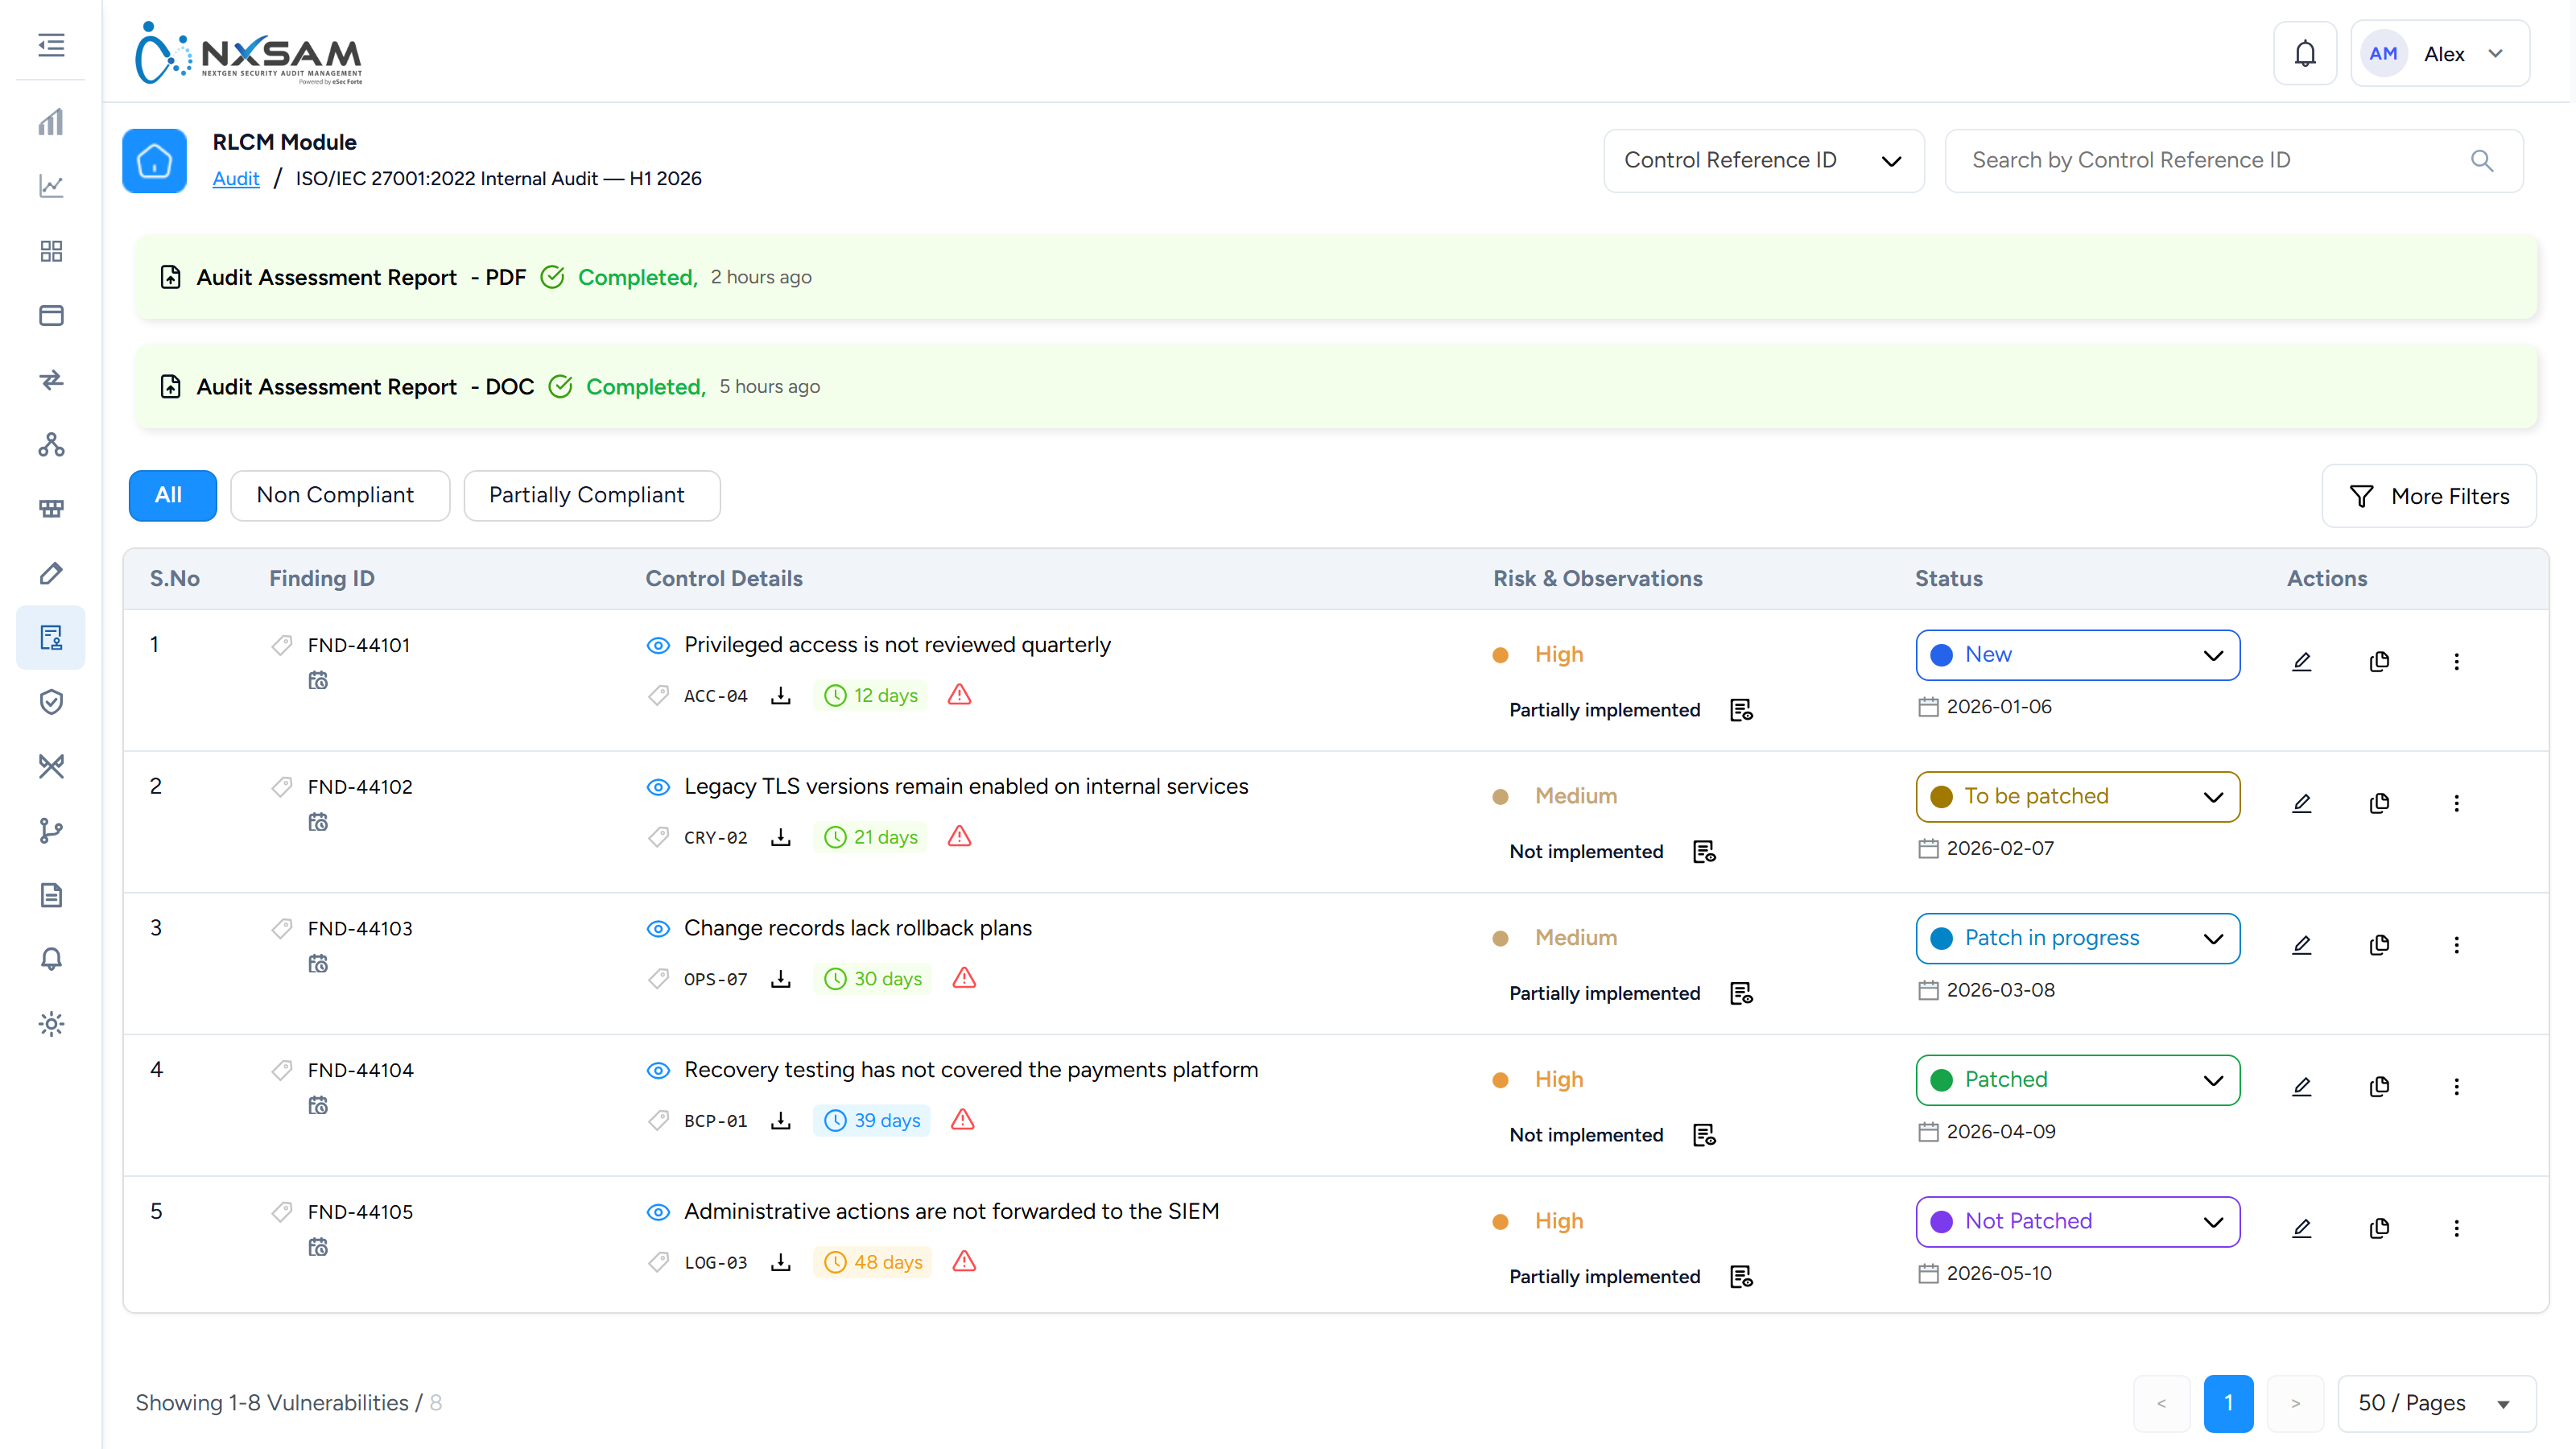
Control Library
Every control available to assess against, across all frameworks.
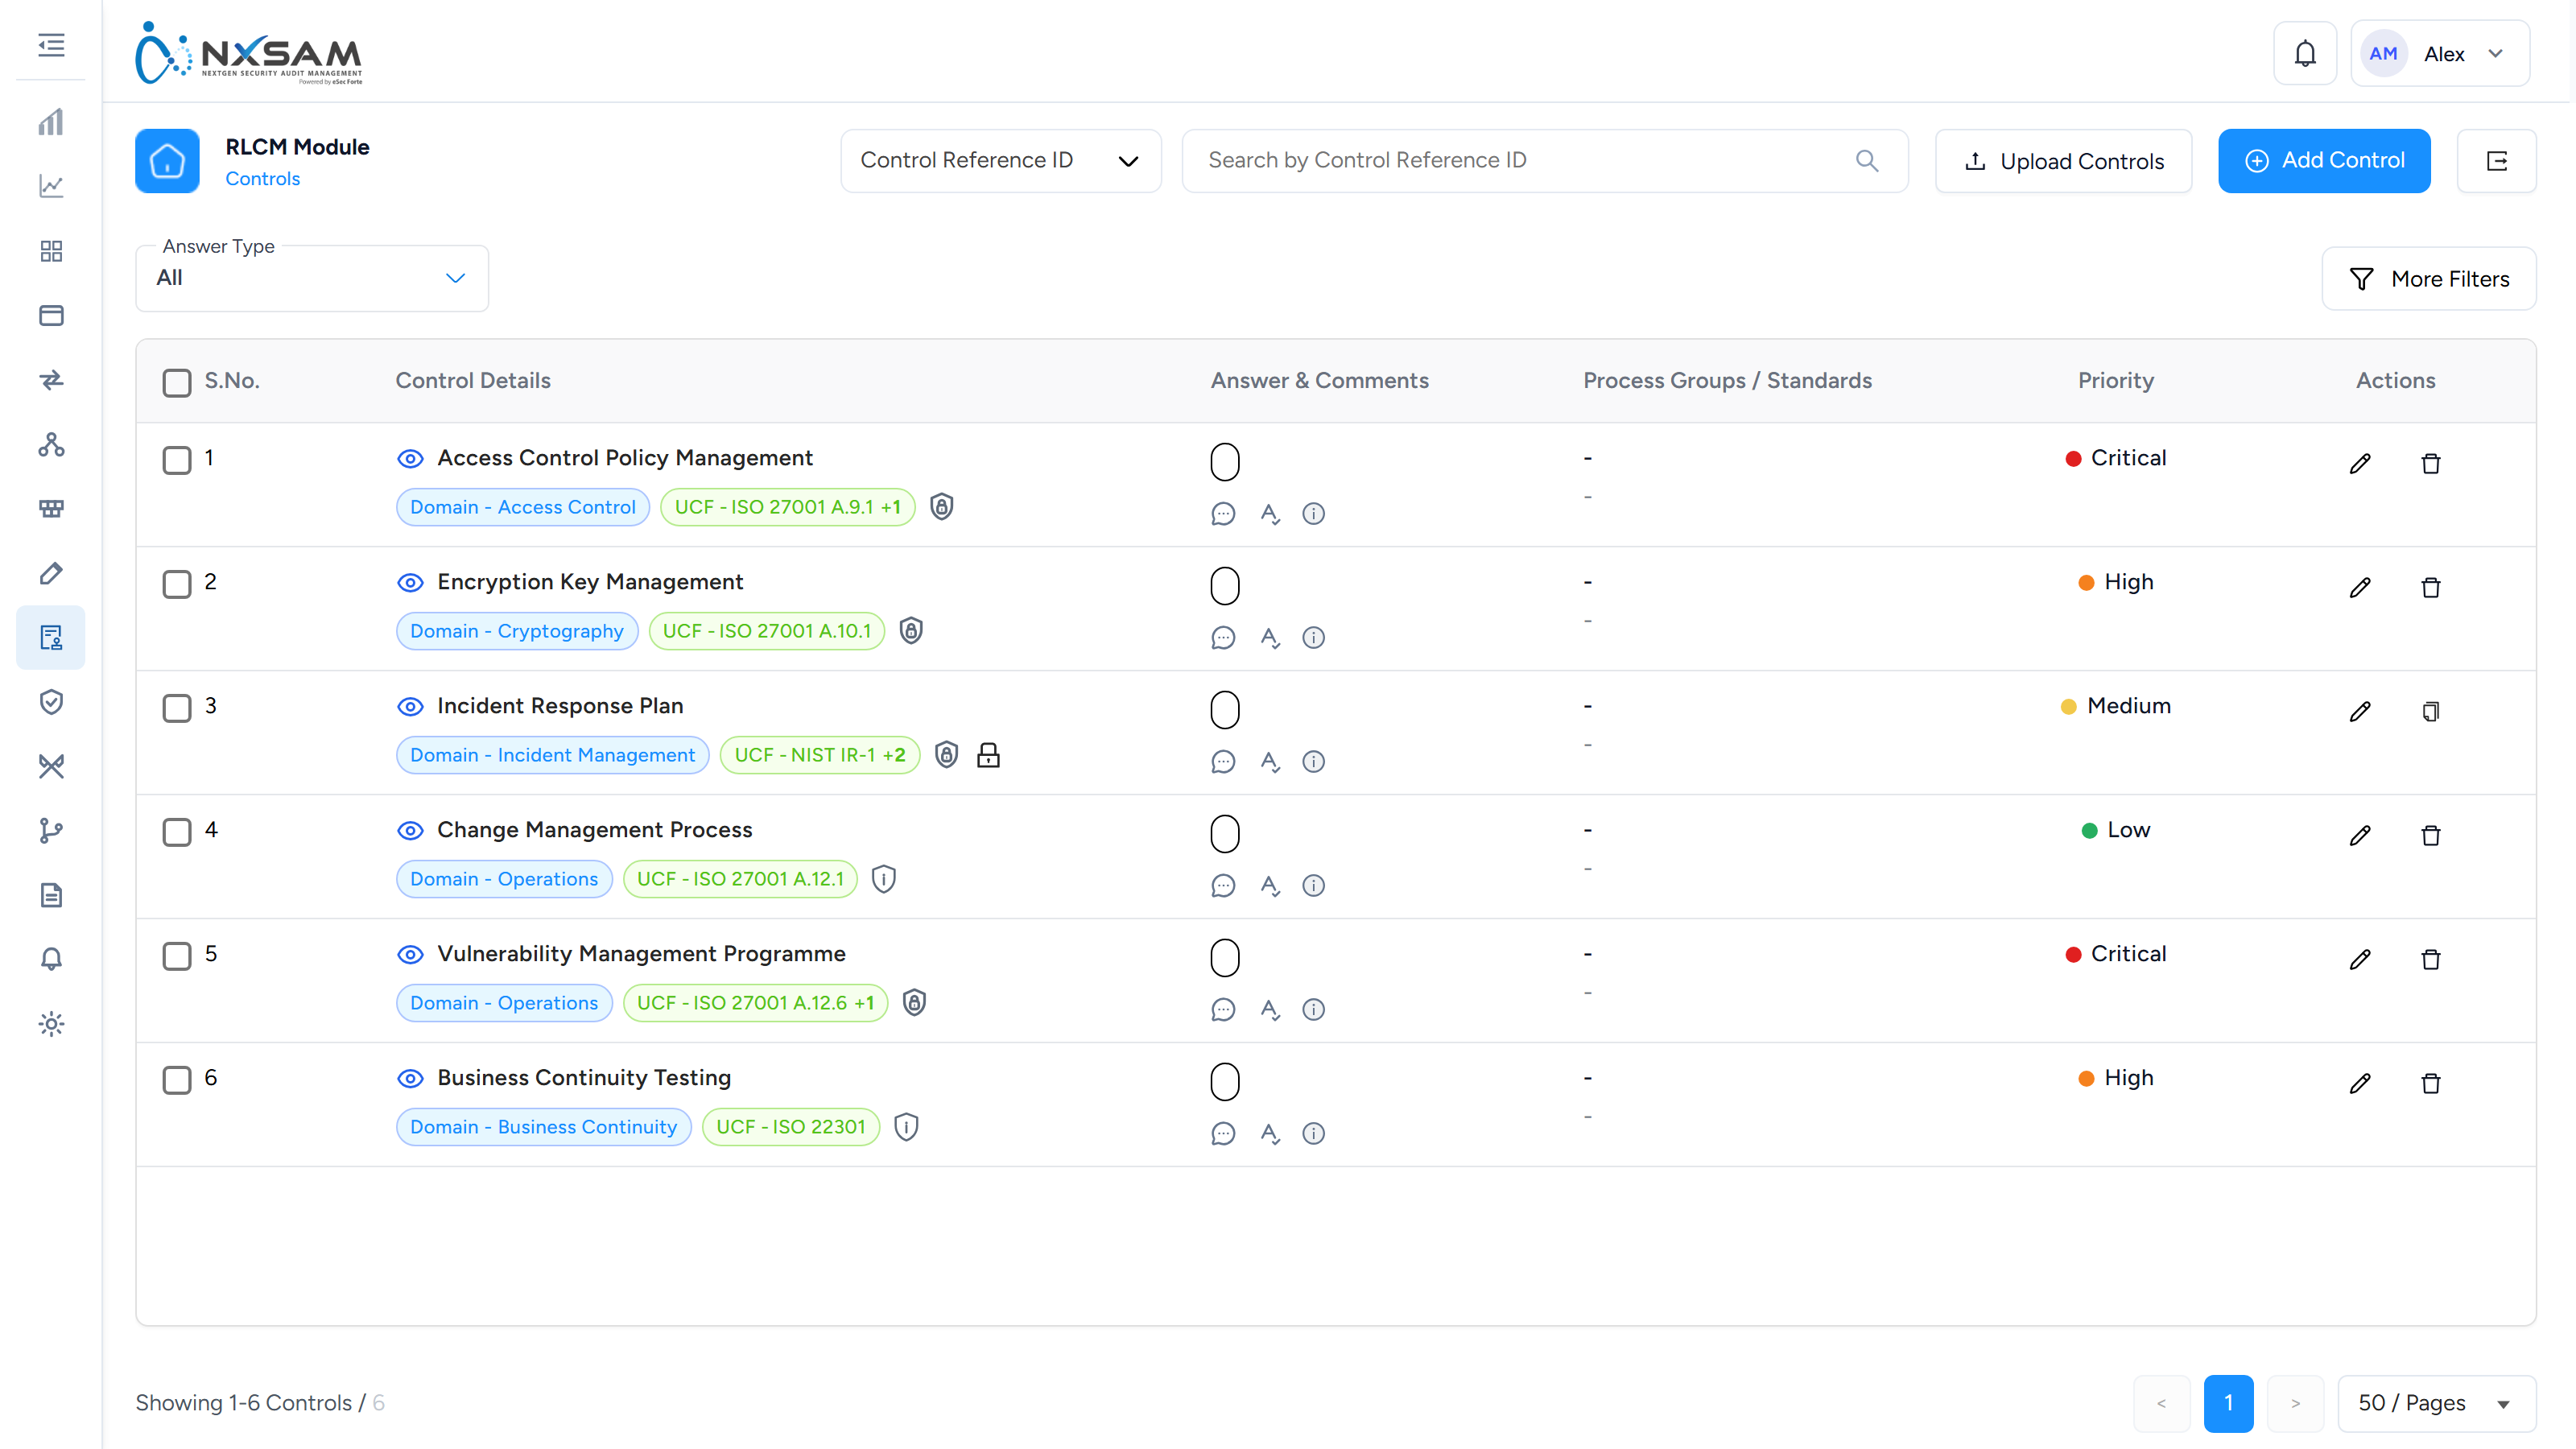
Control Similarity
Matches a vendor questionnaire against controls already assessed, so overlapping questions are not asked twice.
Process Groups
Business processes controls are grouped against, so a failure can be reported by function rather than by clause.
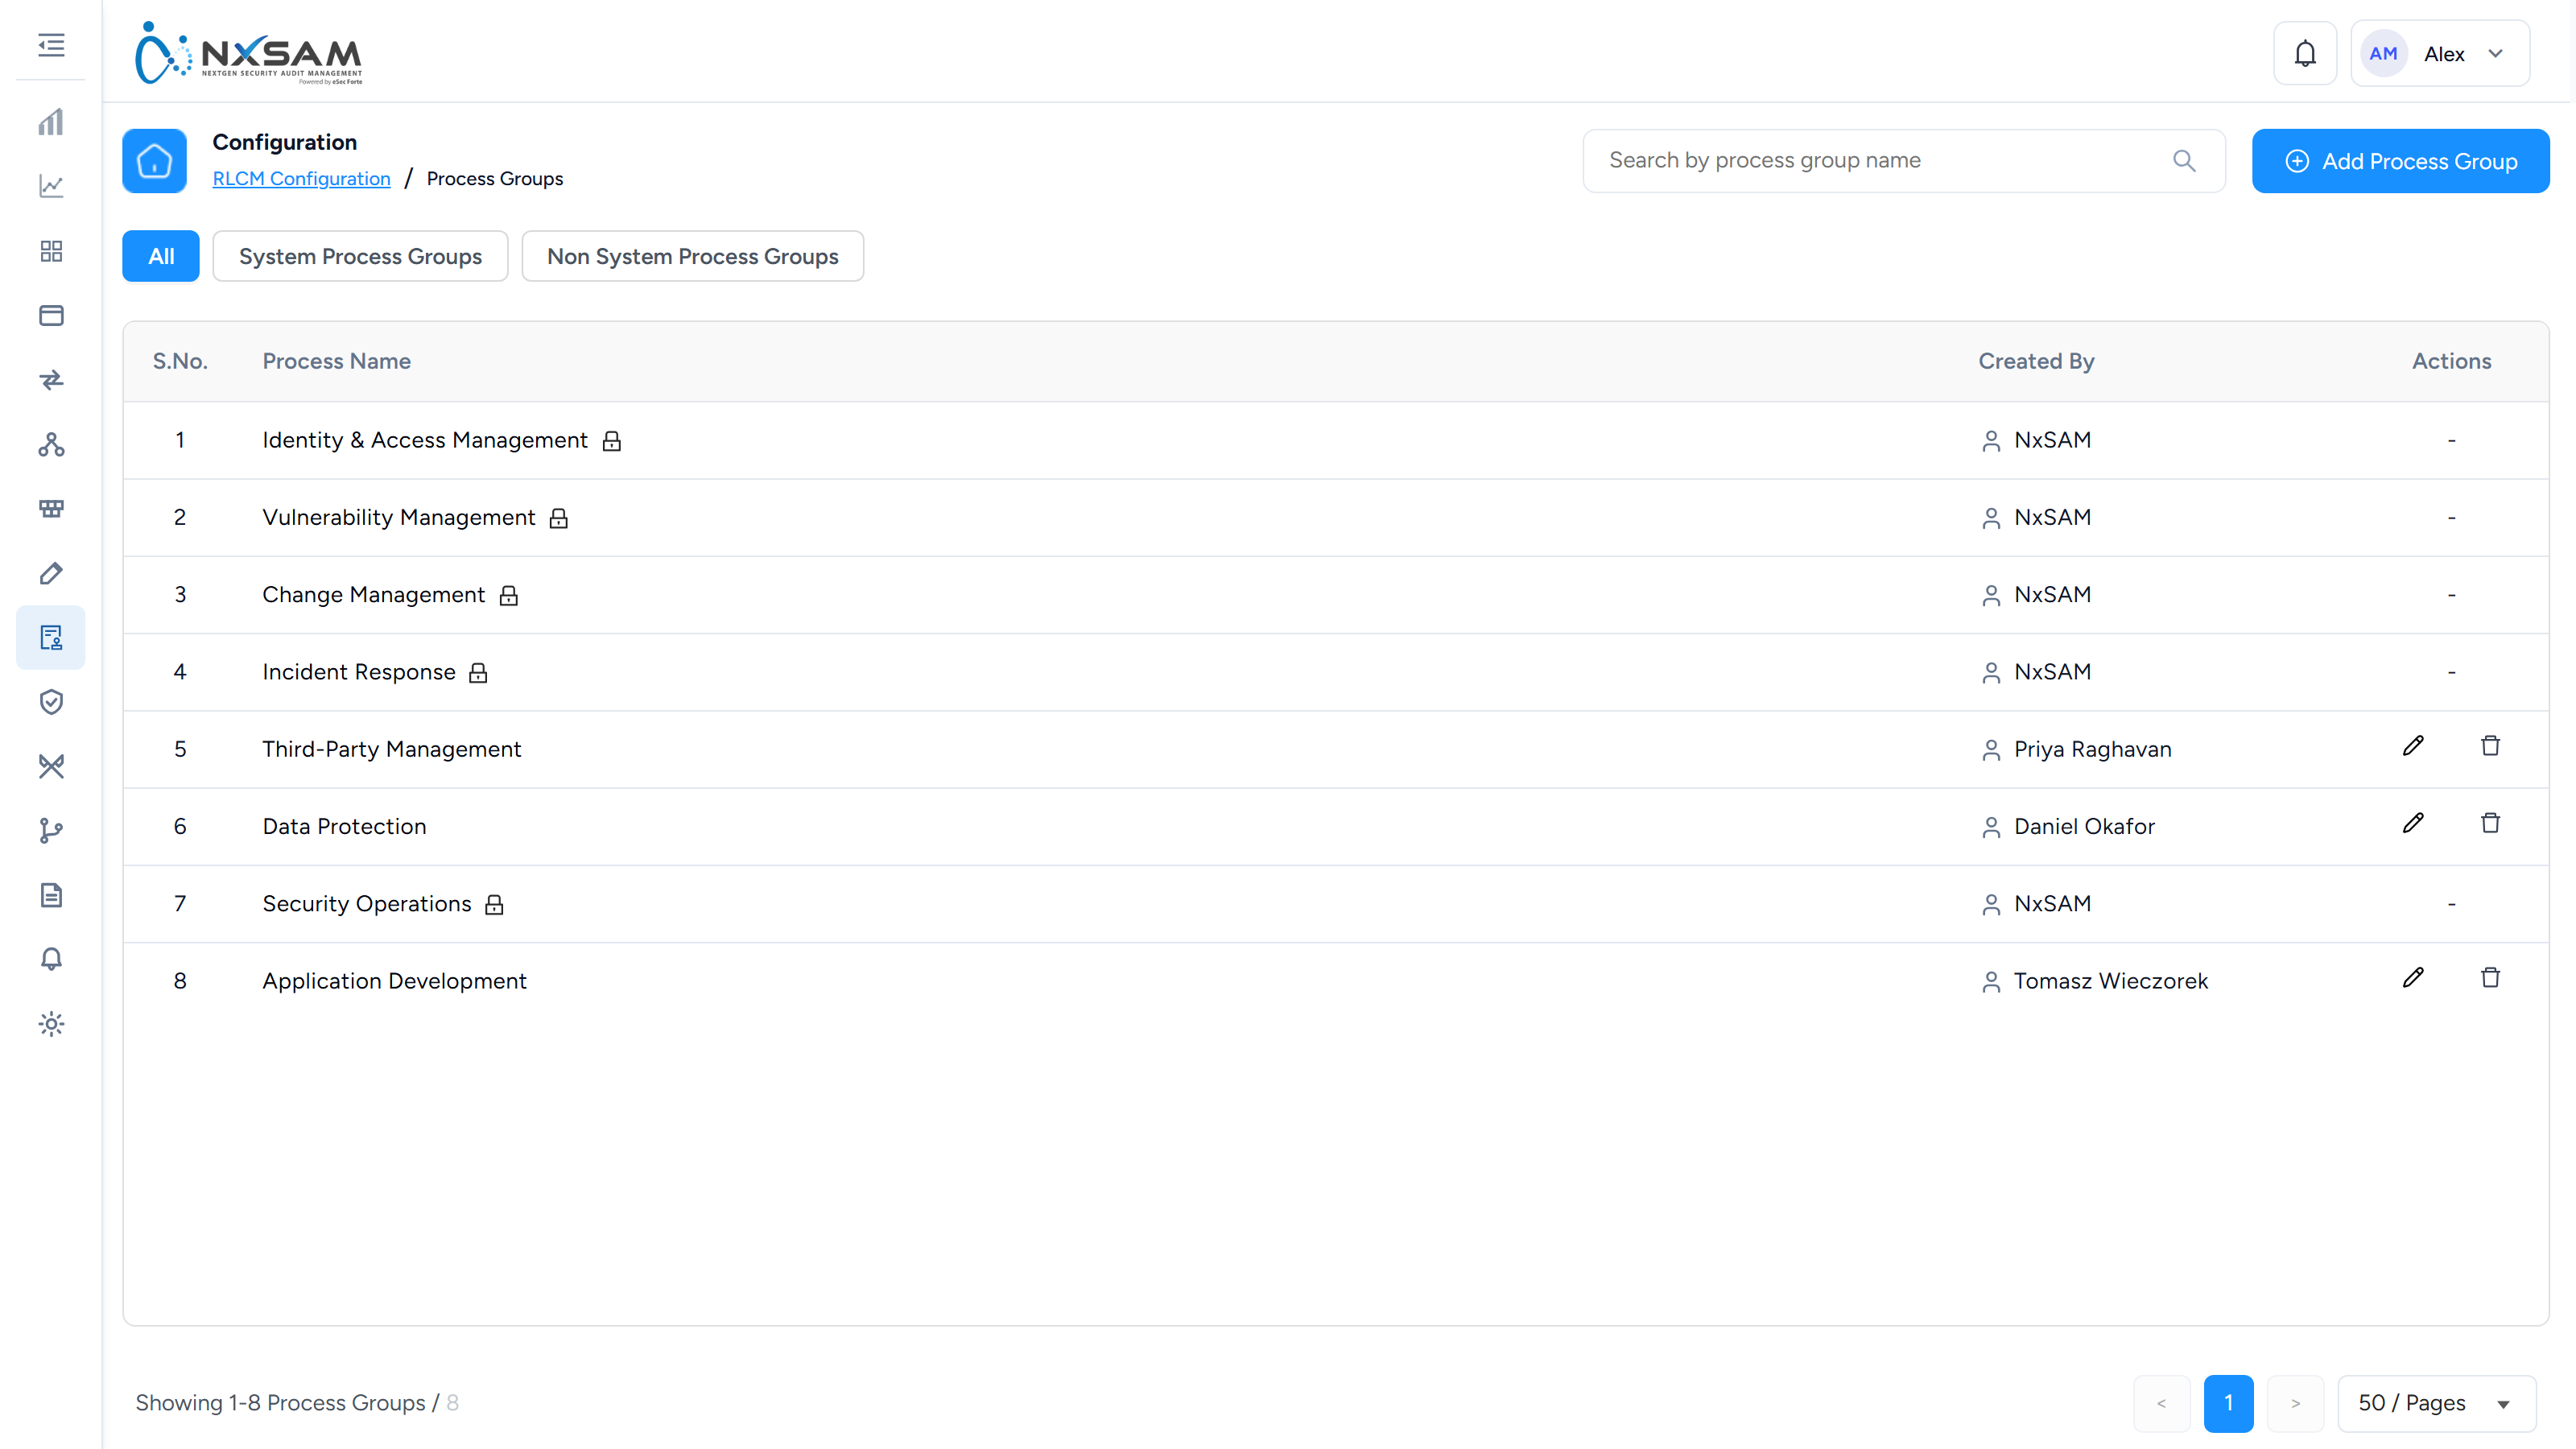
RLCM Audit Categories
How compliance audits are classified for reporting.
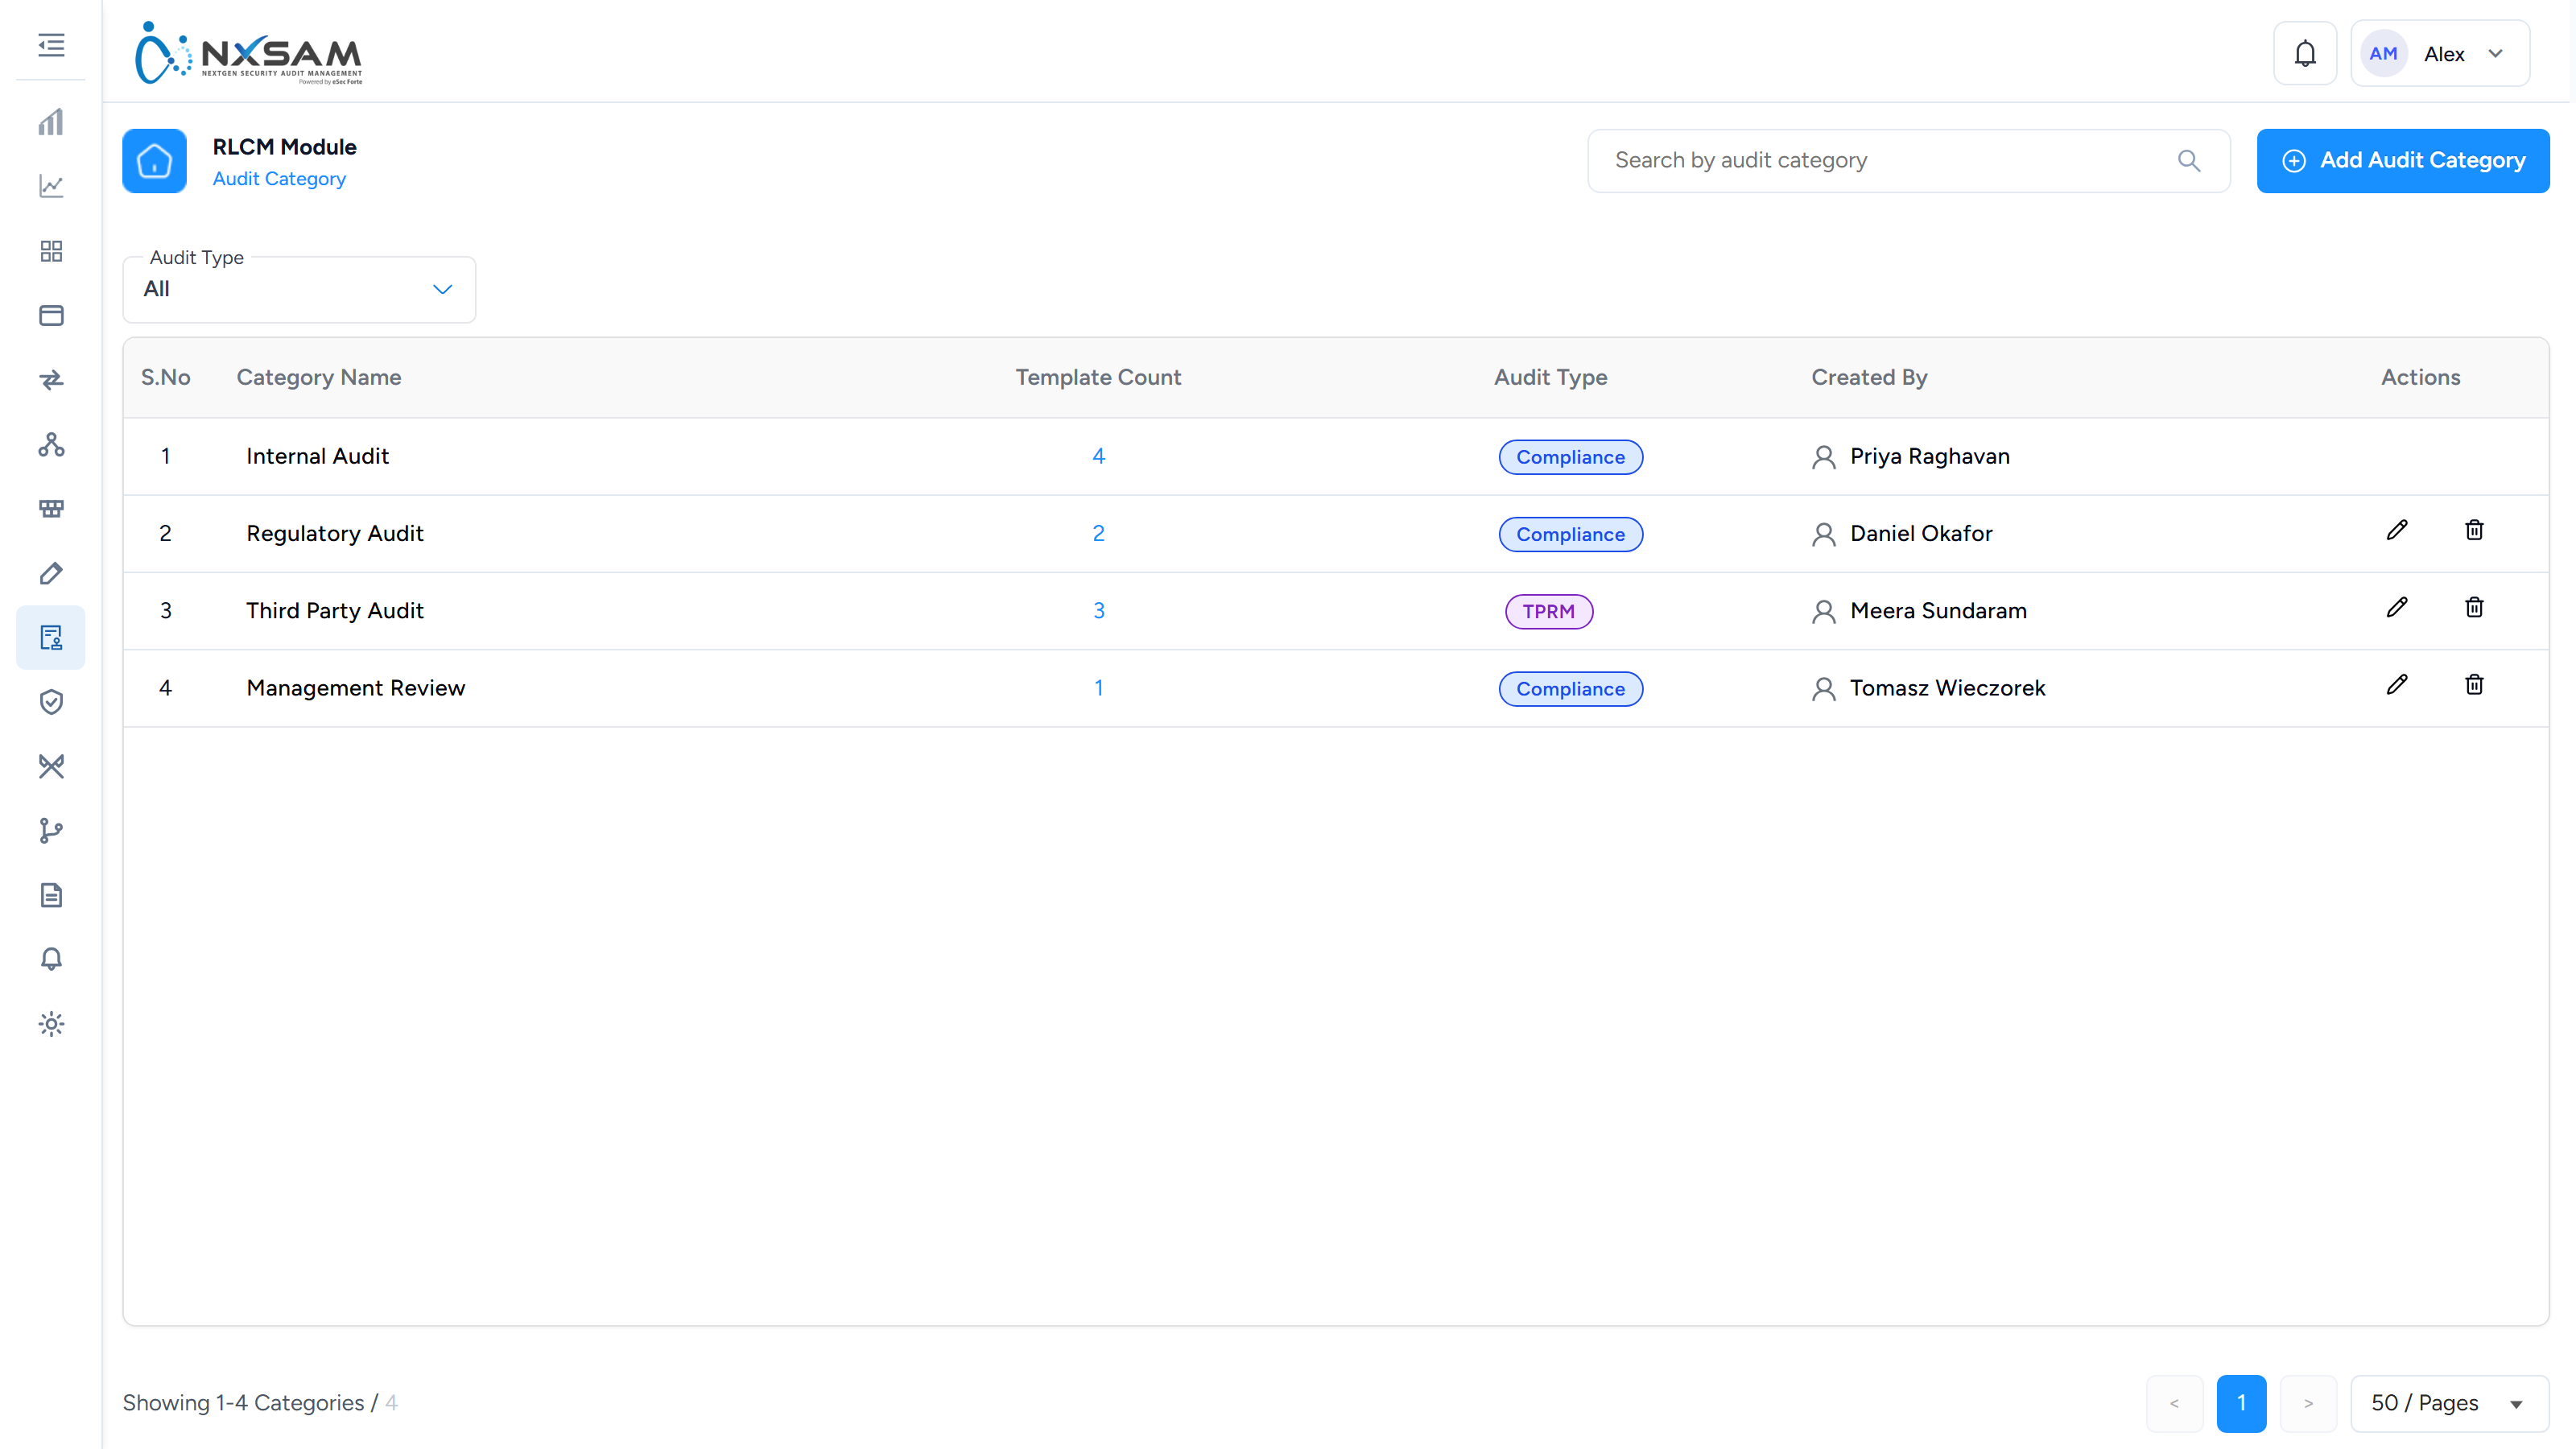
RLCM Audit Management
Create and administer compliance audits, including scope and assigned assessors.
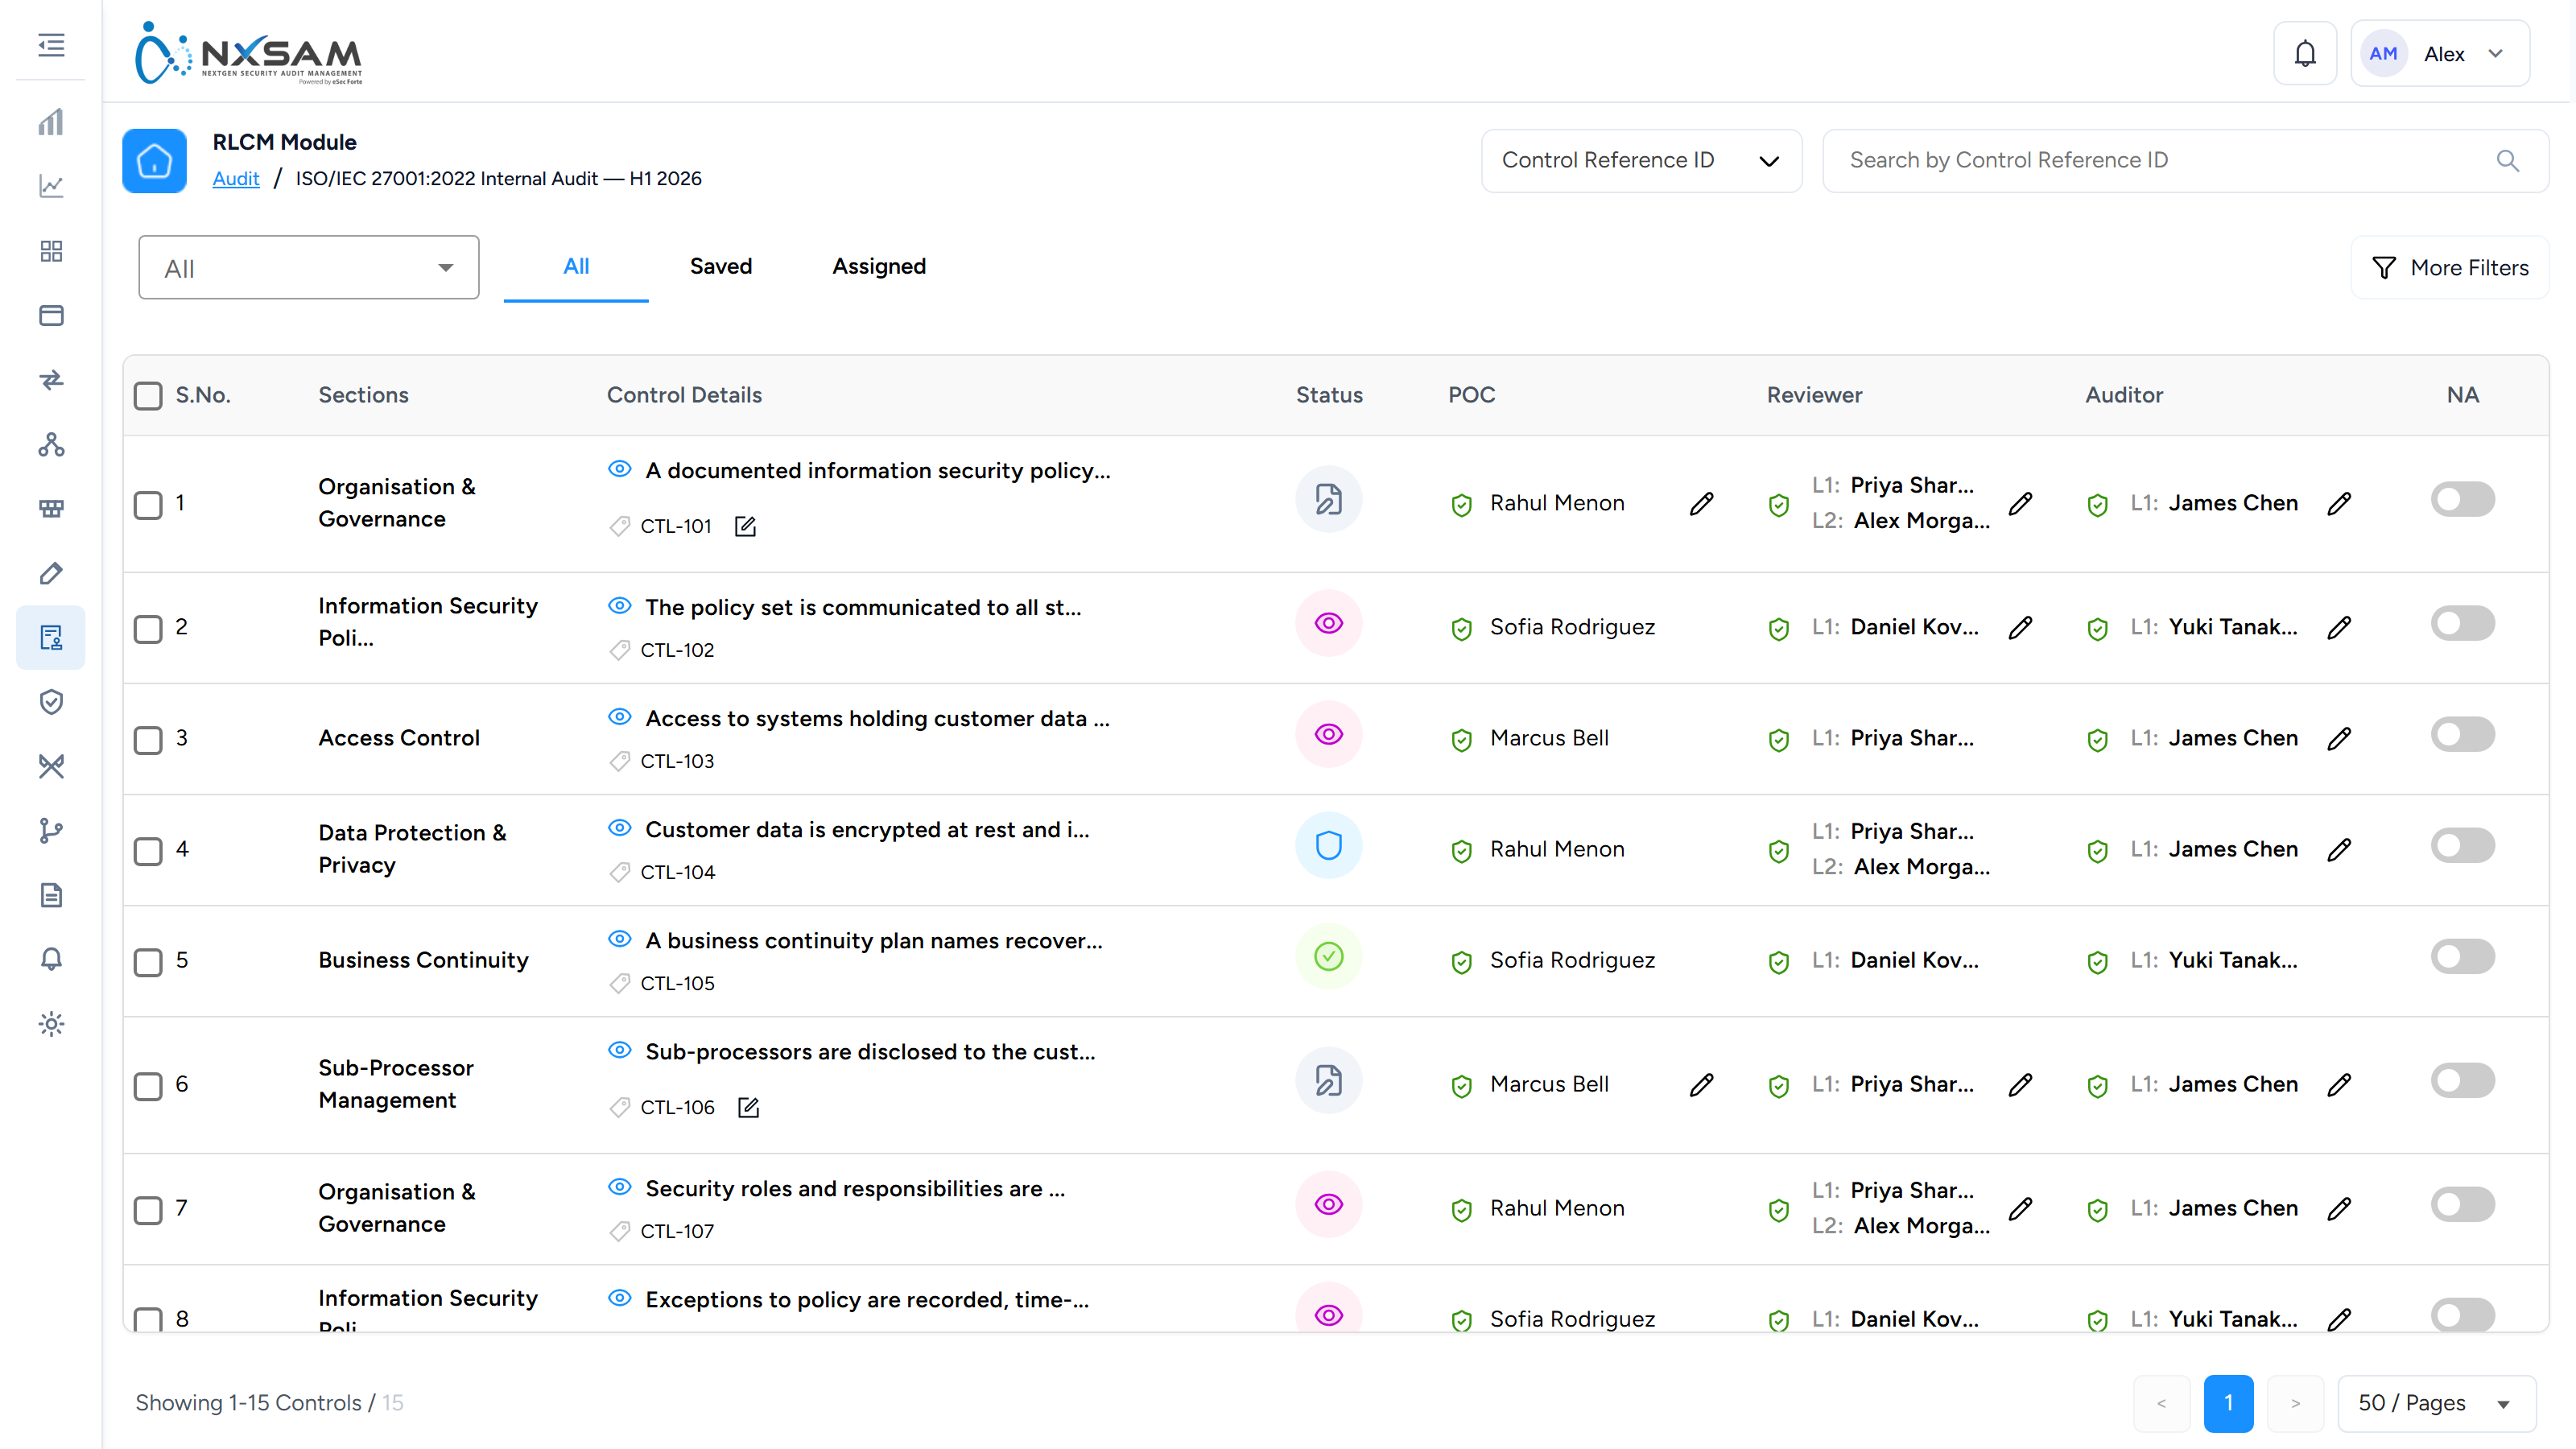
RLCM Audit Properties
Additional fields recorded against a compliance audit.
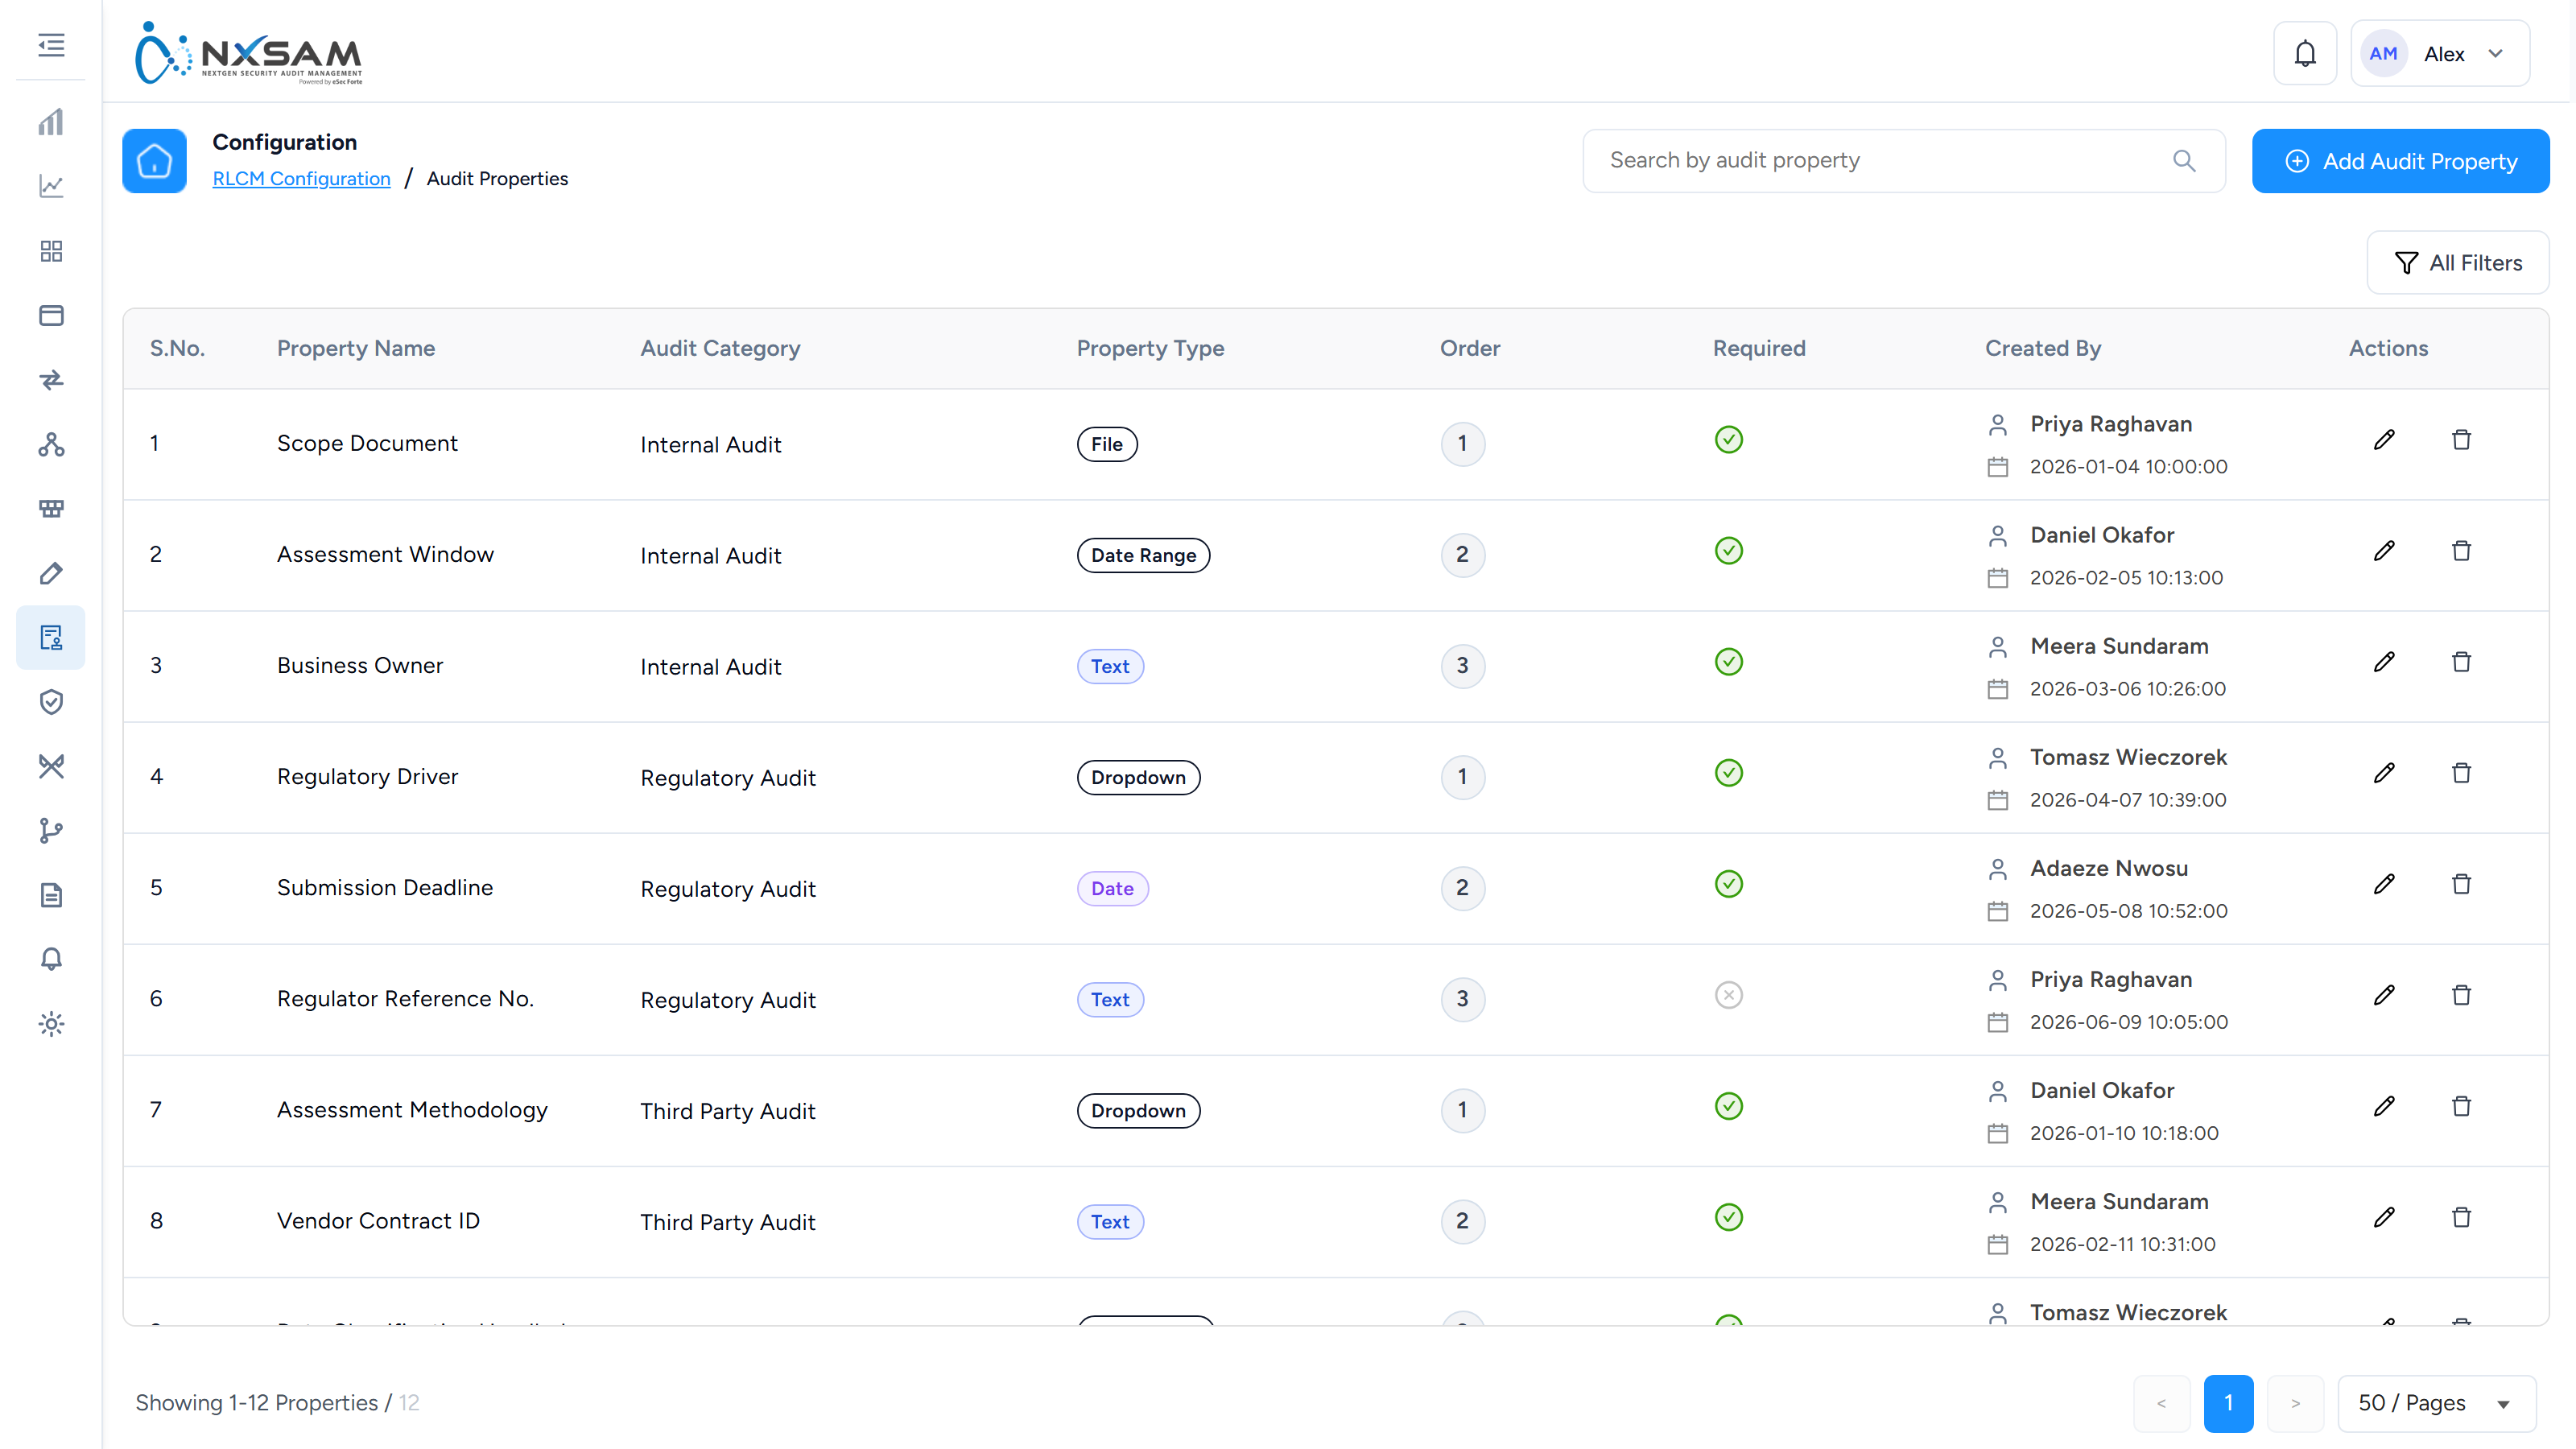
RLCM Audit Statuses
The states a compliance audit moves through, and the permitted transitions.
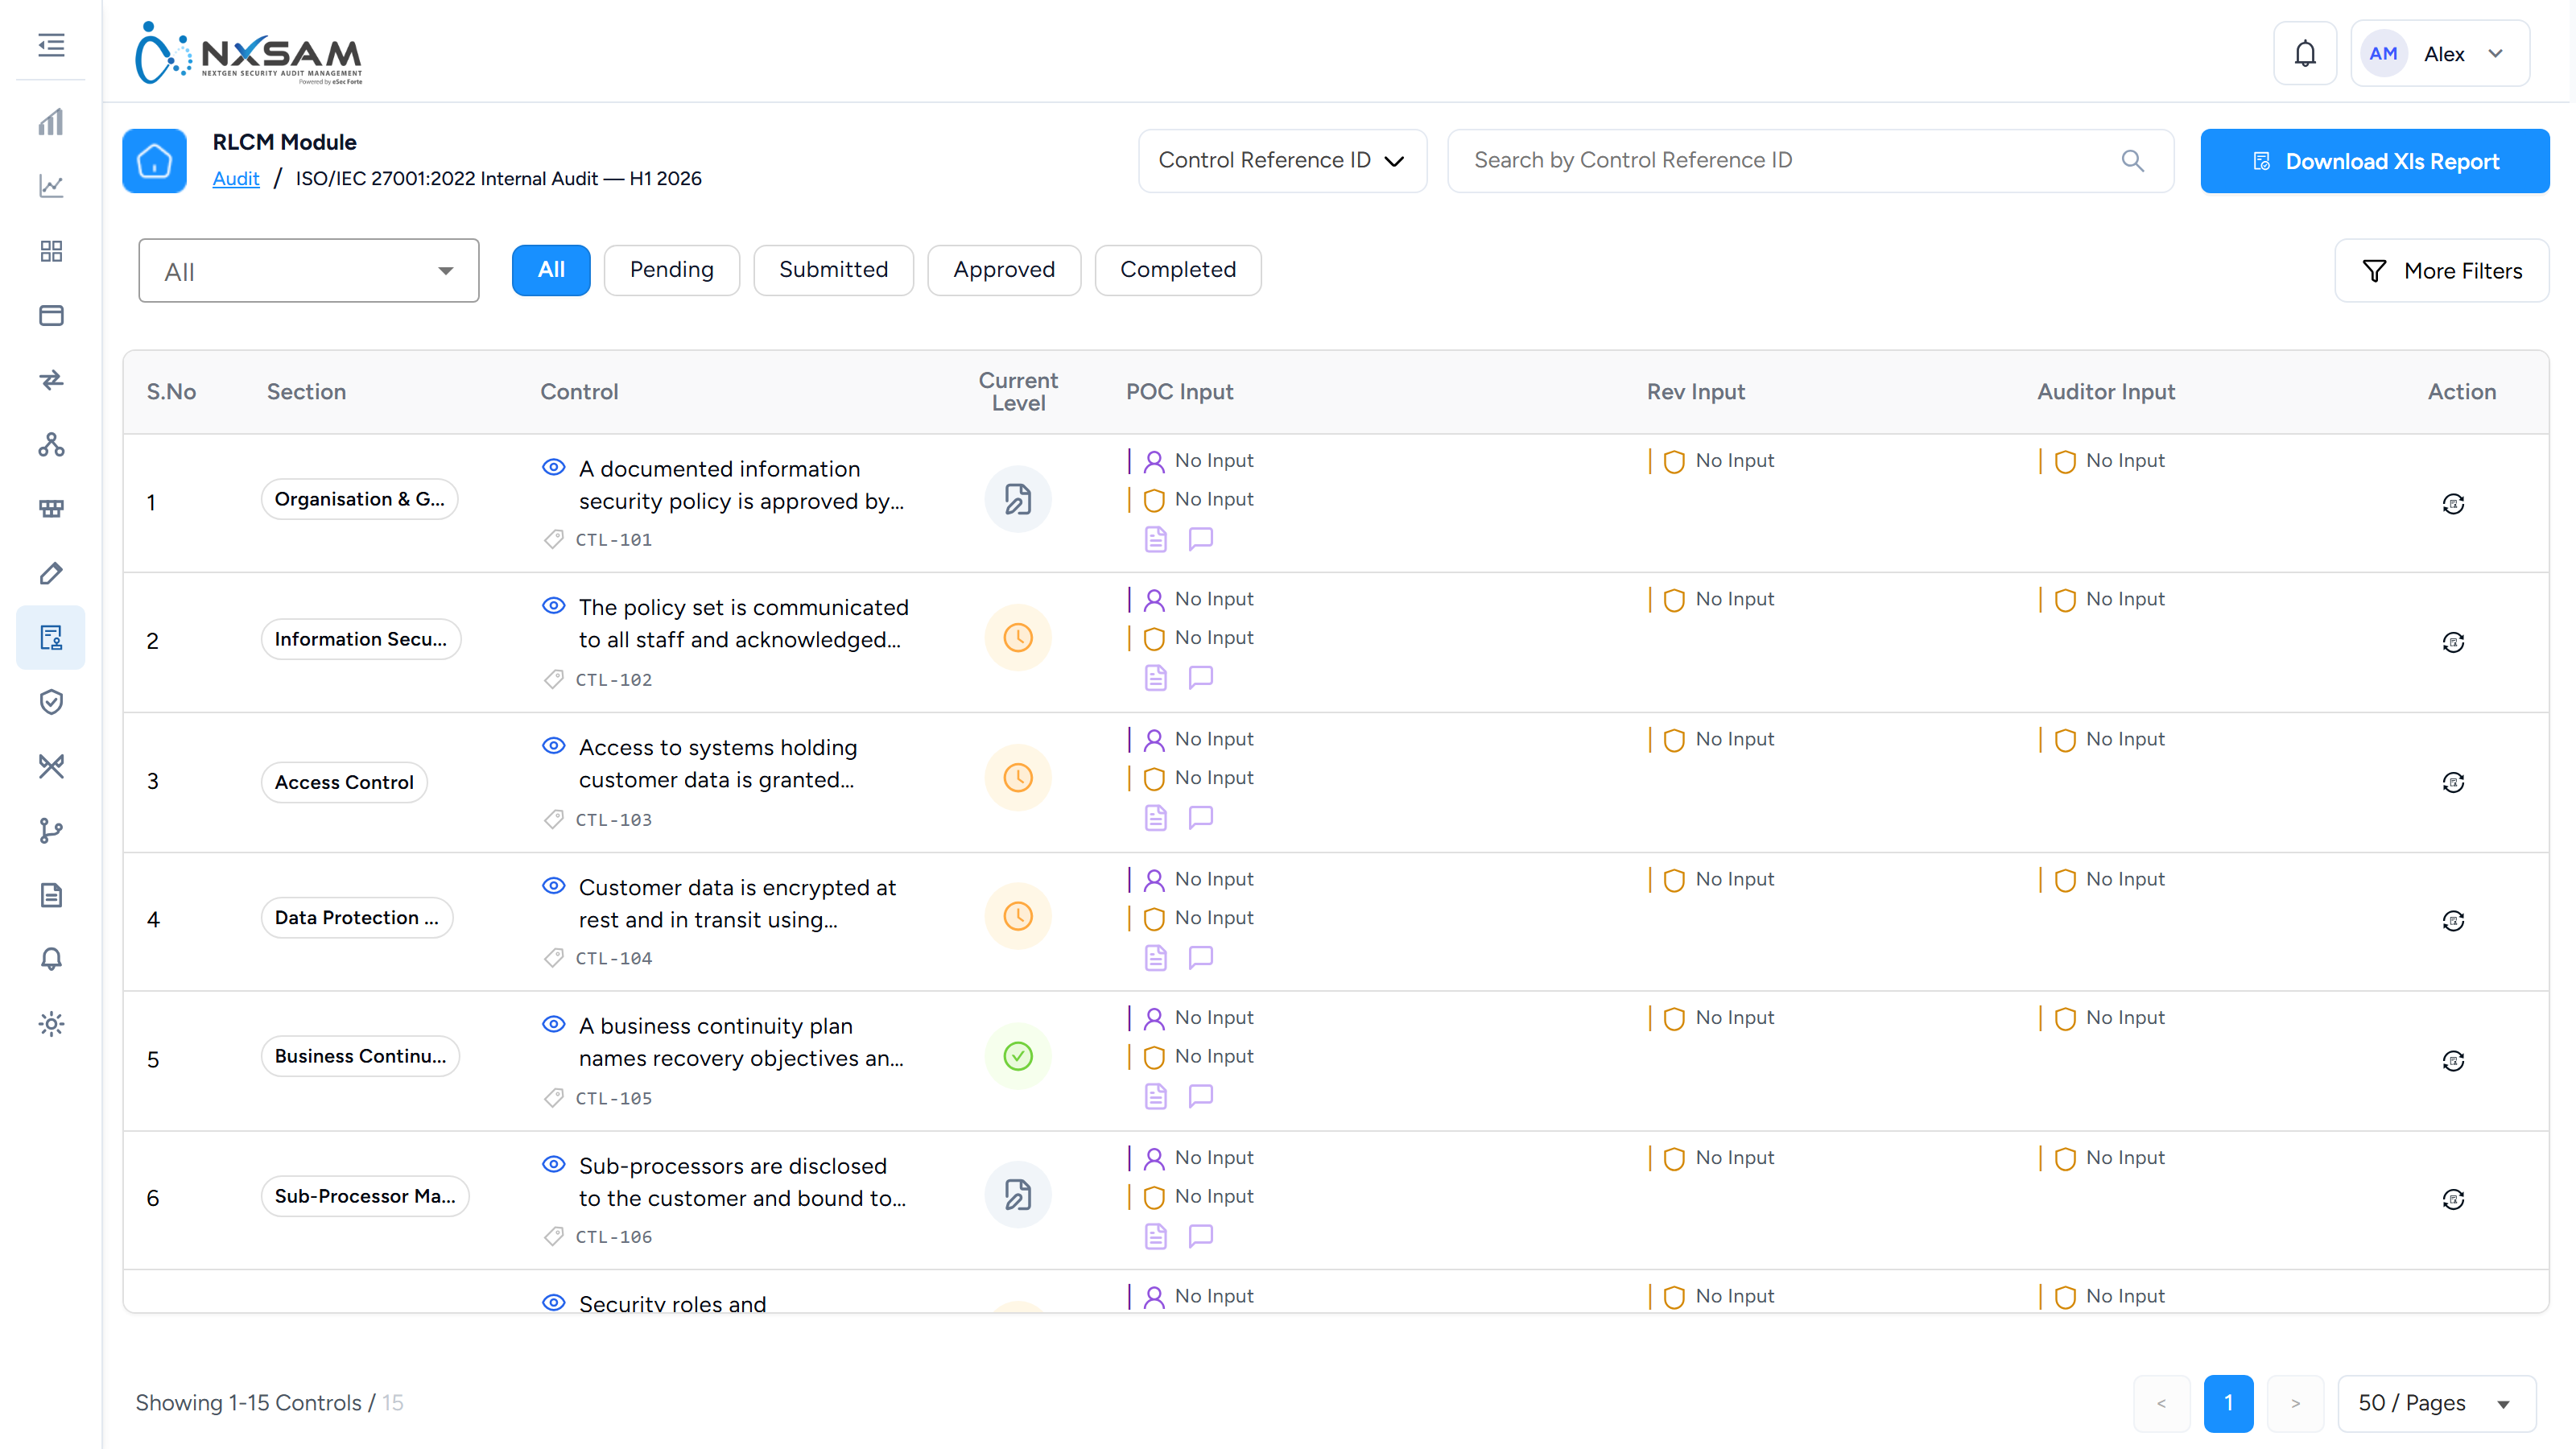
RLCM Dashboard
Compliance posture — findings by audit type, control age, and the top failing process groups and standards.
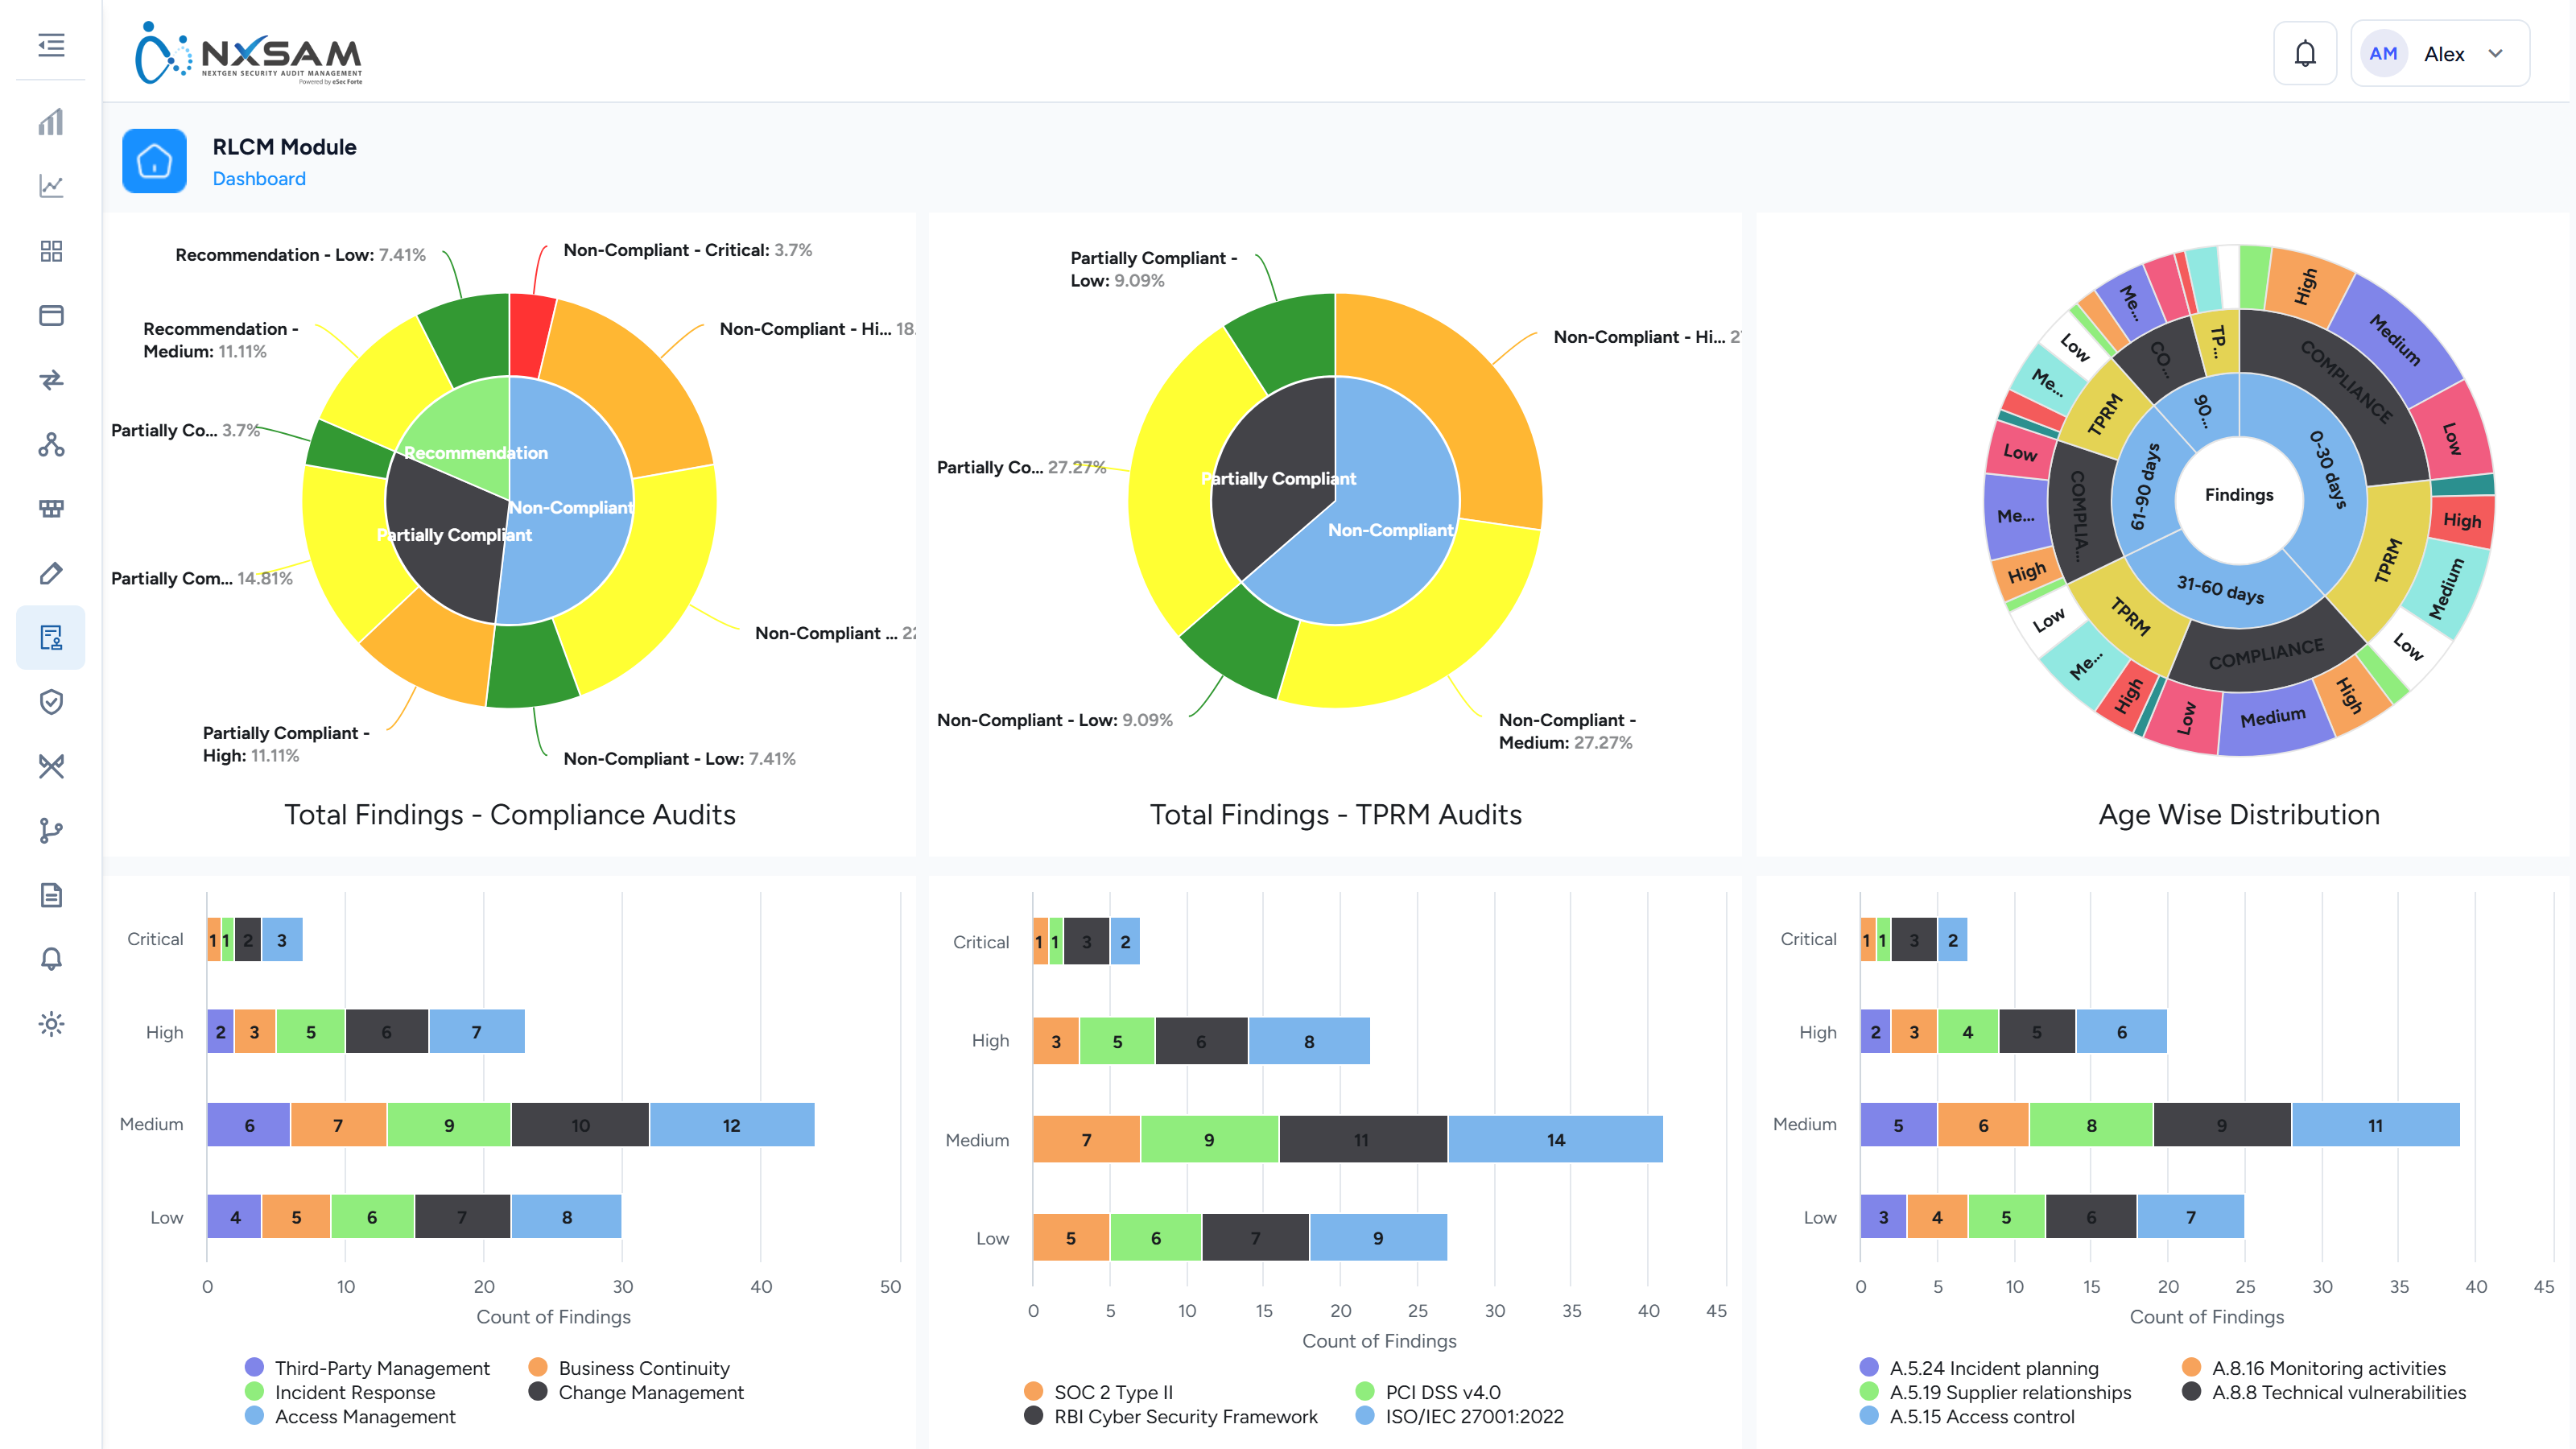
RLCM Domains
The top-level grouping above process groups.
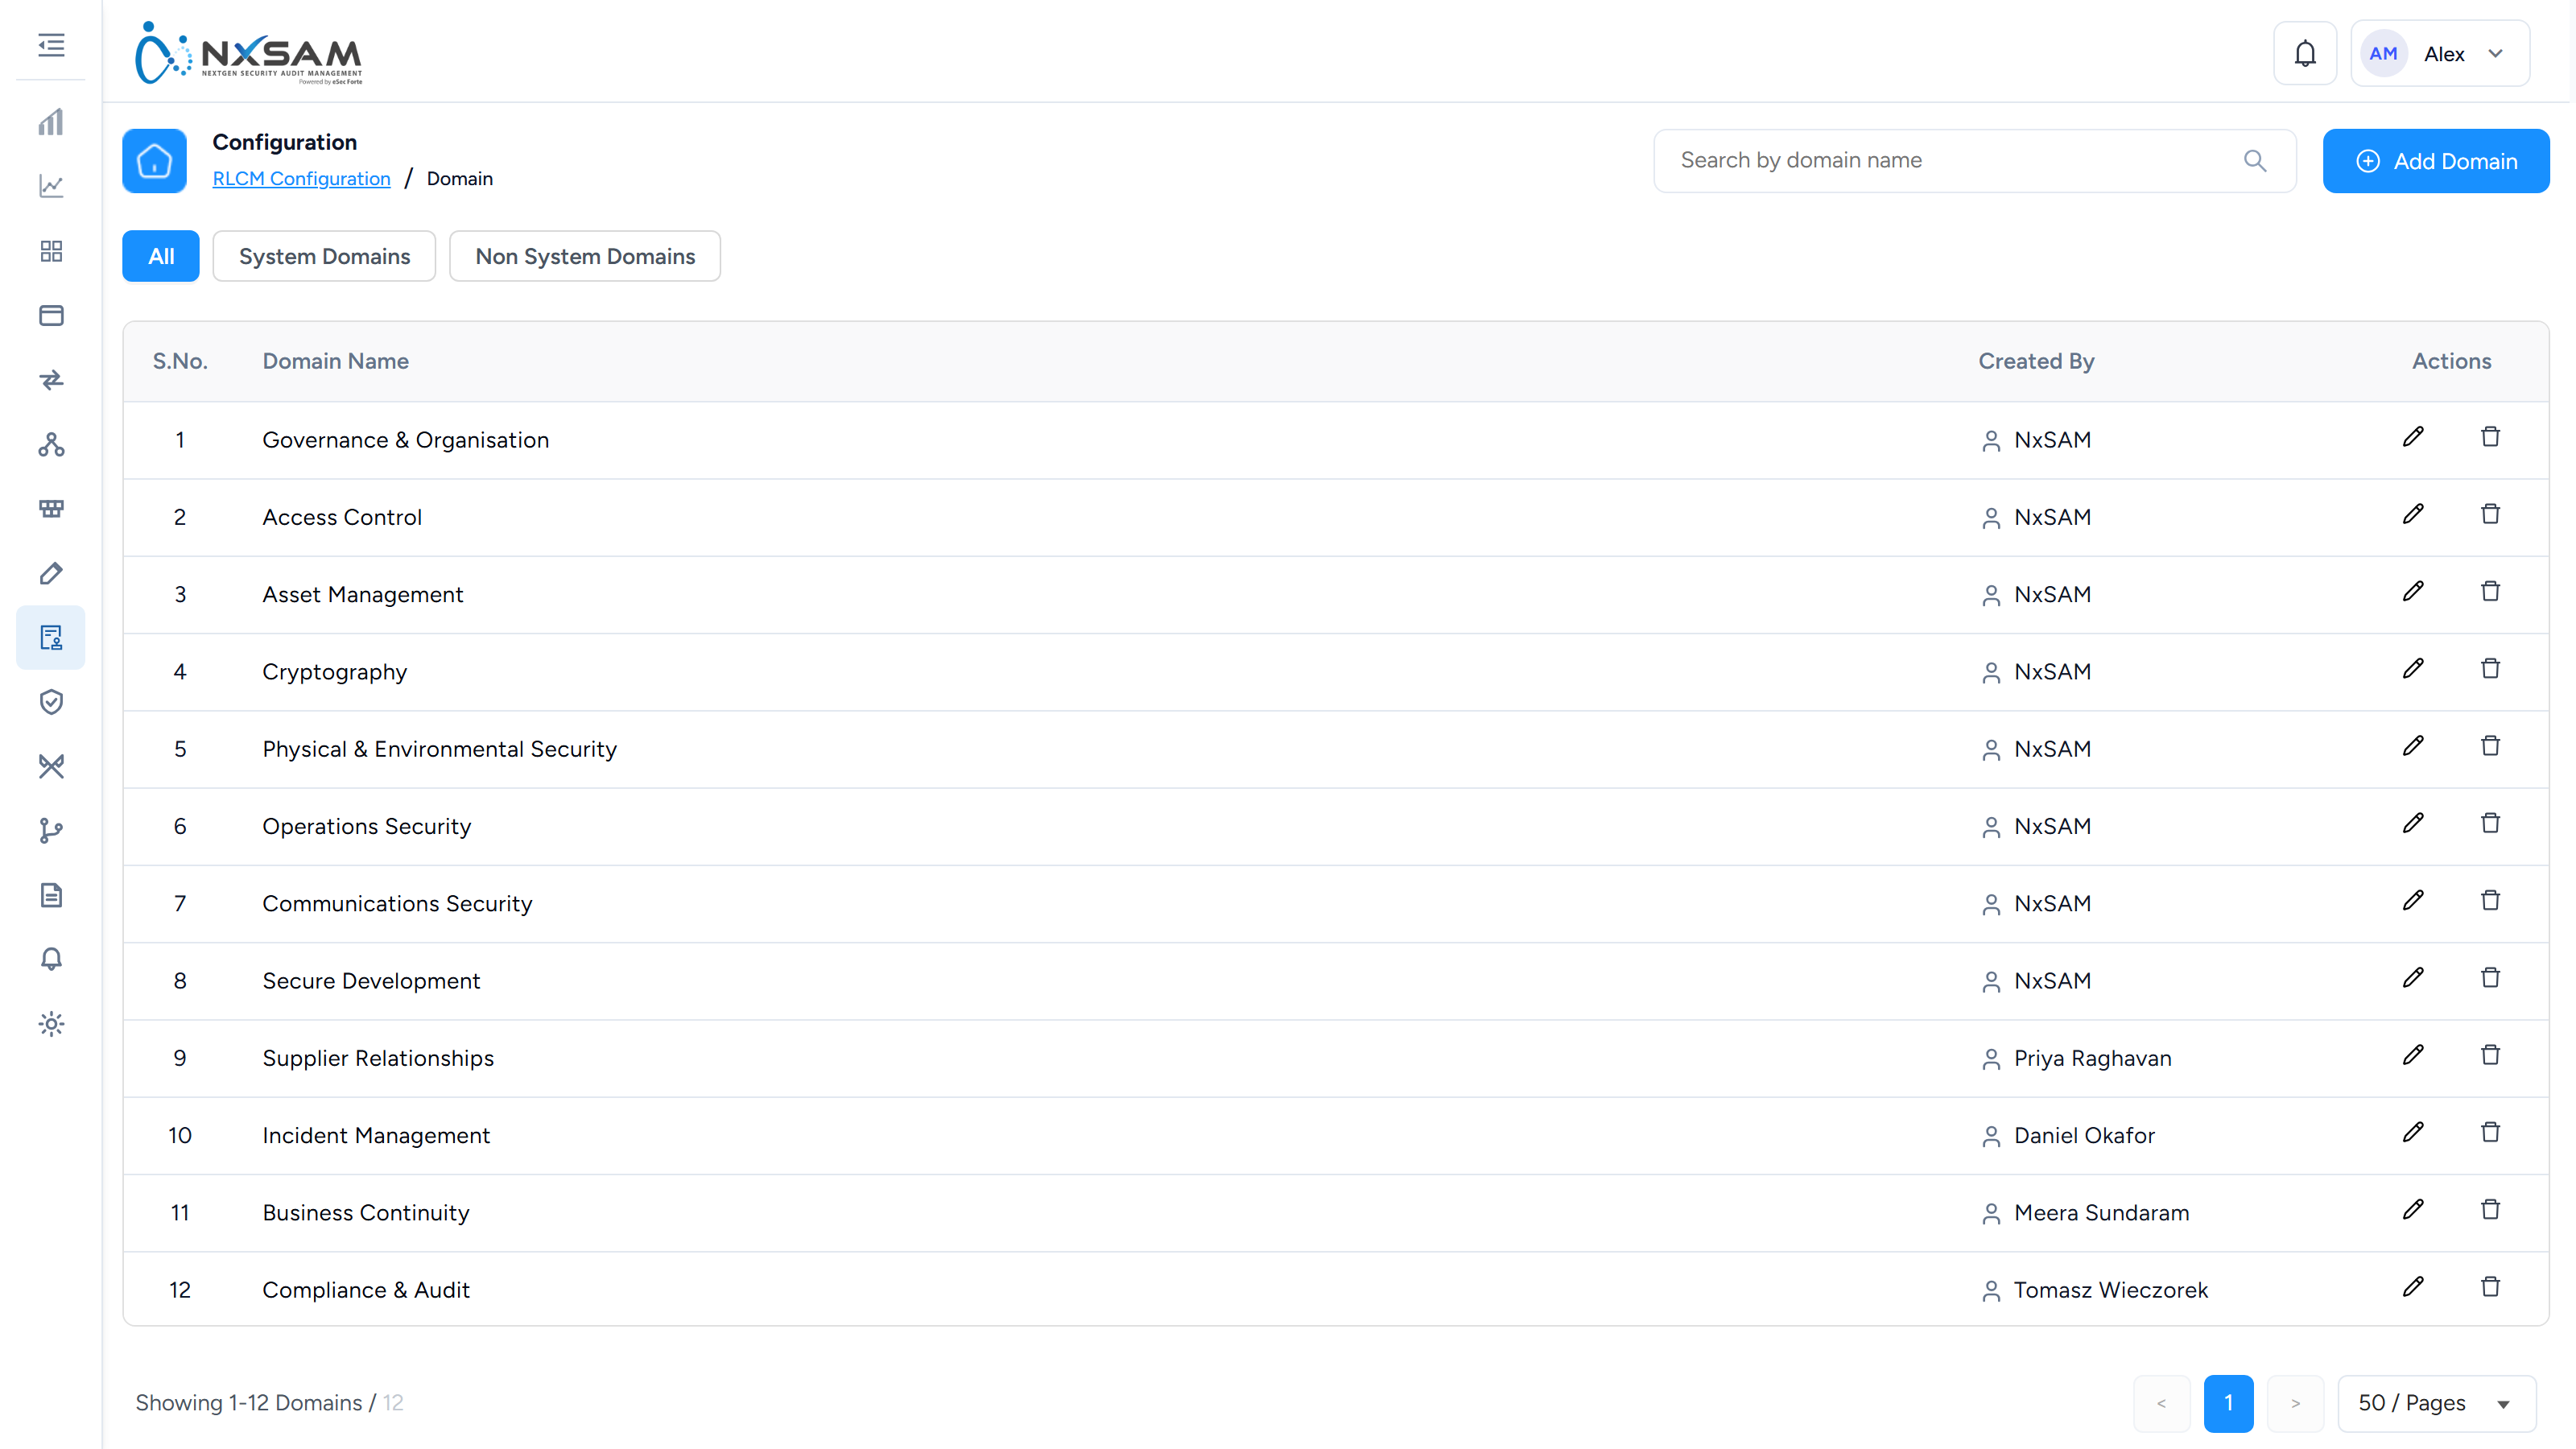
RLCM General Configuration
Module-wide settings for compliance management.
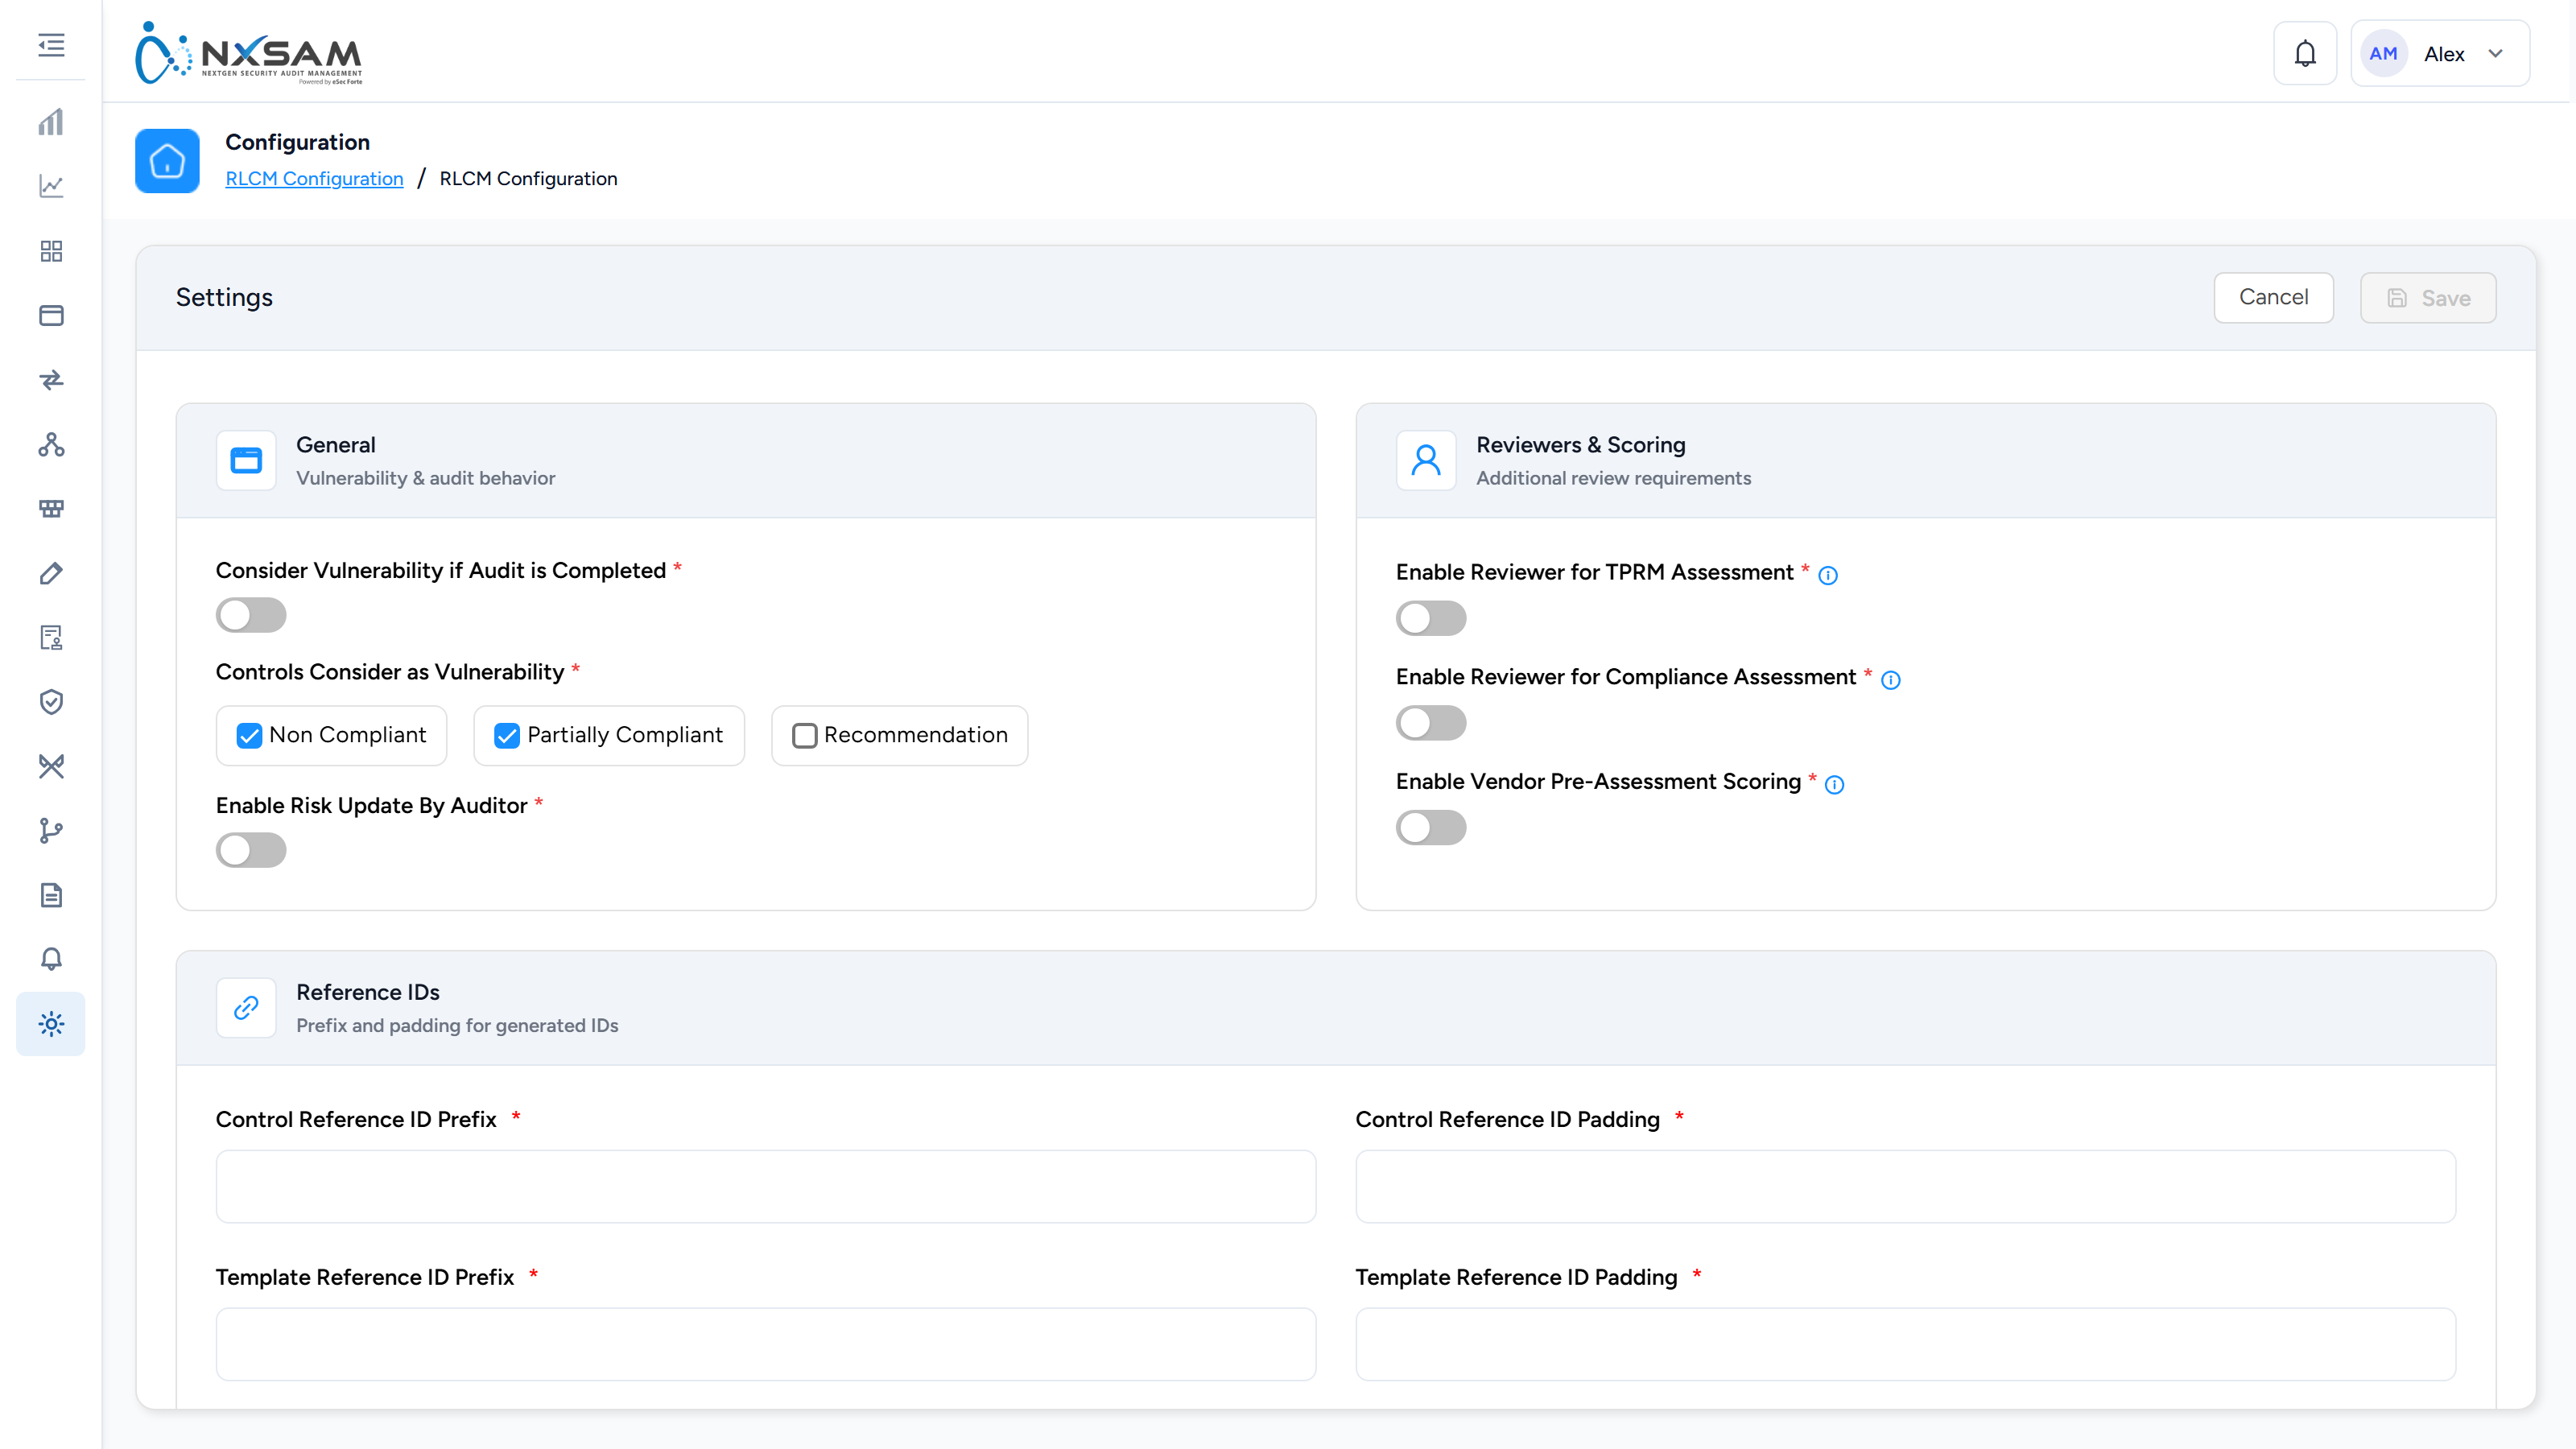
RLCM Risk Statuses
The states a compliance risk moves through as it is treated.
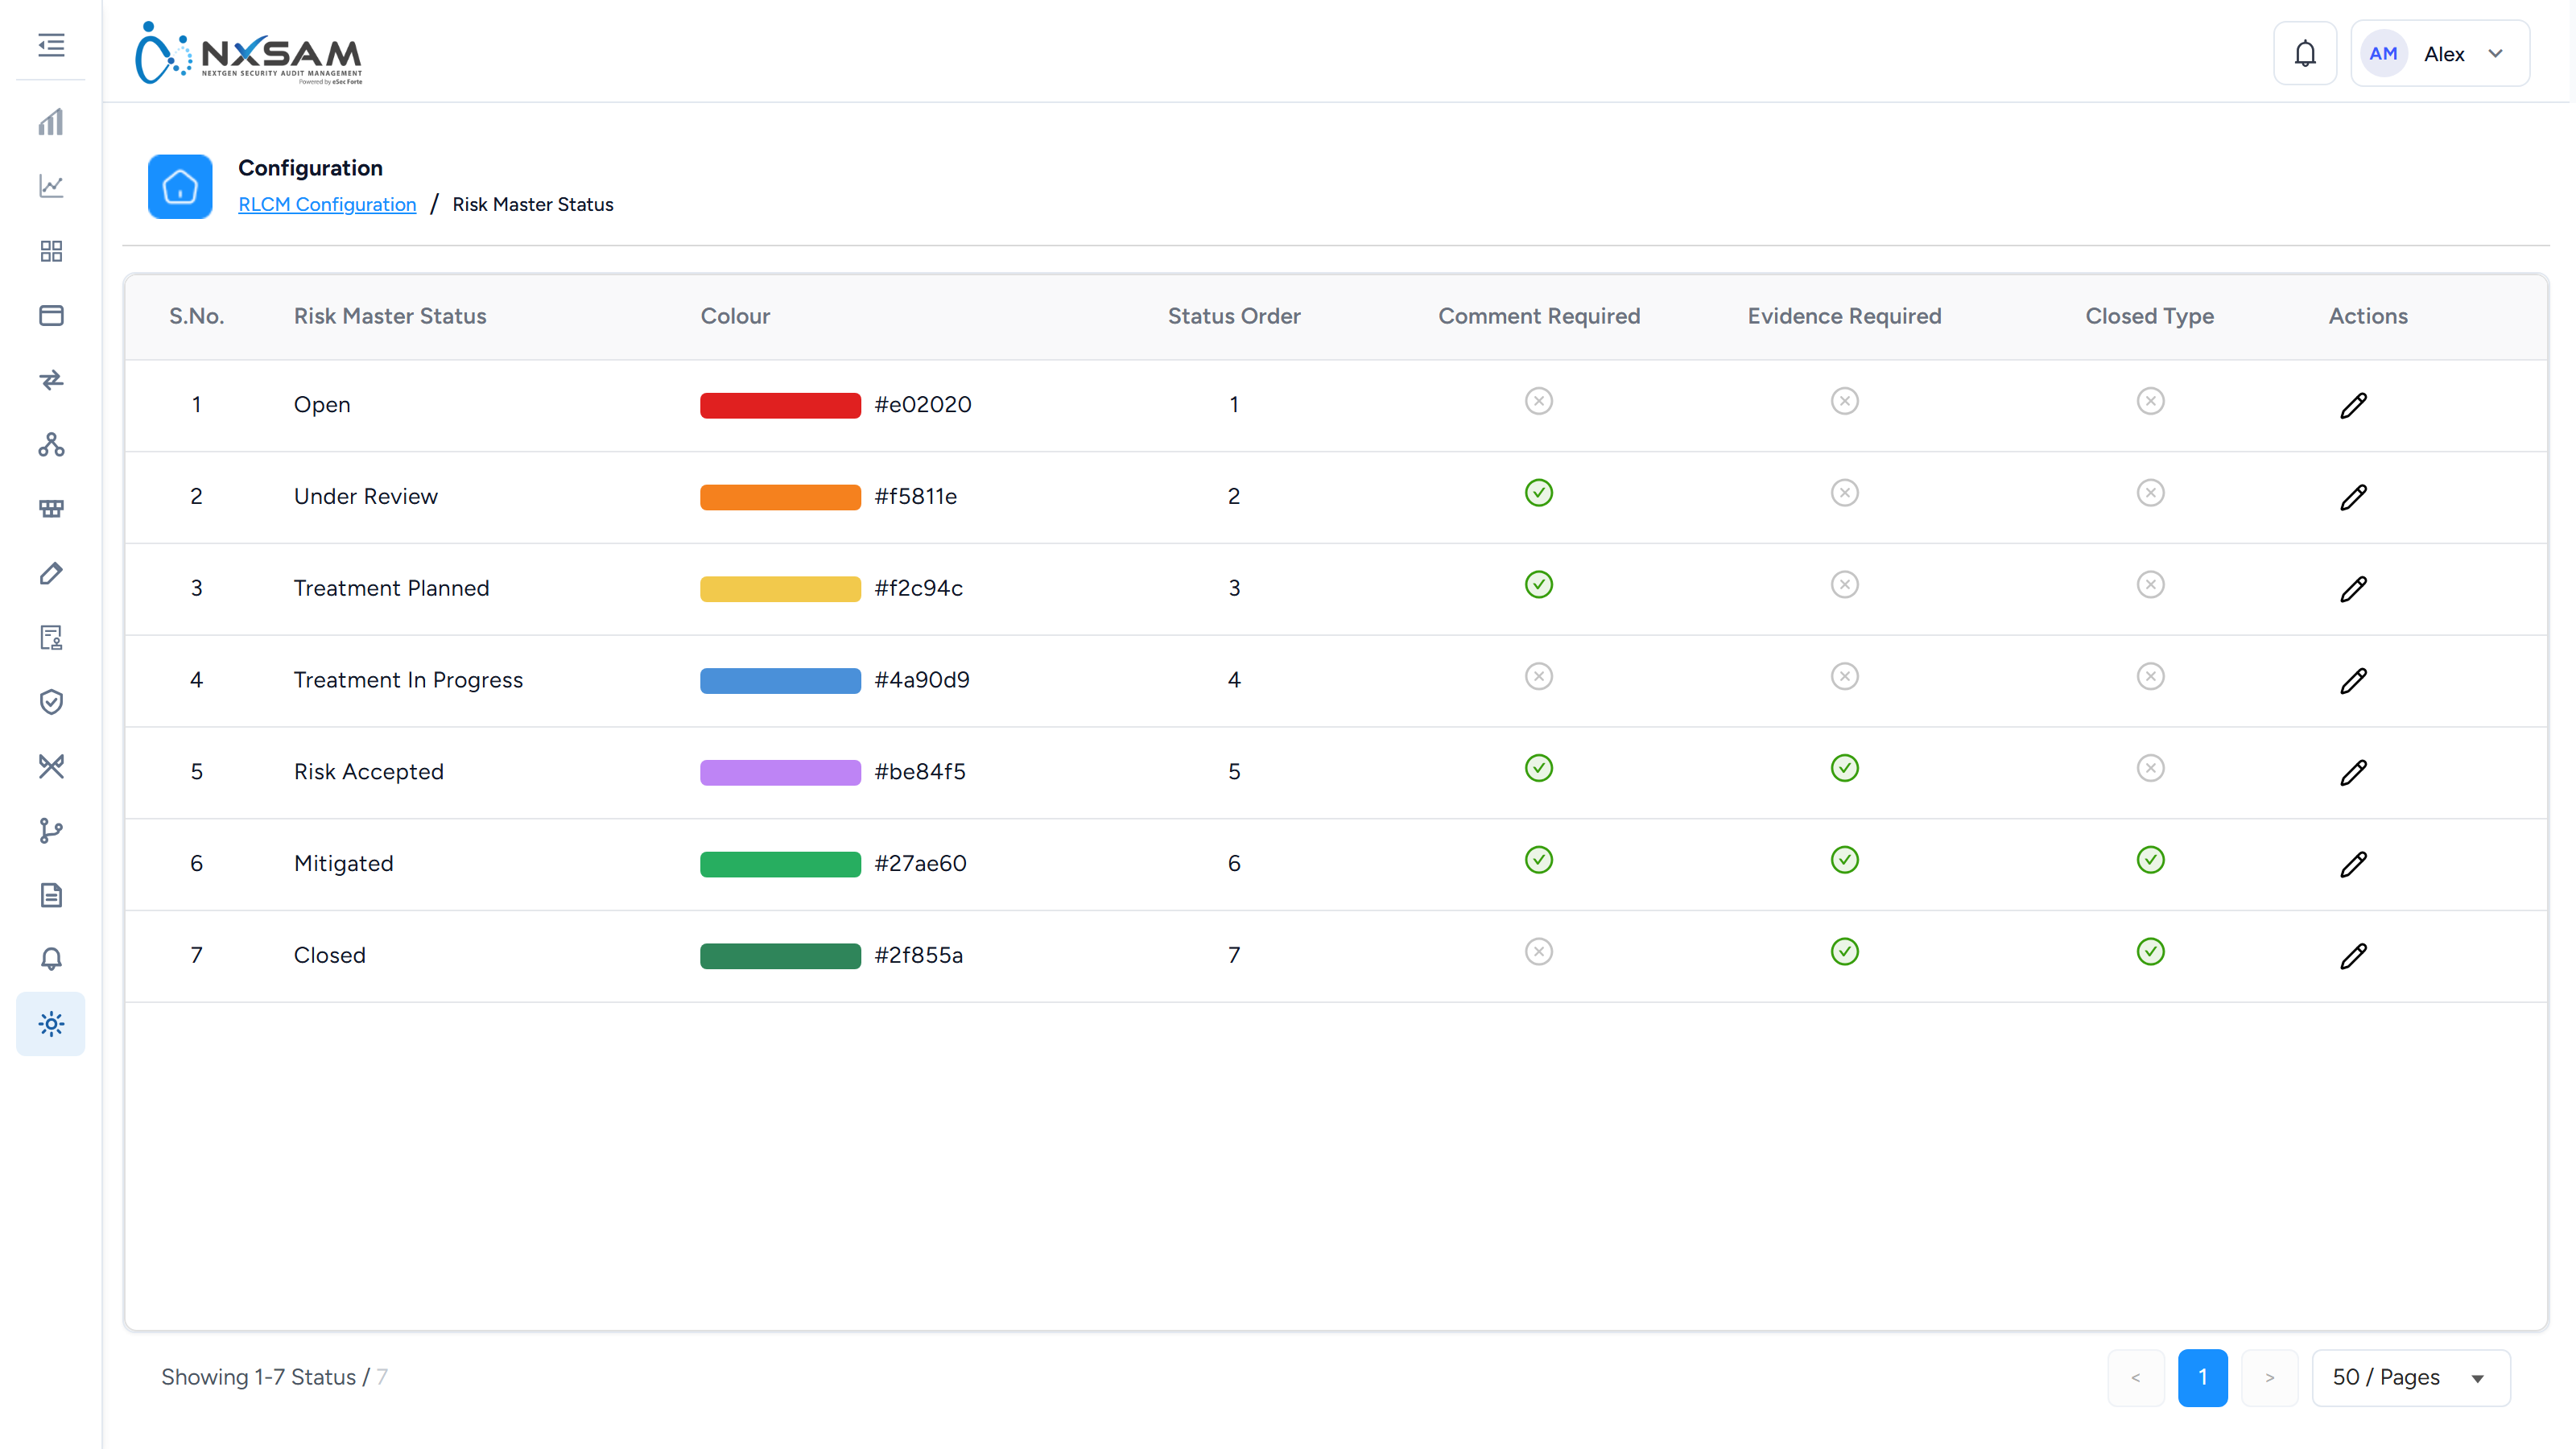
Recurring Assessments
Standing instructions that raise an assessment automatically on a frequency, with its assignees already set. Titled "Purging Configurations" in the product; nothing on it deletes data.
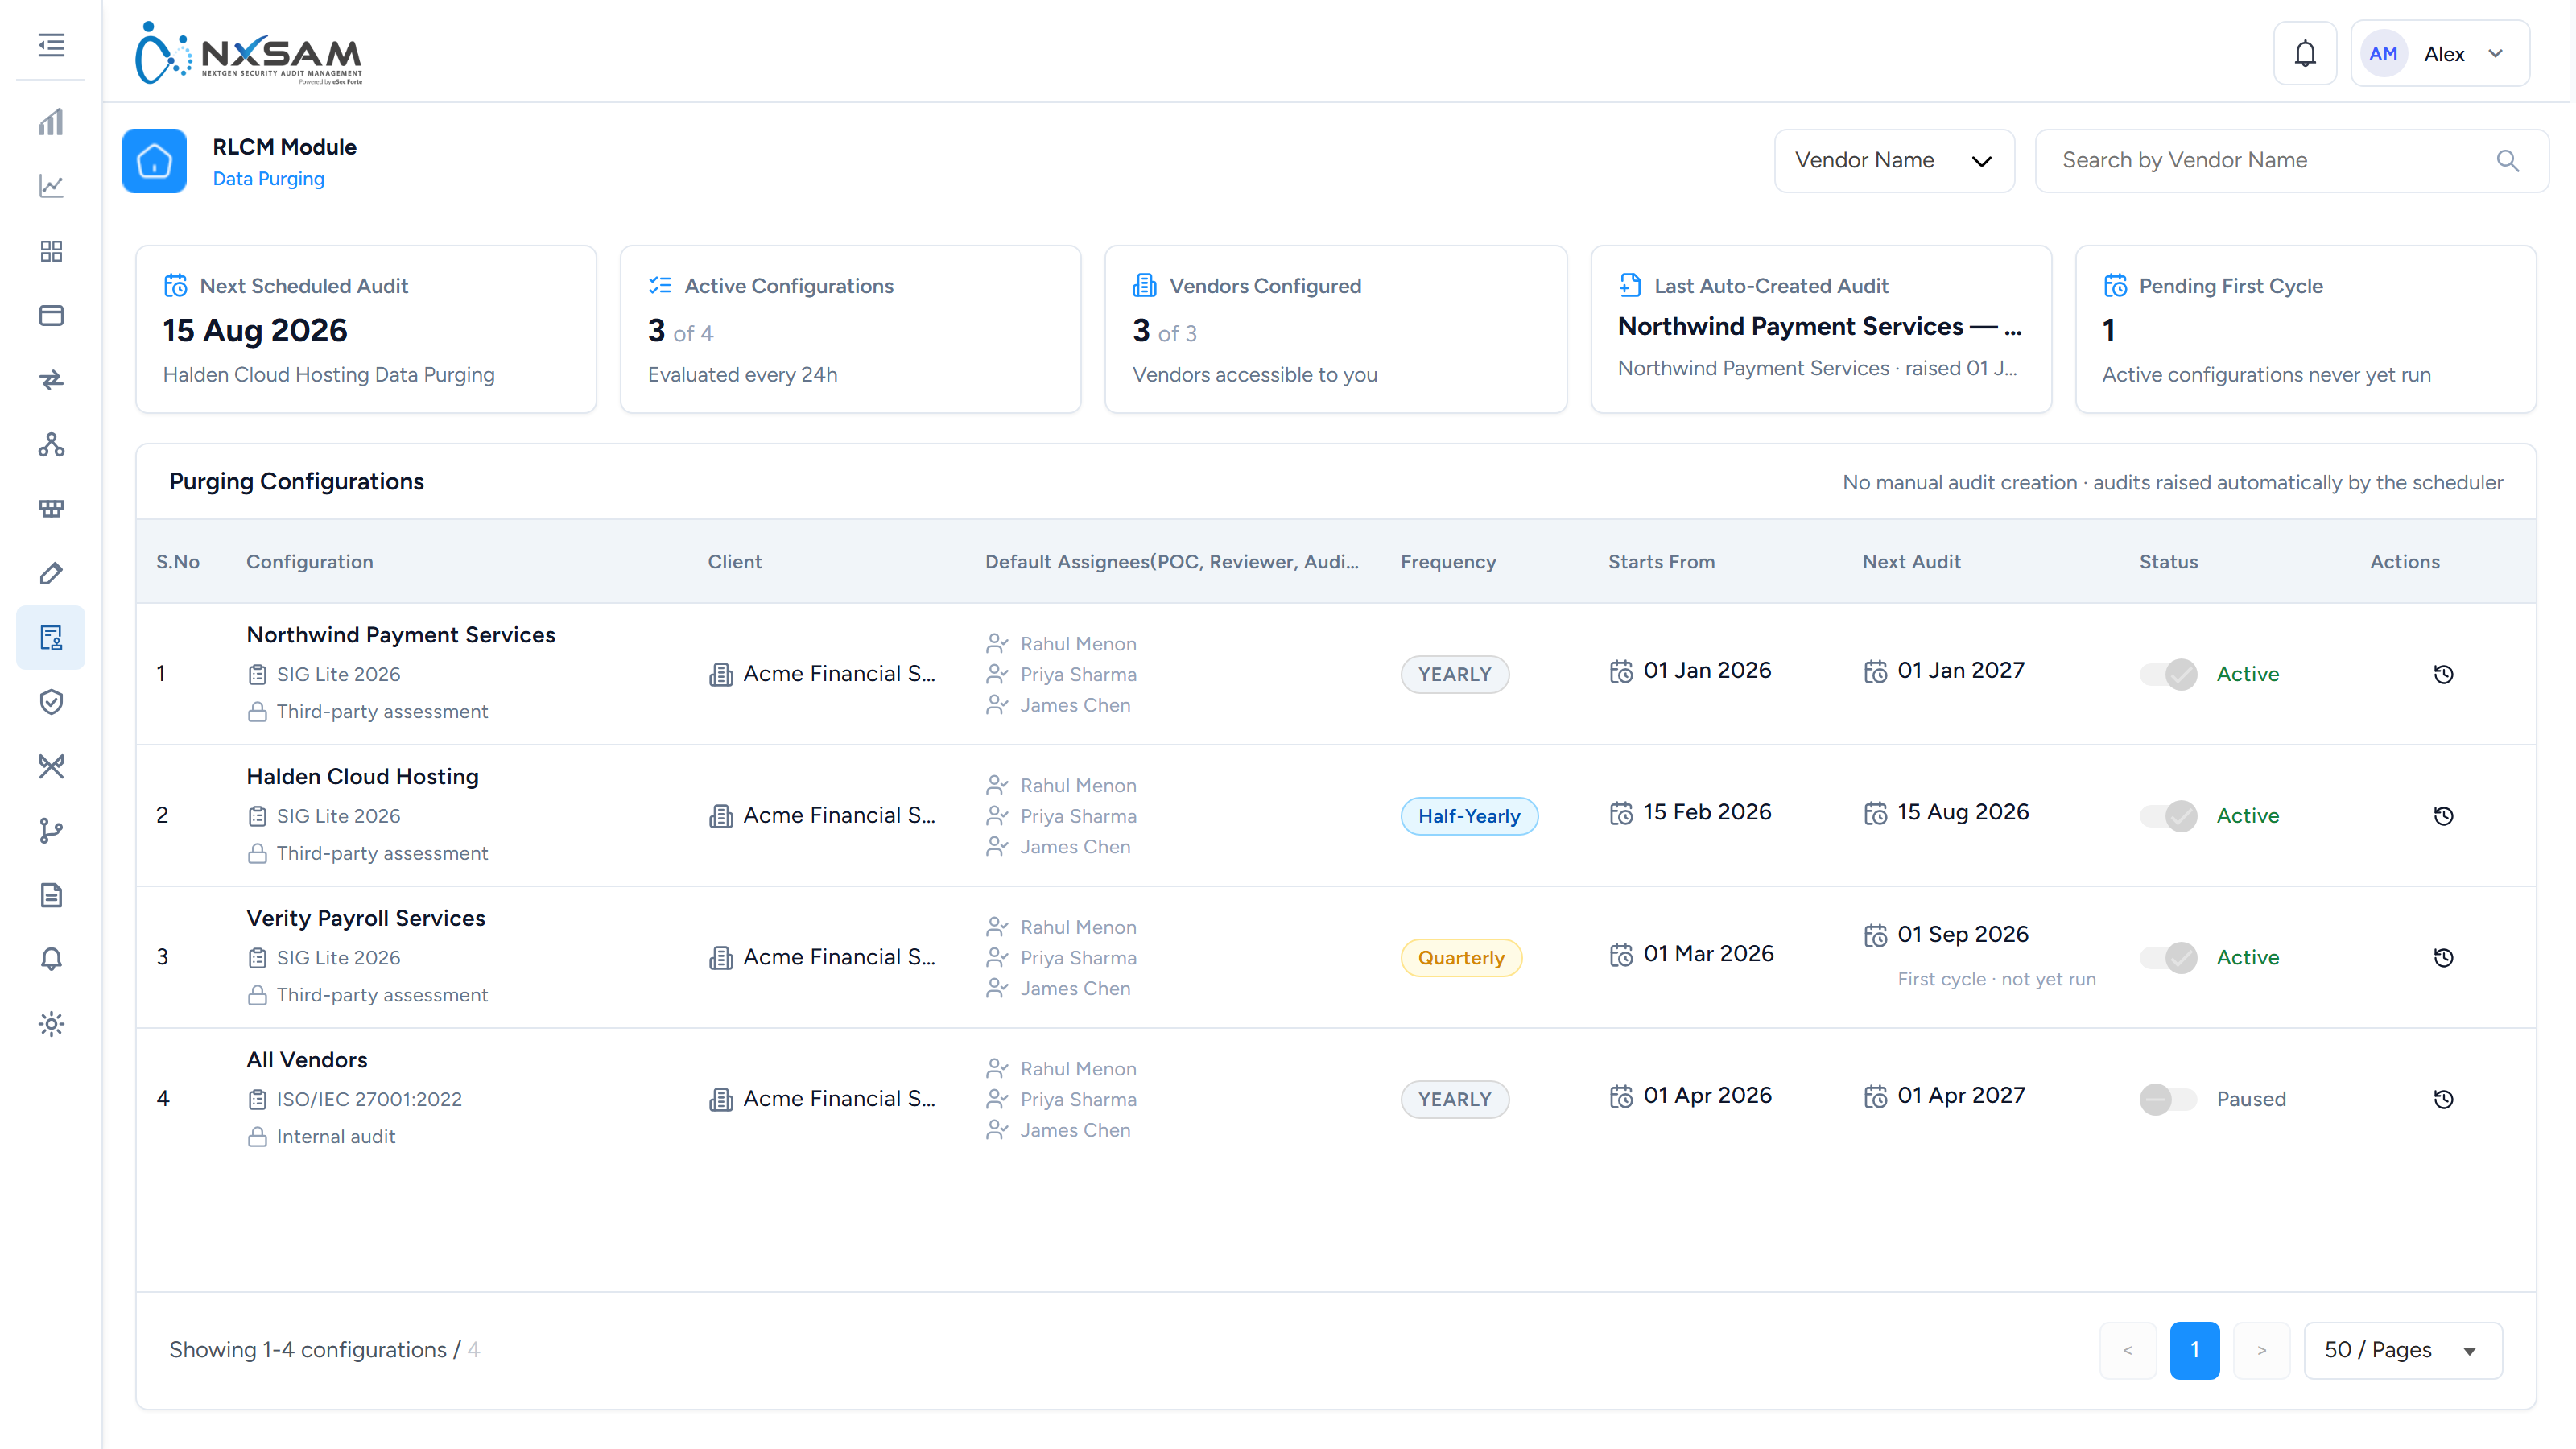
Risk Levels
The rating scale used for compliance risk, separate from technical severity.
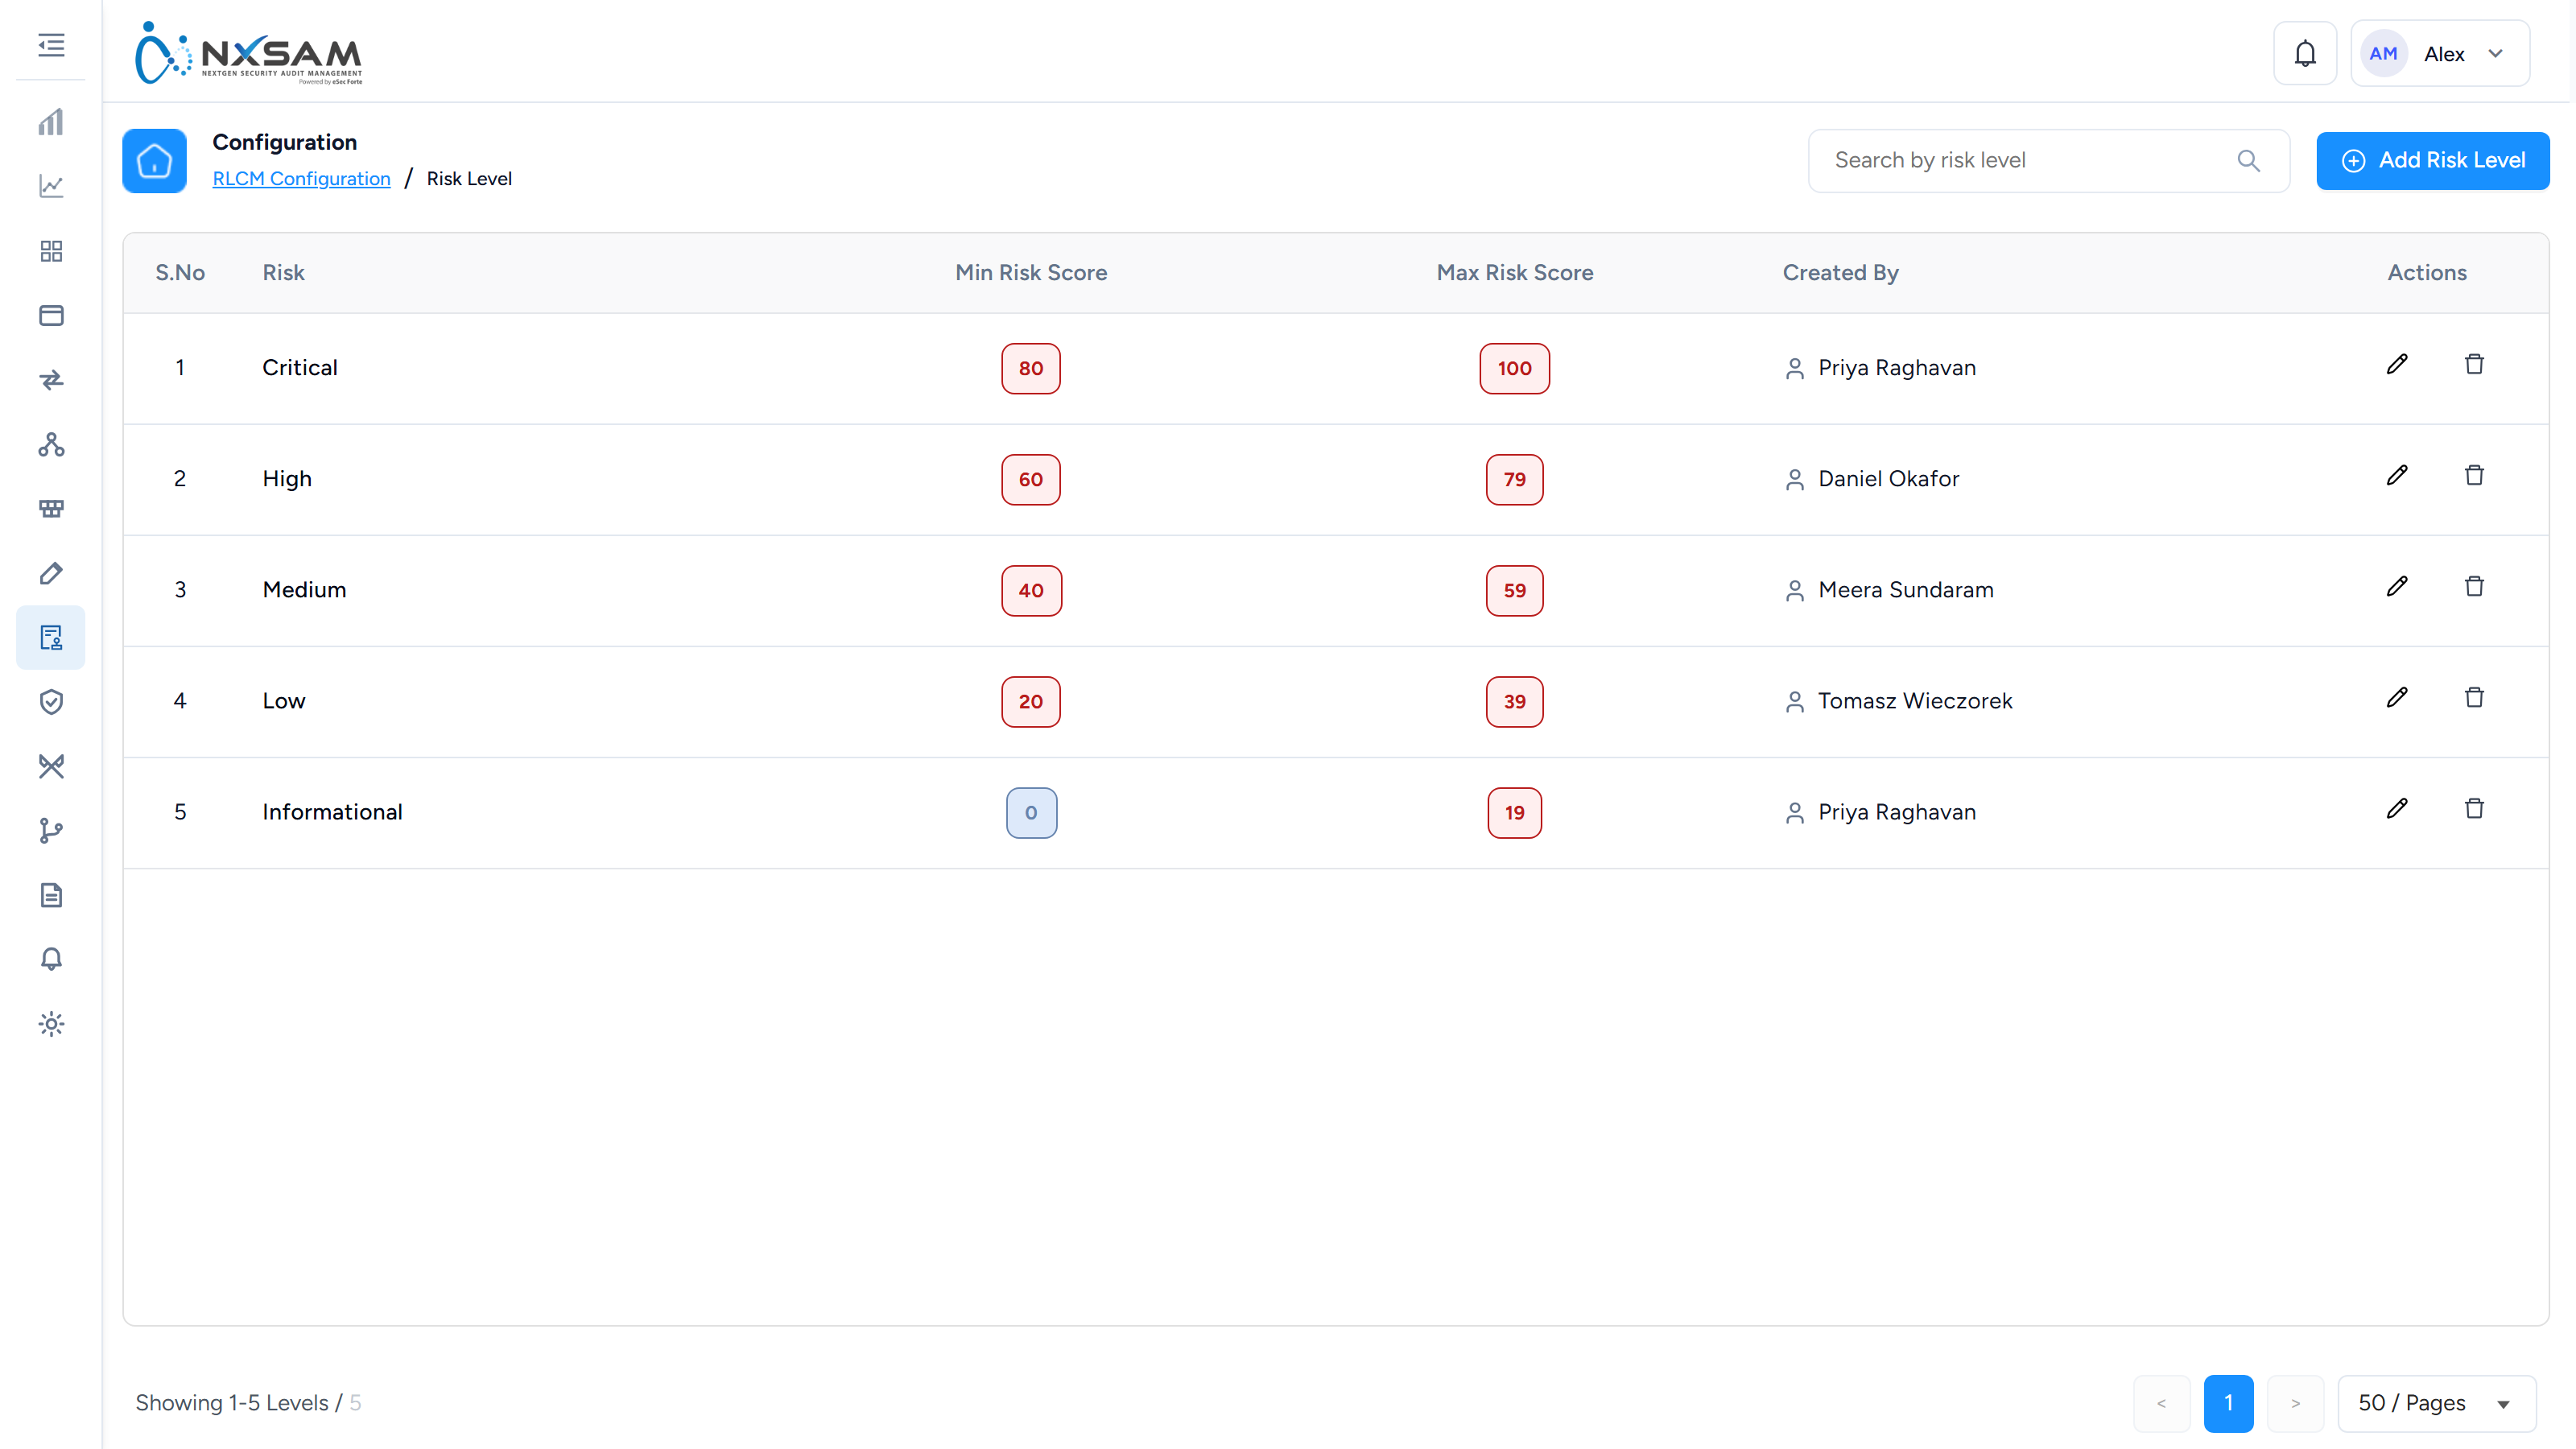
Risk Master
The catalogue of risks that can be raised, so wording stays consistent between assessments.
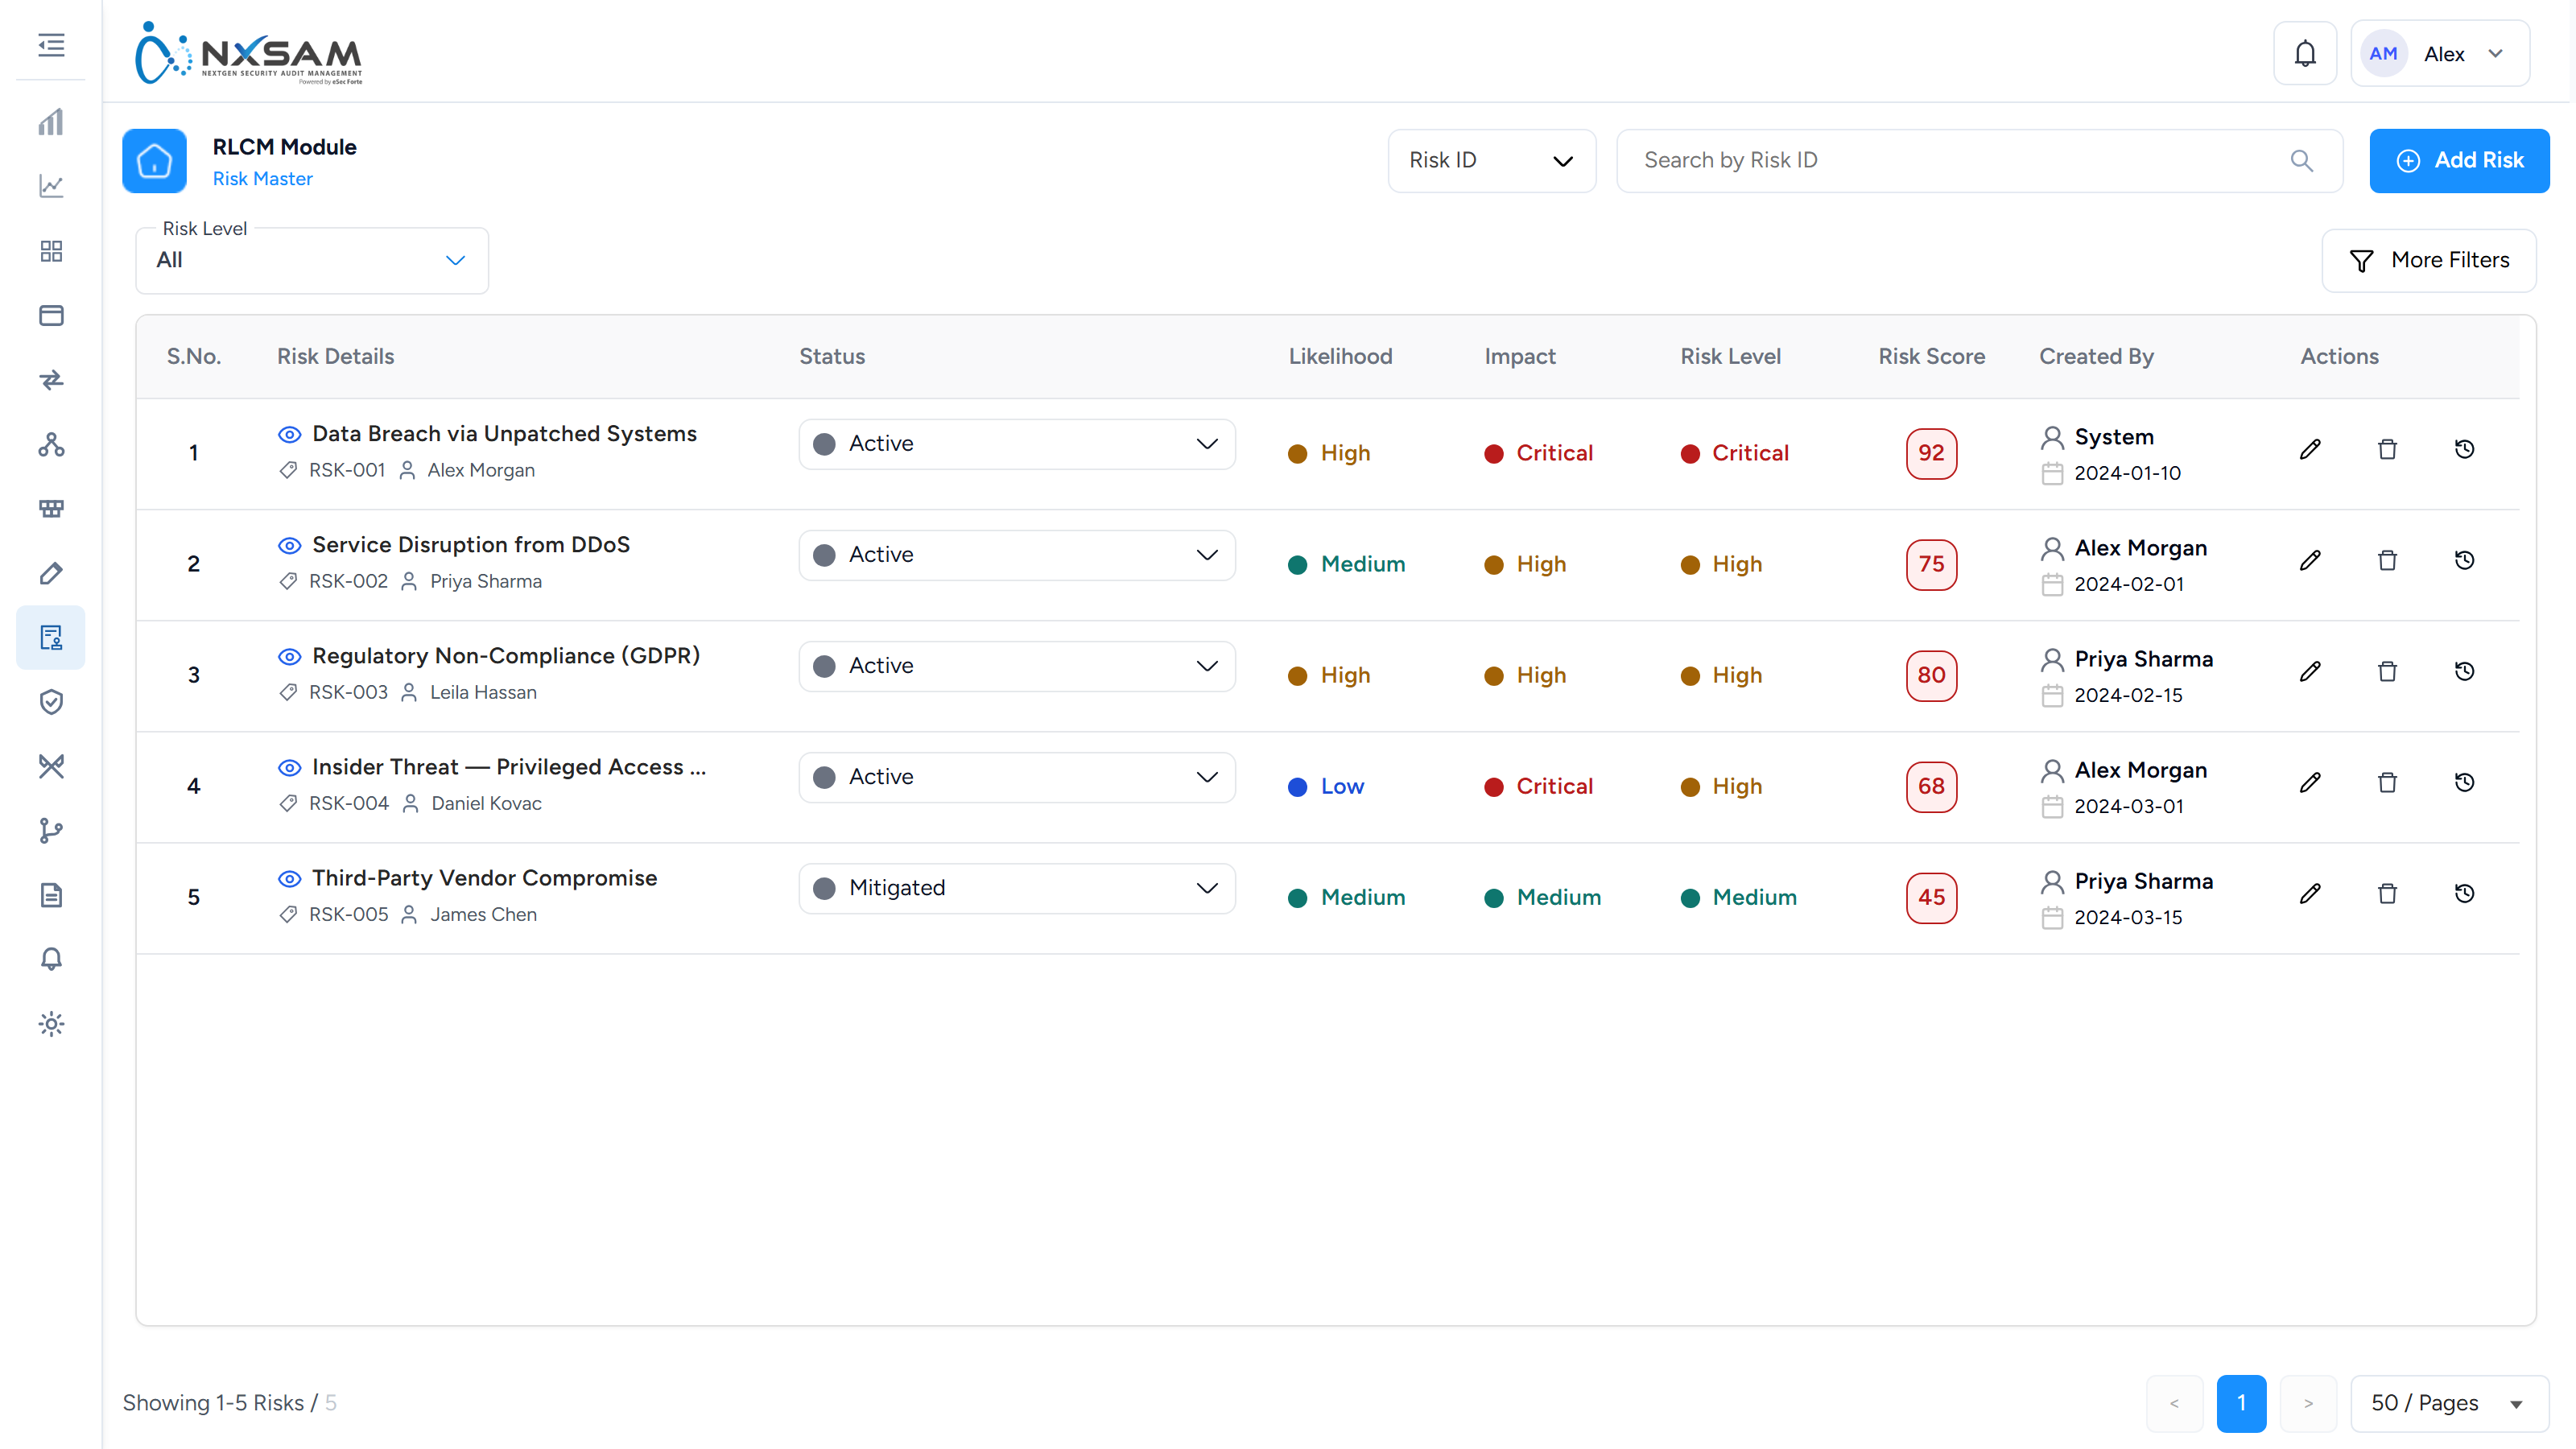
Risk Properties
Additional attributes recorded against a compliance risk.
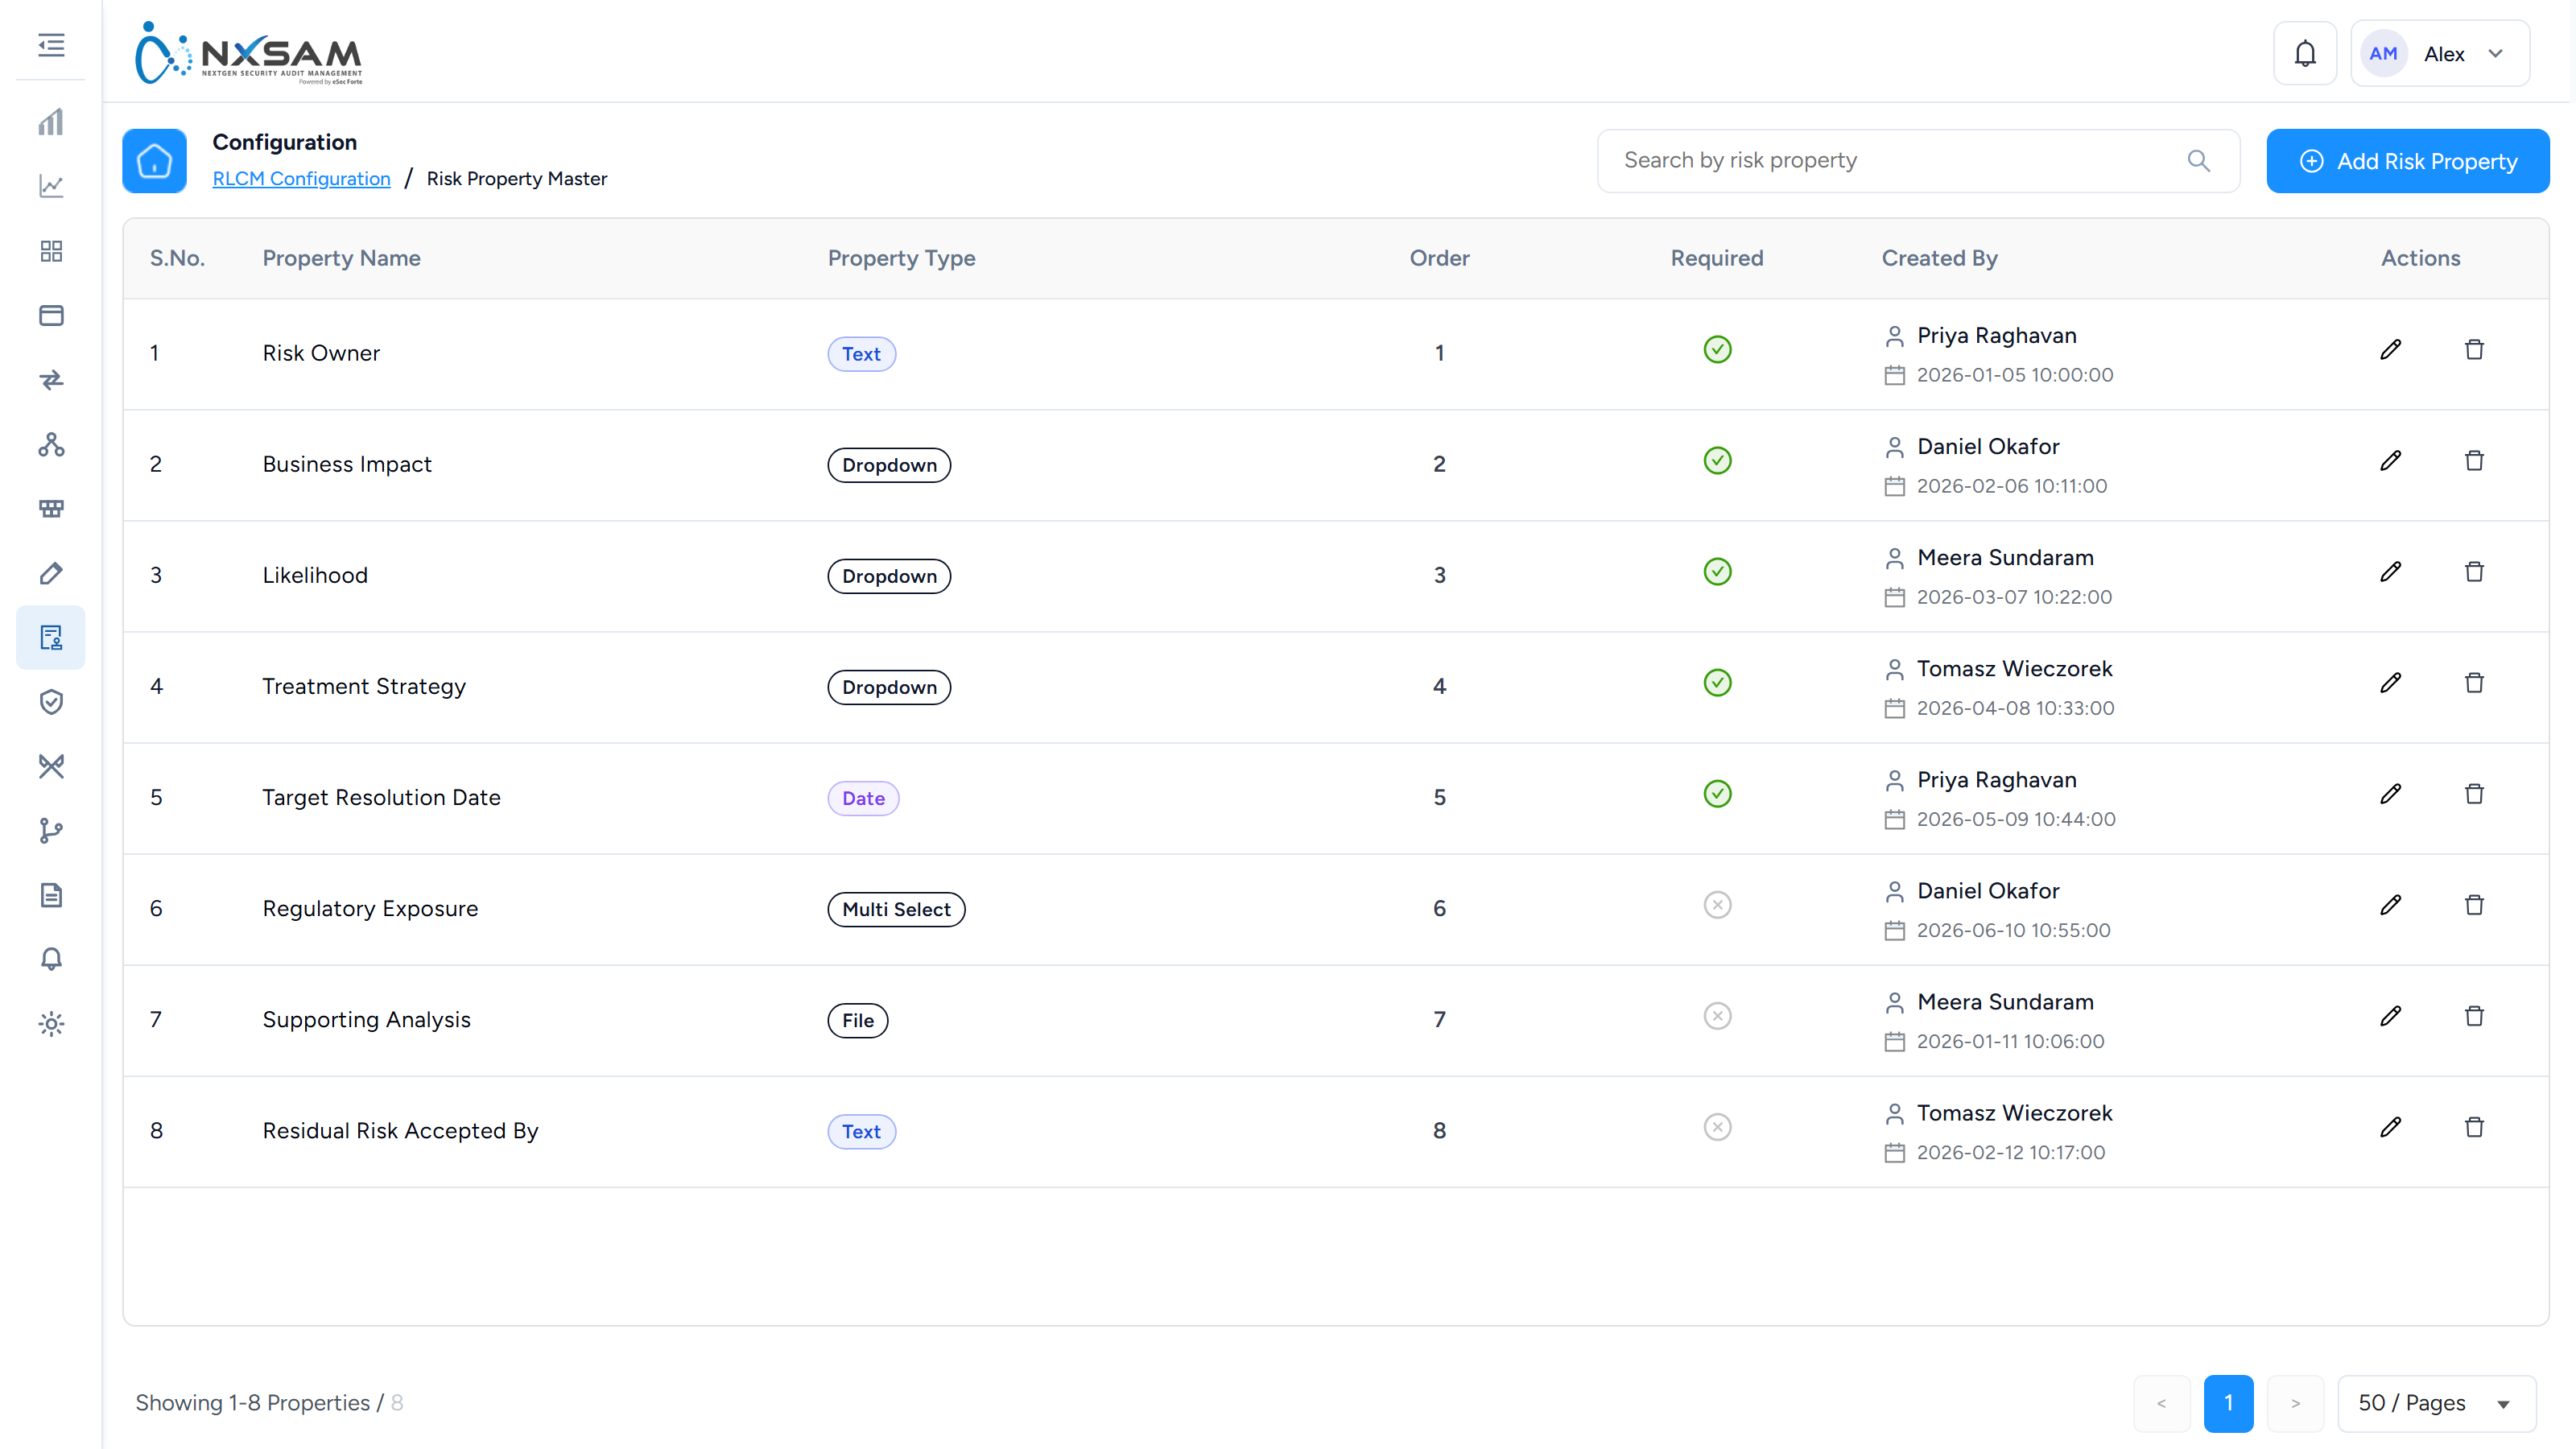
Risk Rating Rules
How a control failure is turned into a risk rating.
Risk Register
The consolidated register — every open compliance risk with its rating, owner and treatment.
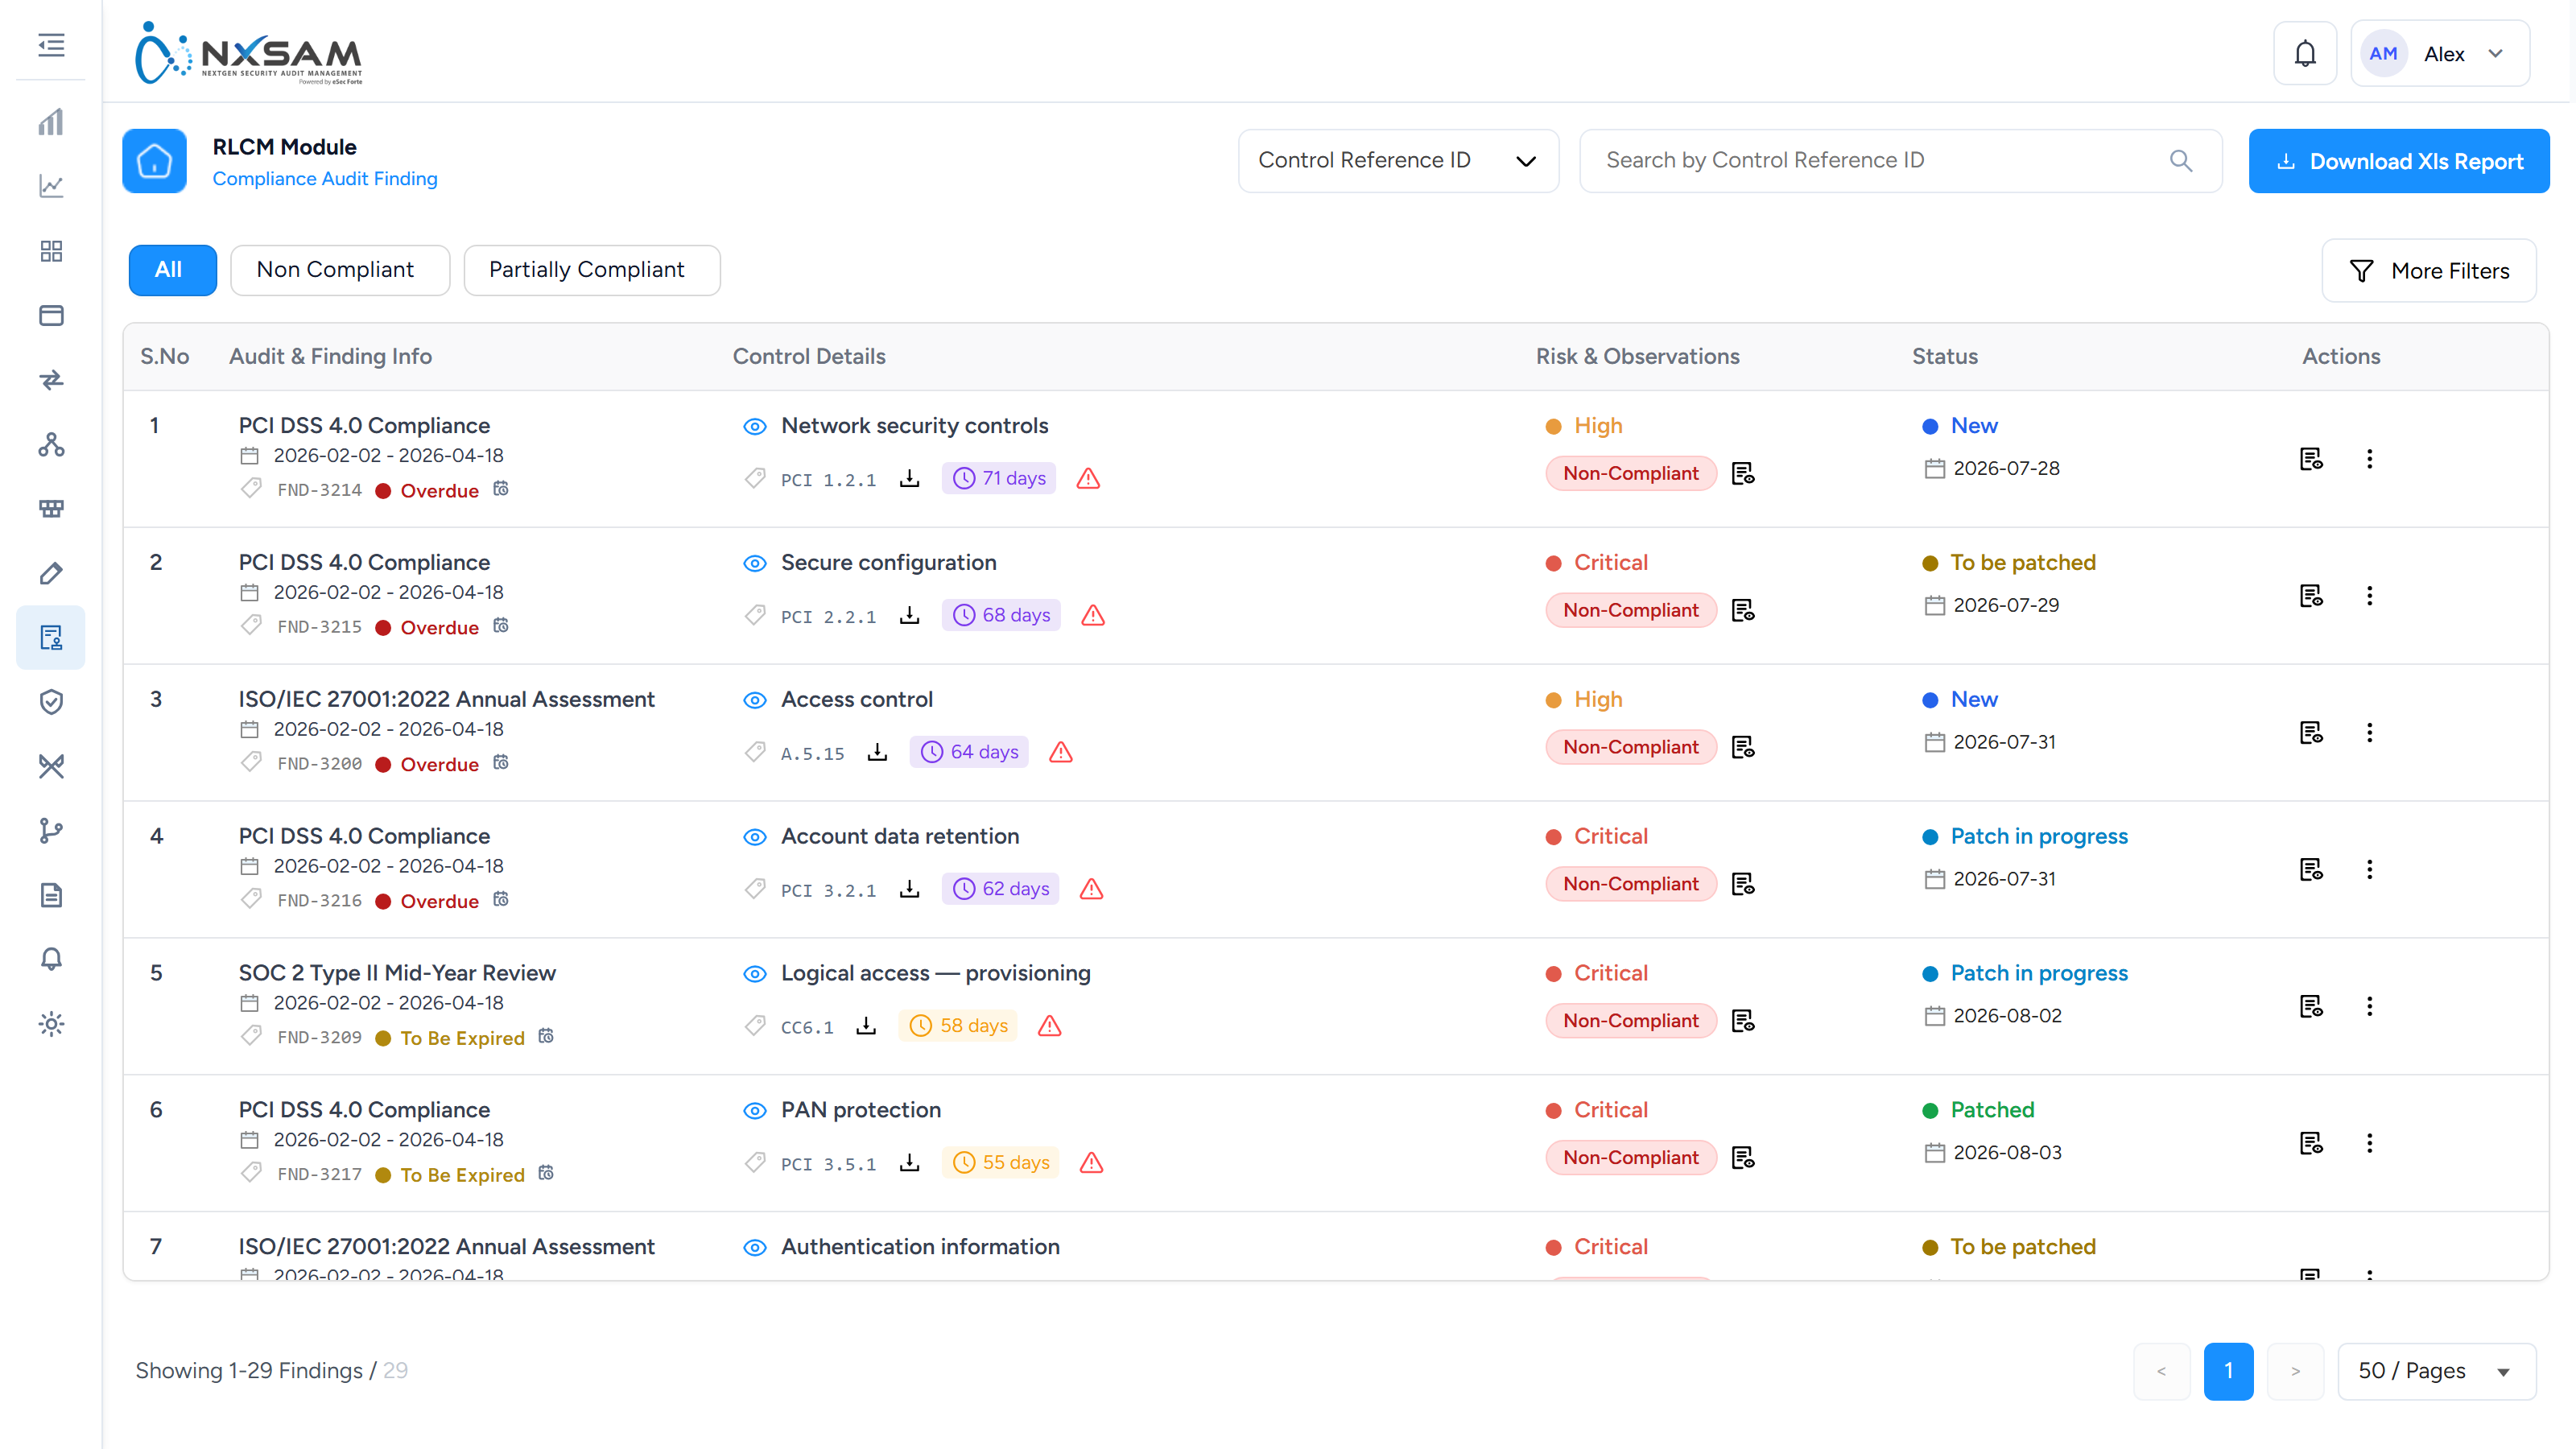
Section Controls
Which controls belong to which section of a standard.
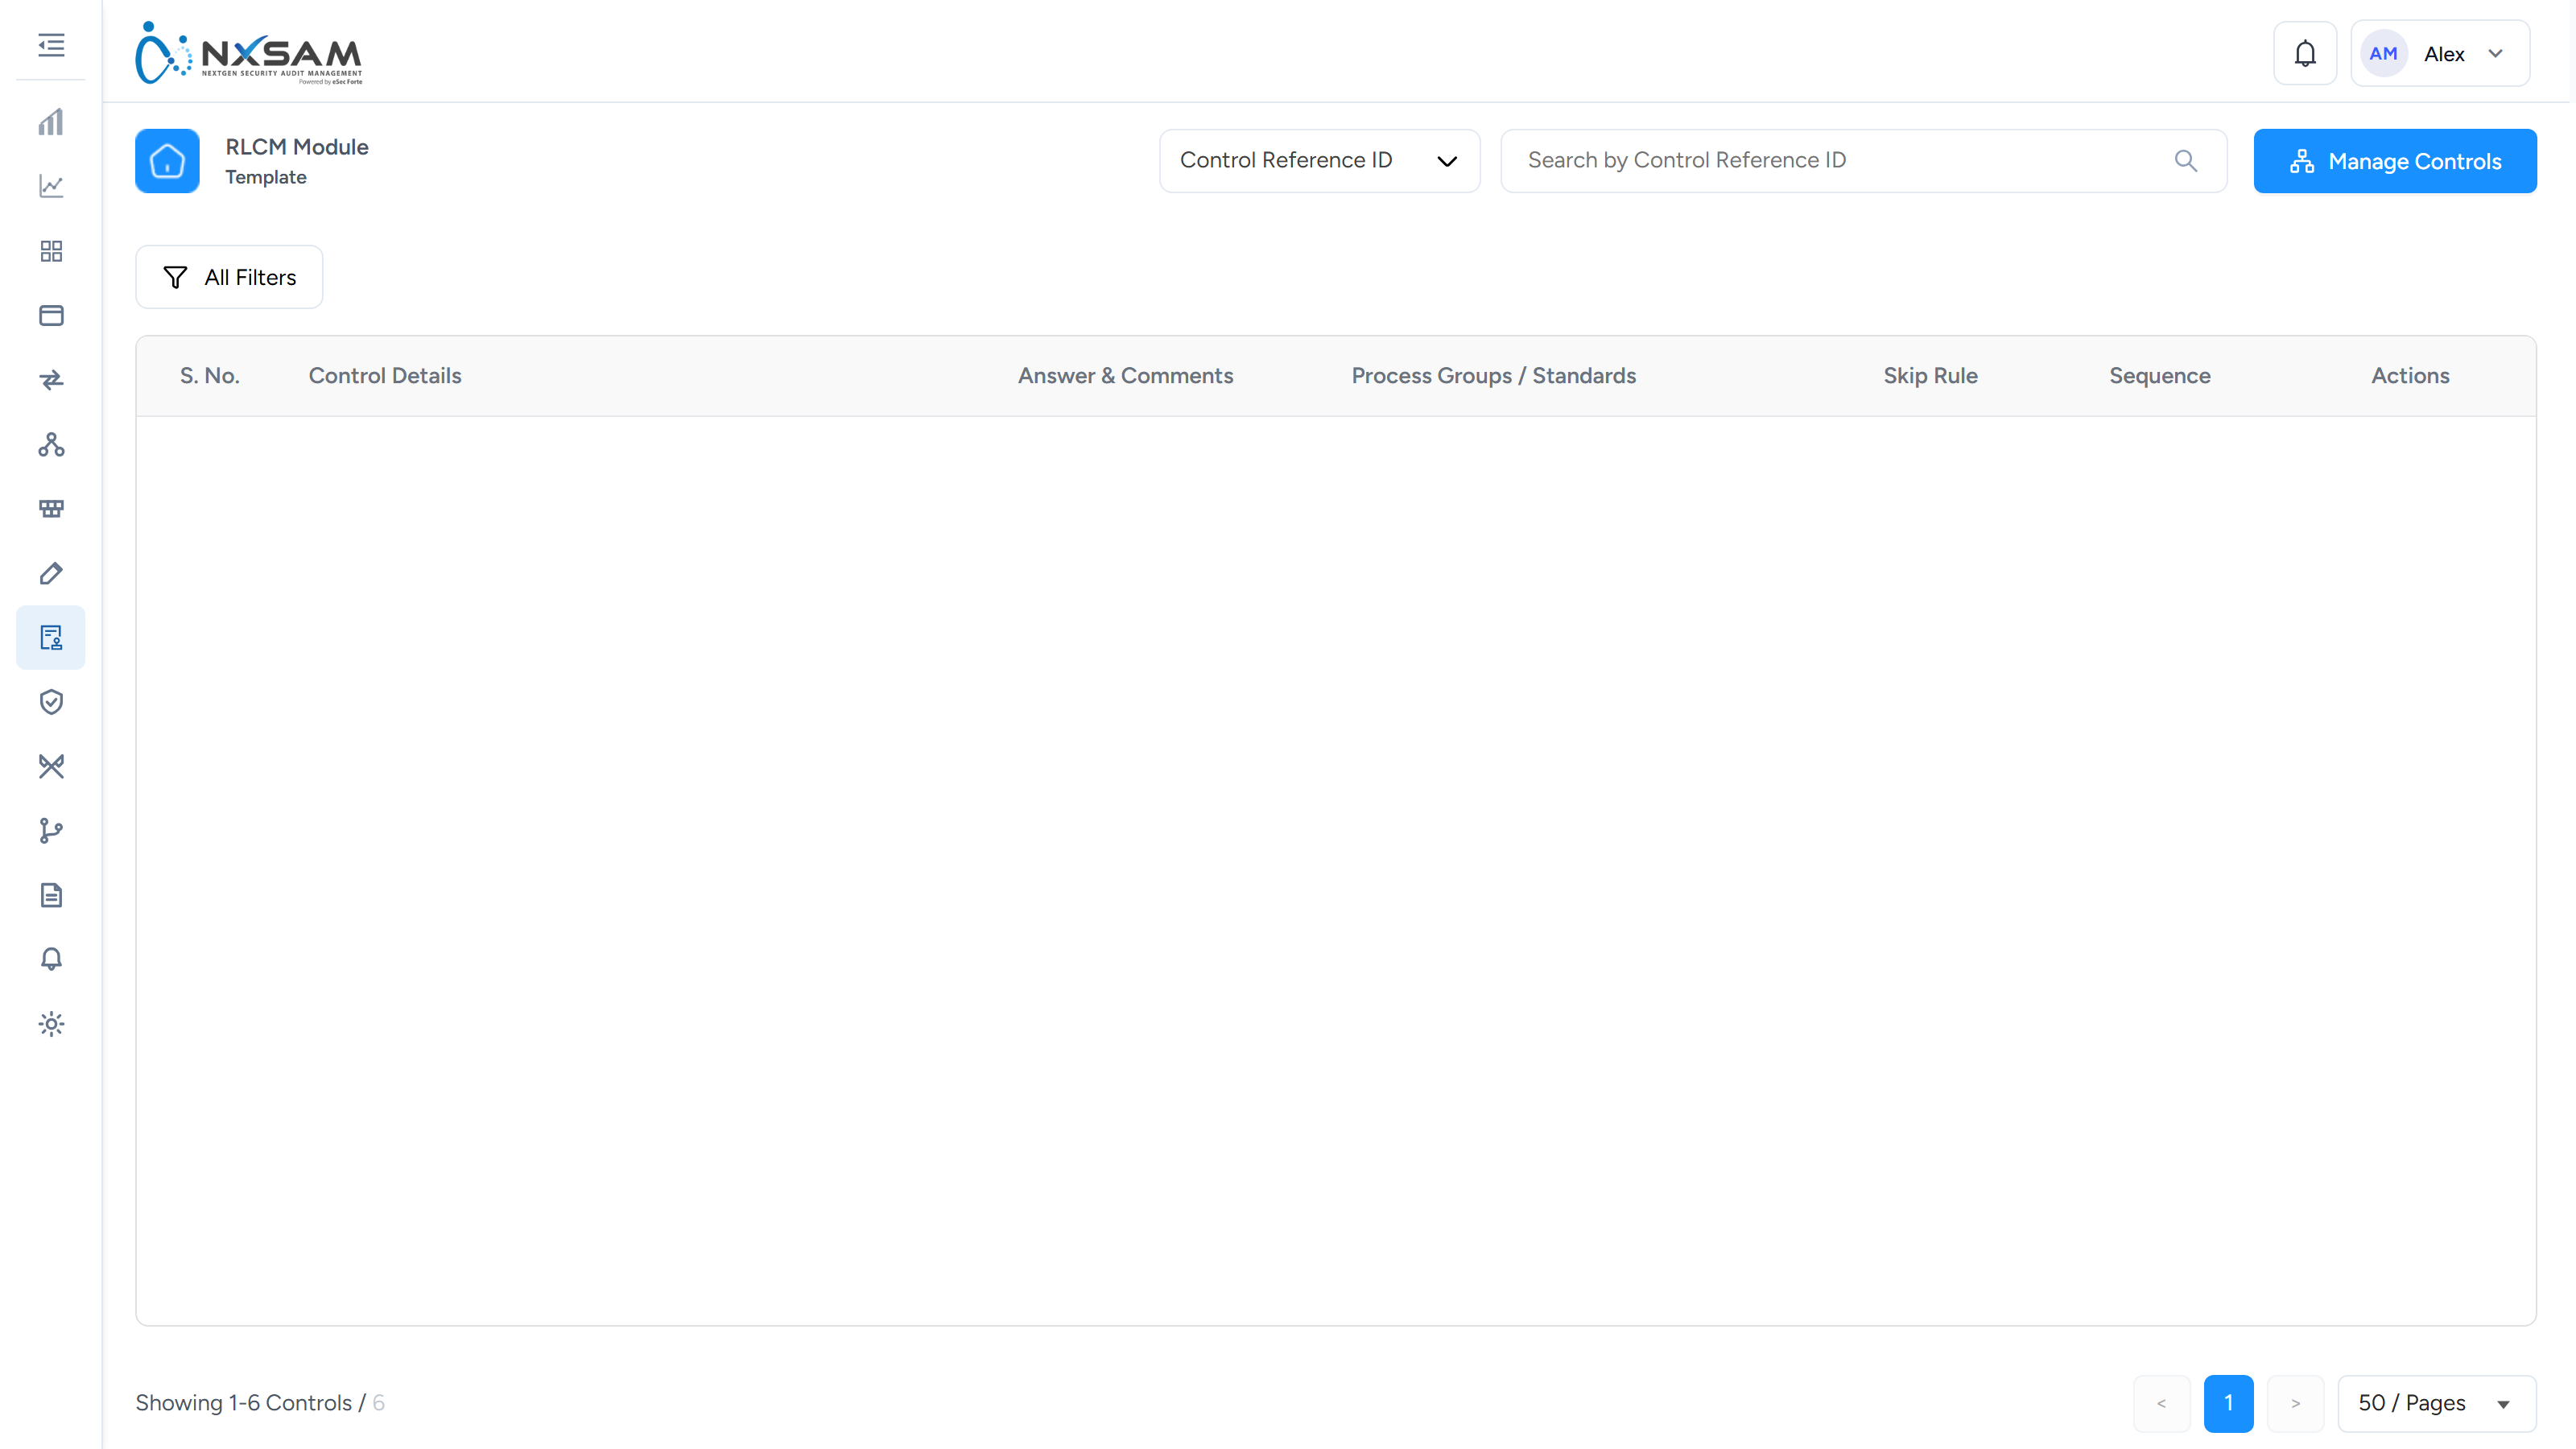
Standard Sections
How a standard divides into sections, used for scoring and reporting at section level.
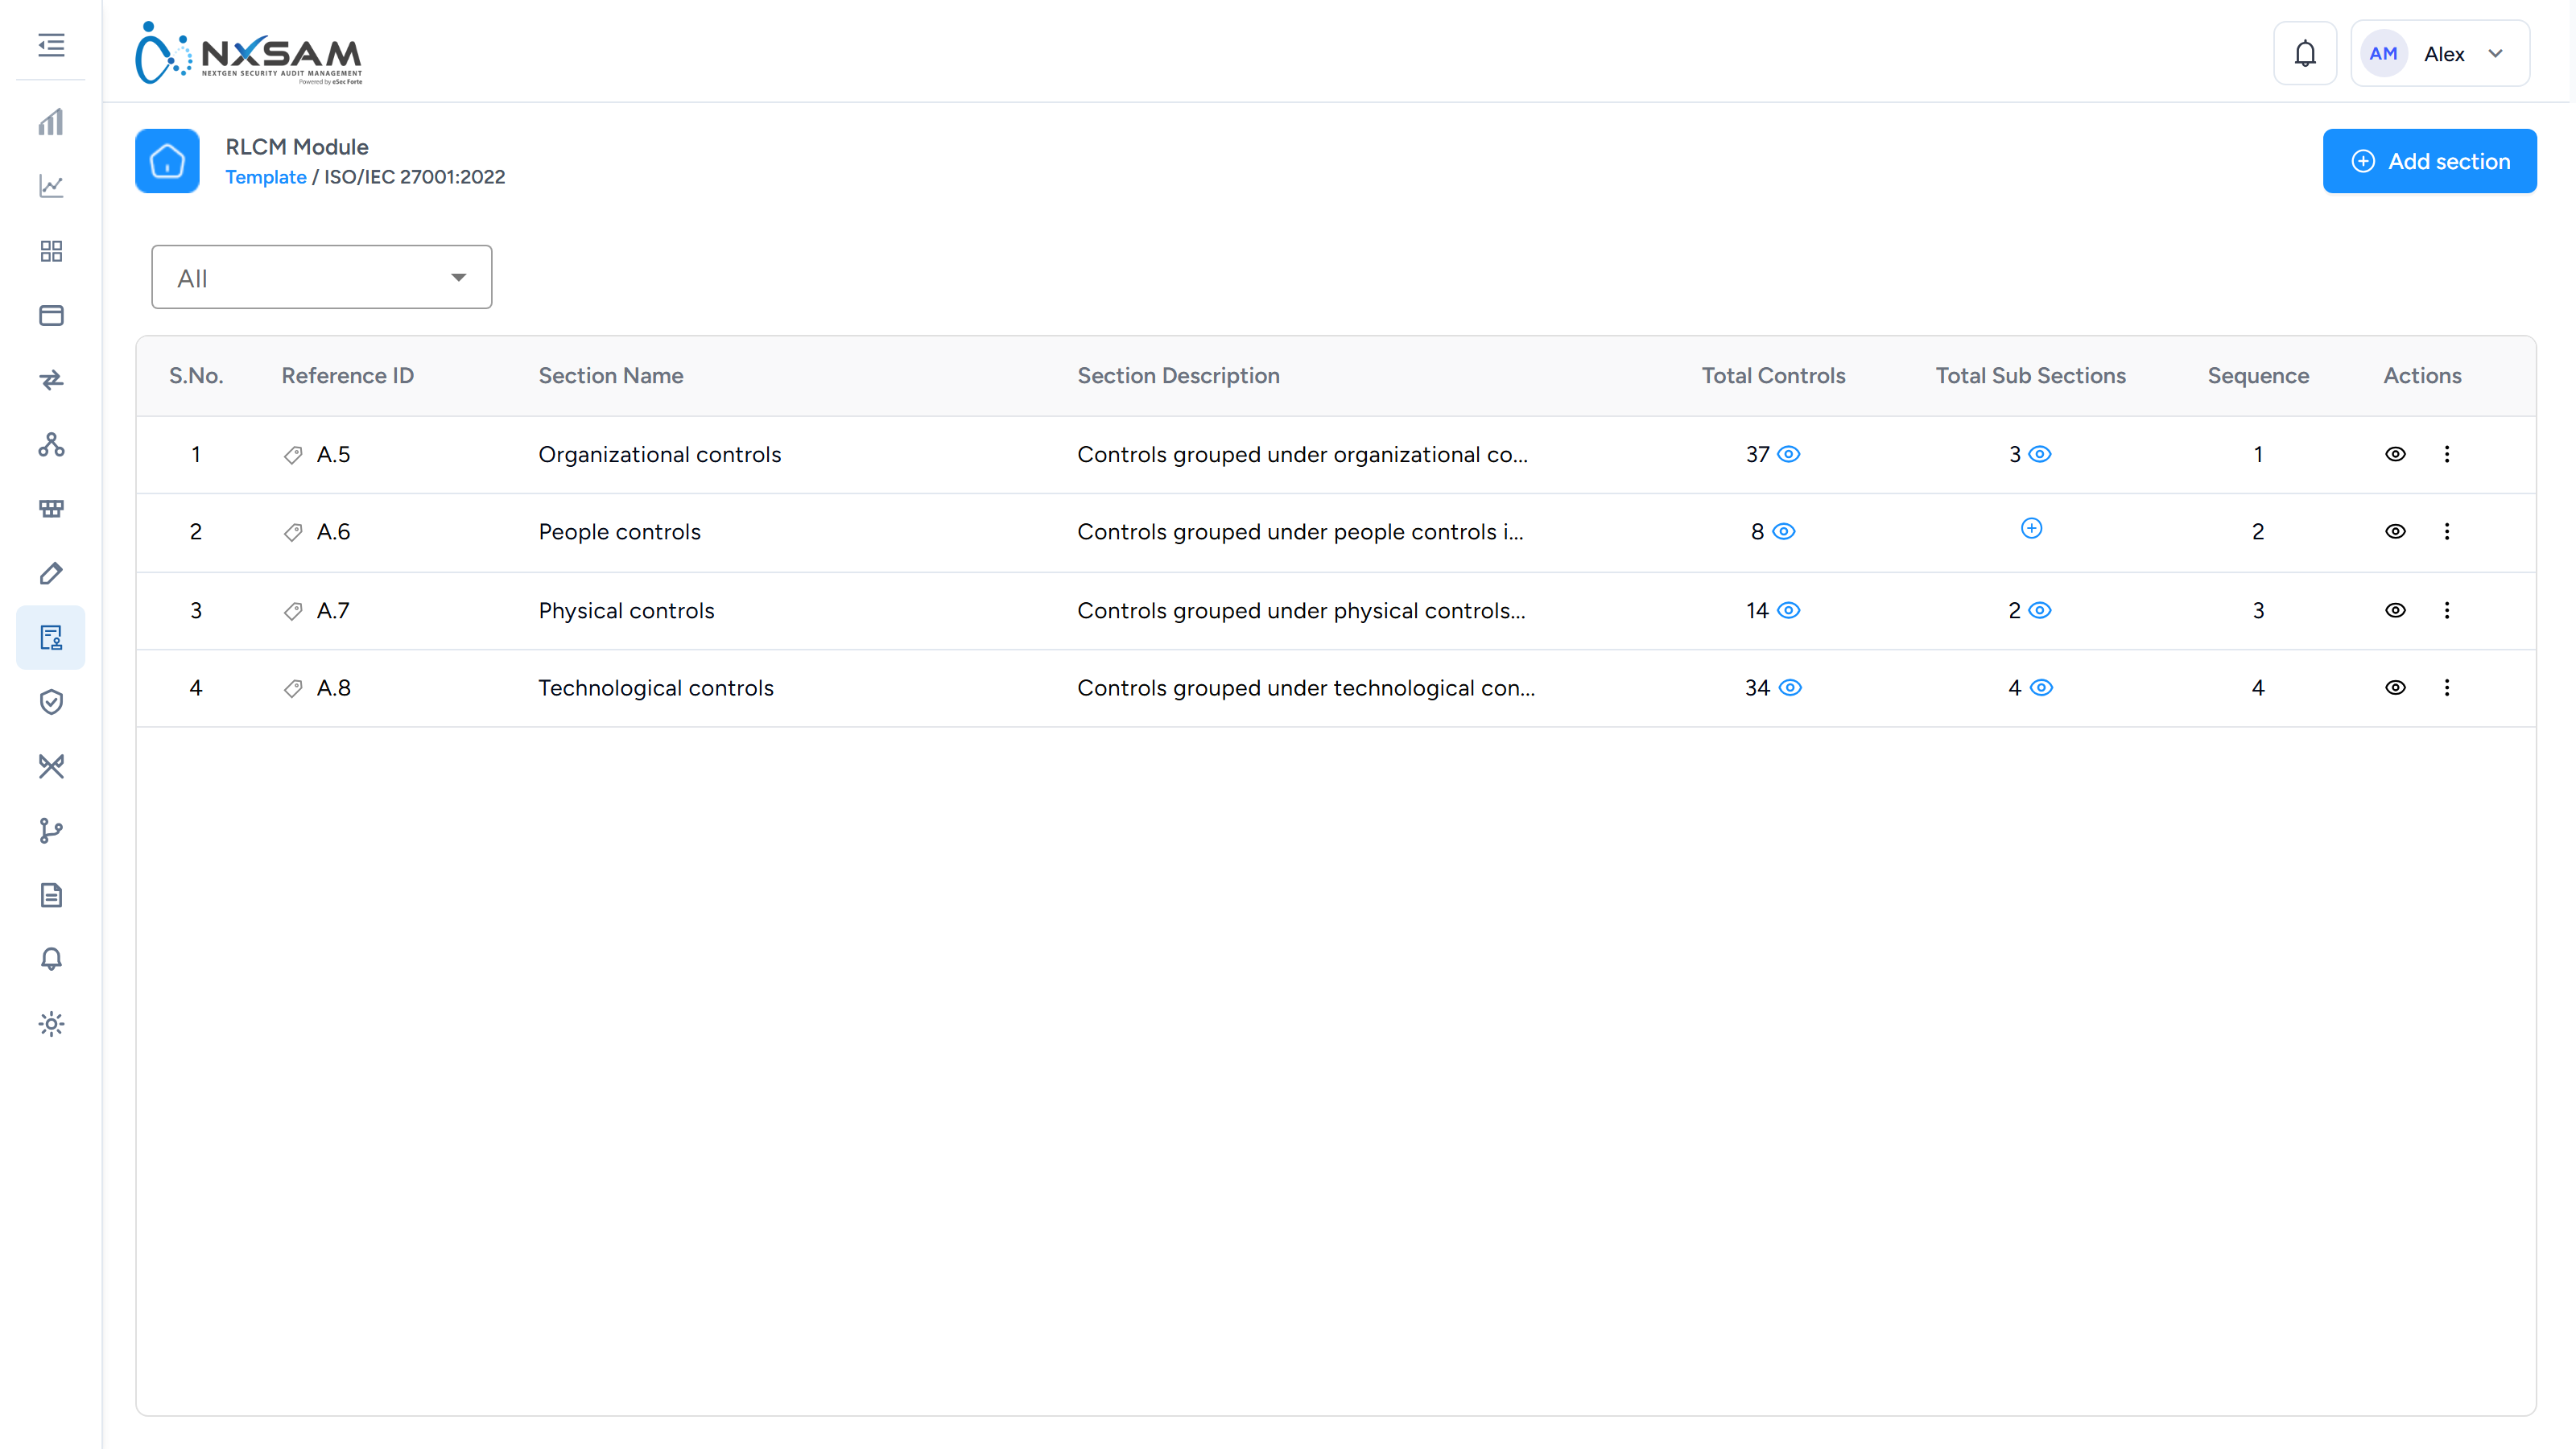
Standards
The frameworks in use — ISO 27001, PCI DSS, an internal baseline. Each carries its own controls.
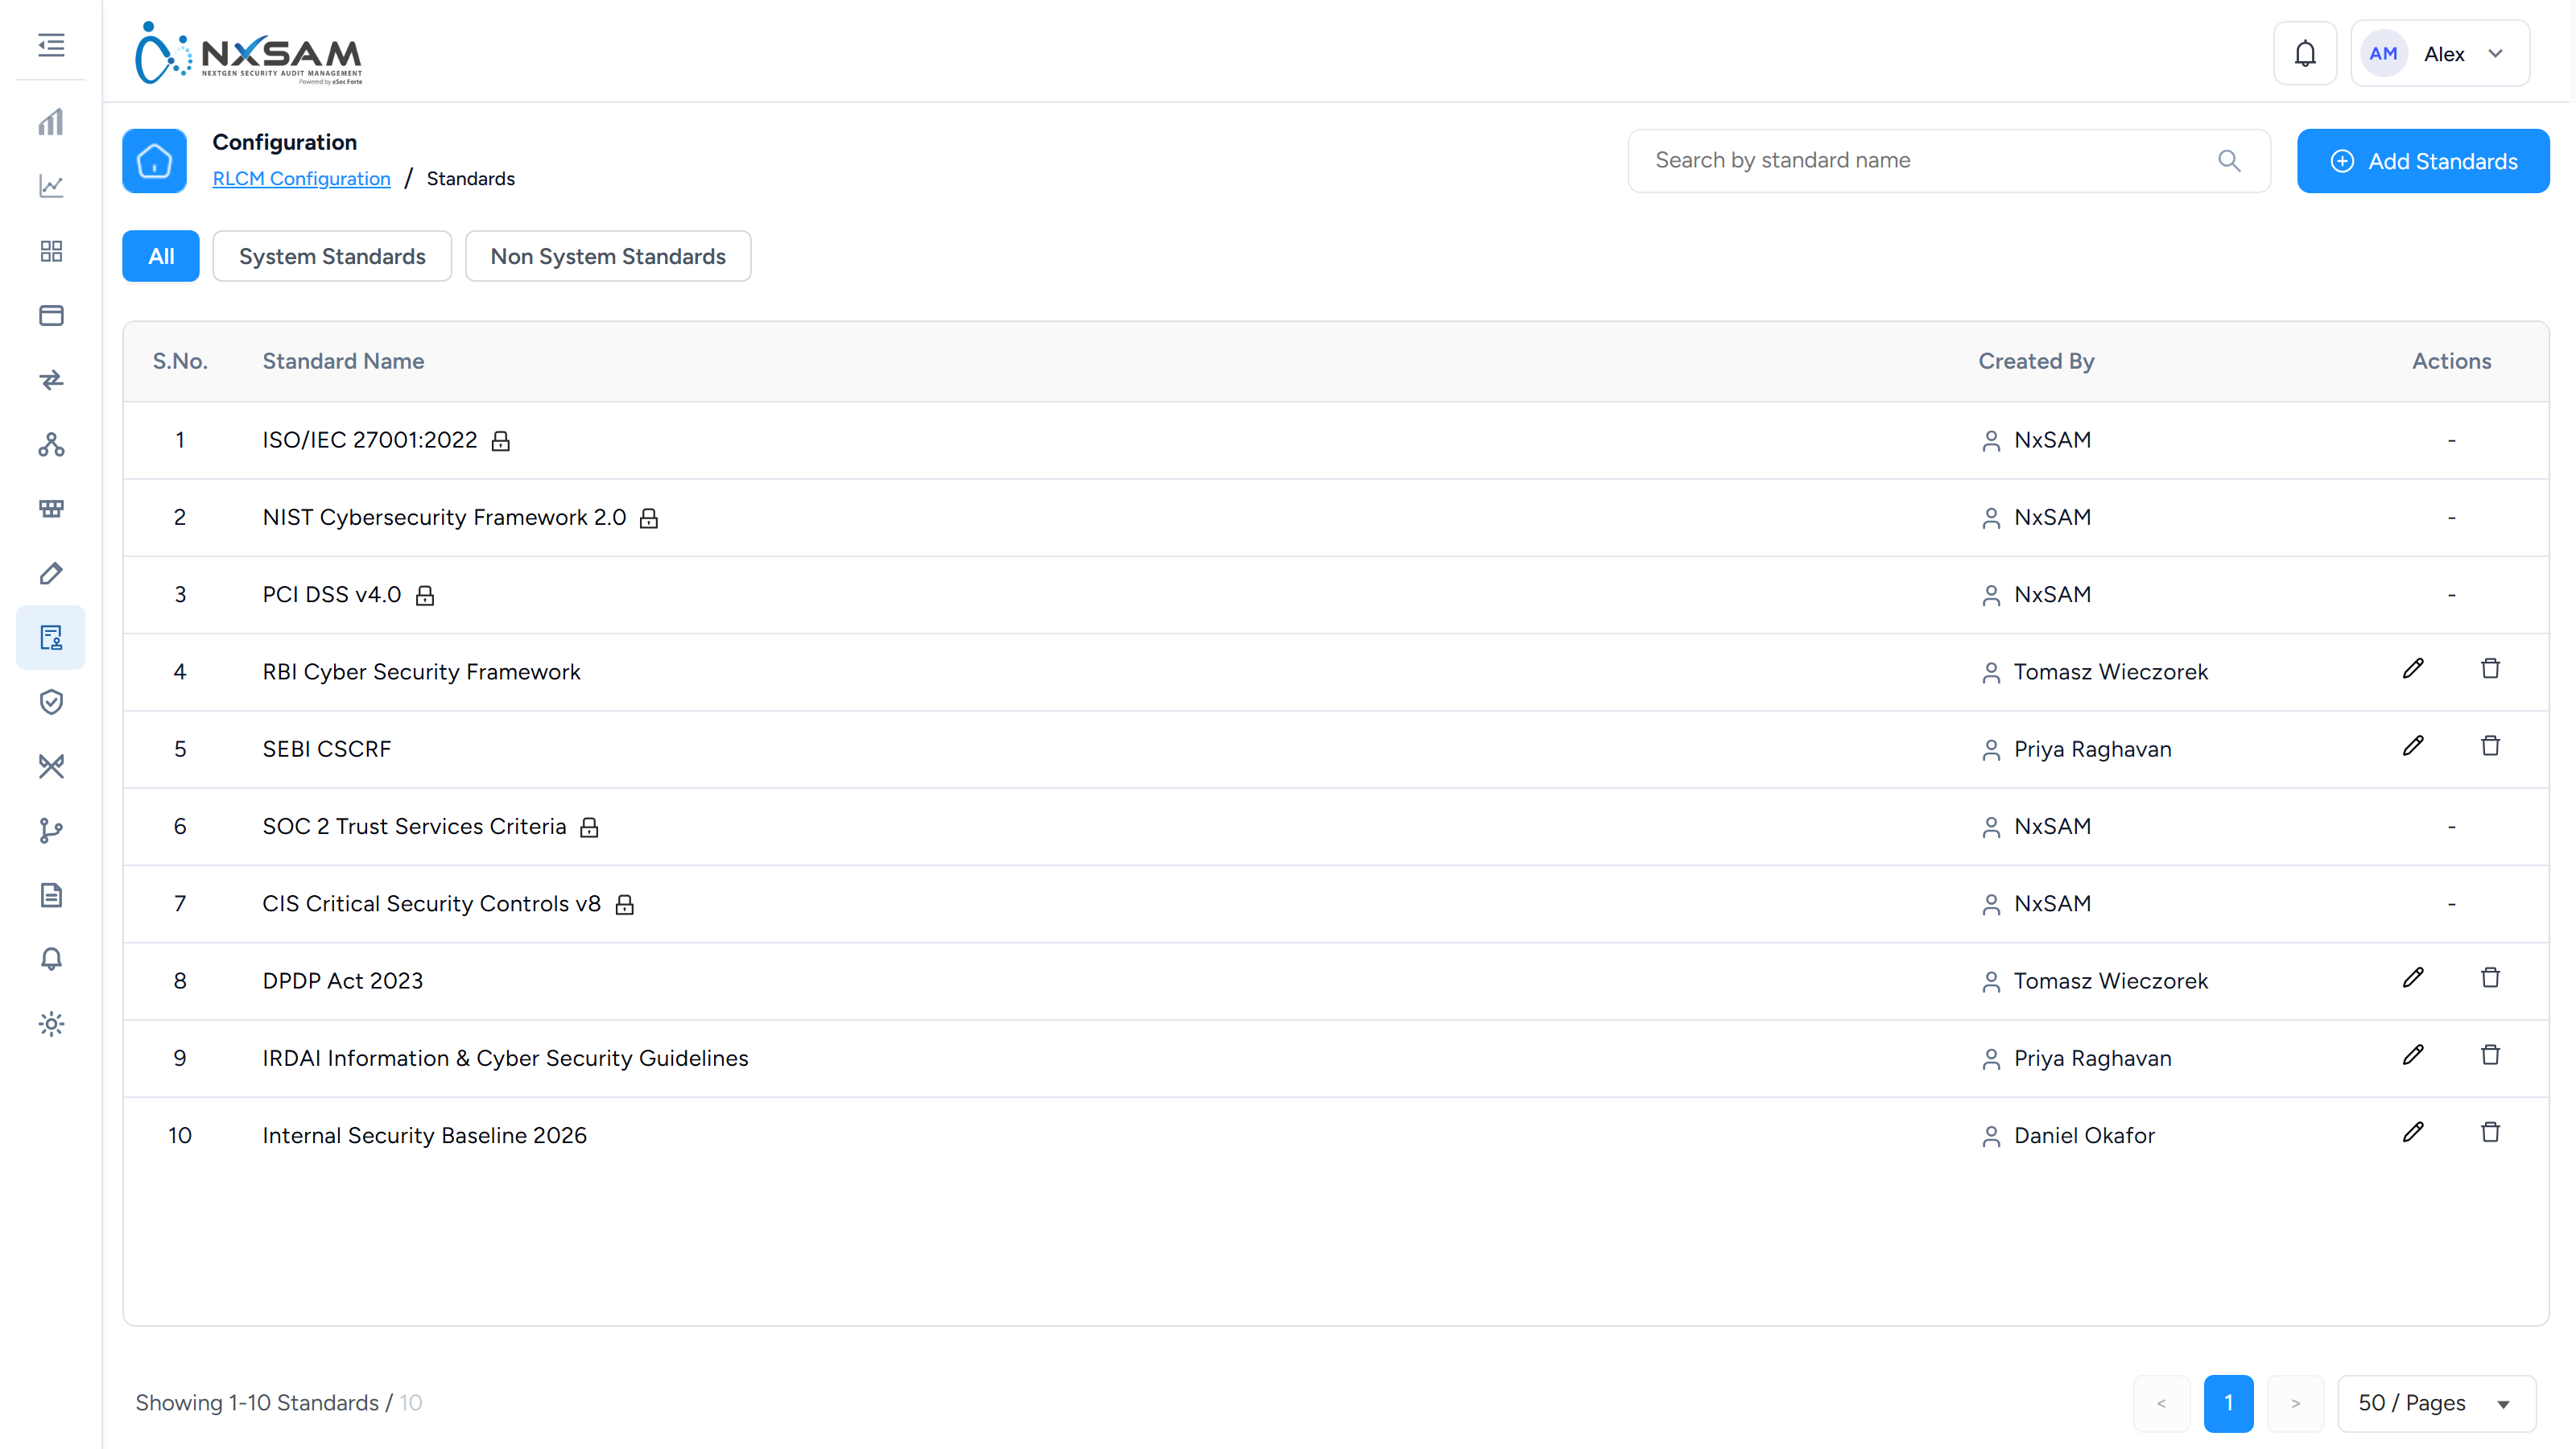
TPRM Assessments
Assessments issued to vendors, and how far each has progressed.
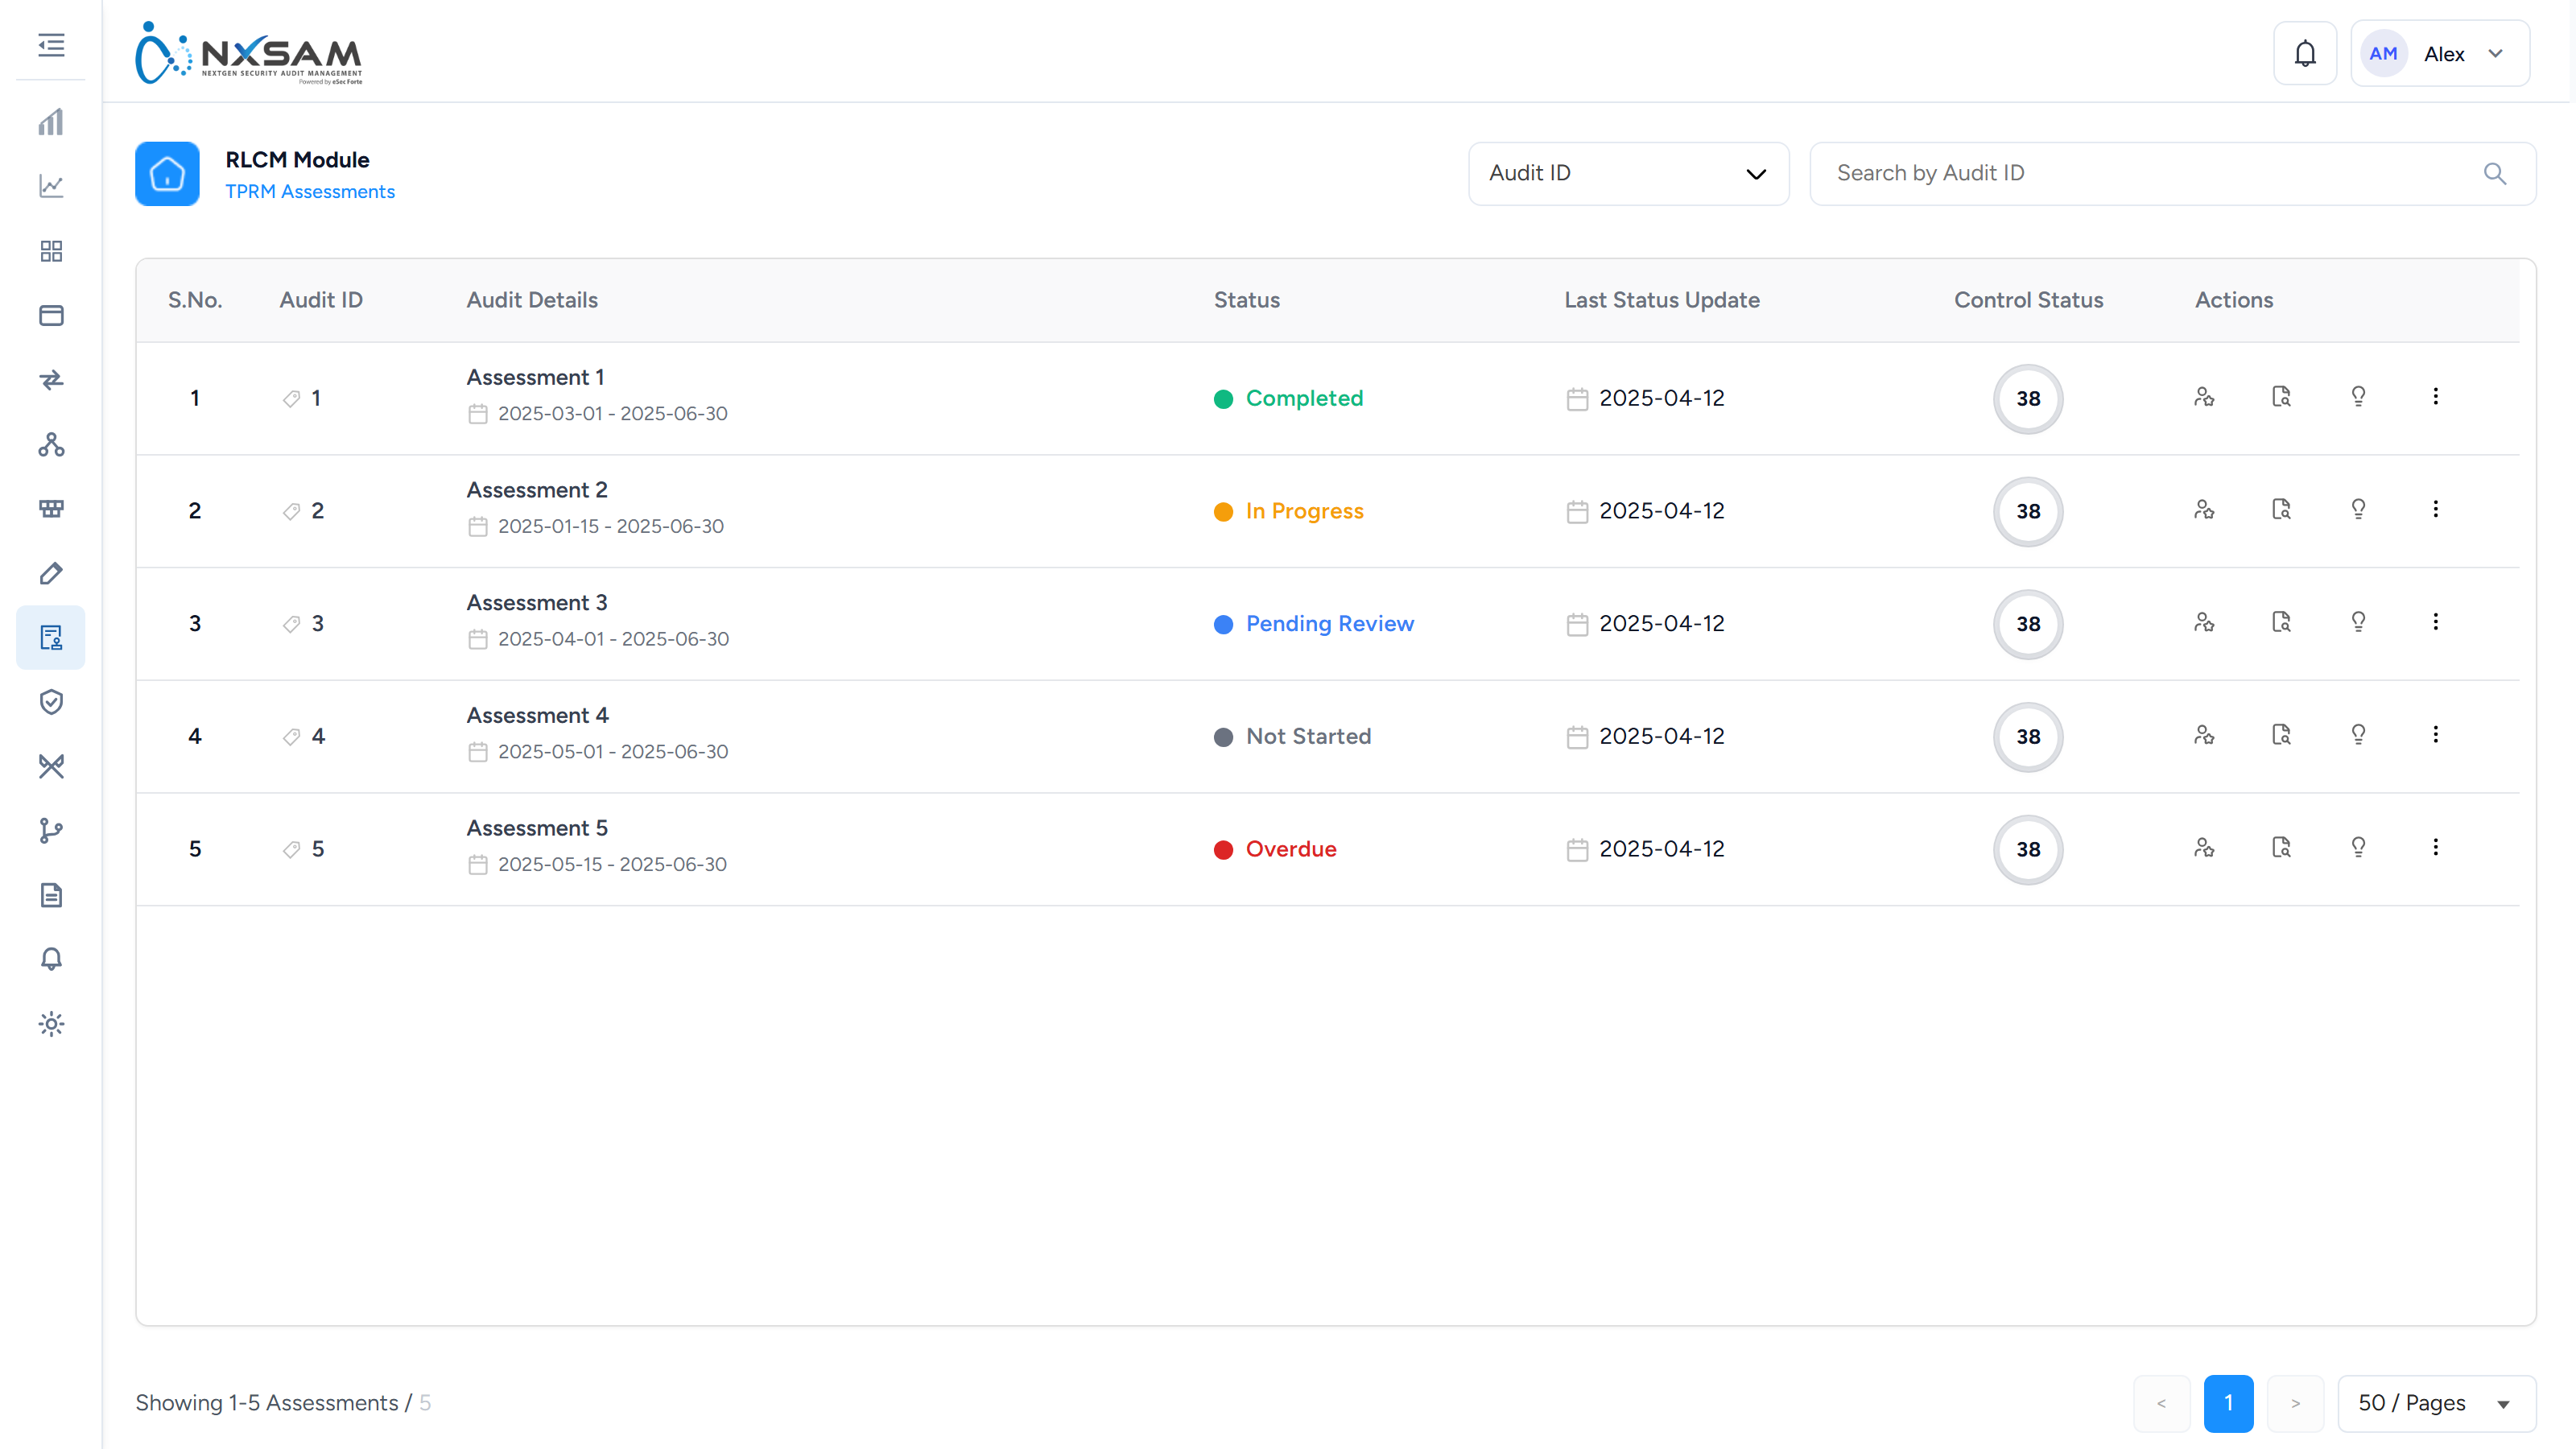
TPRM Audit Statuses
The states a vendor assessment moves through.
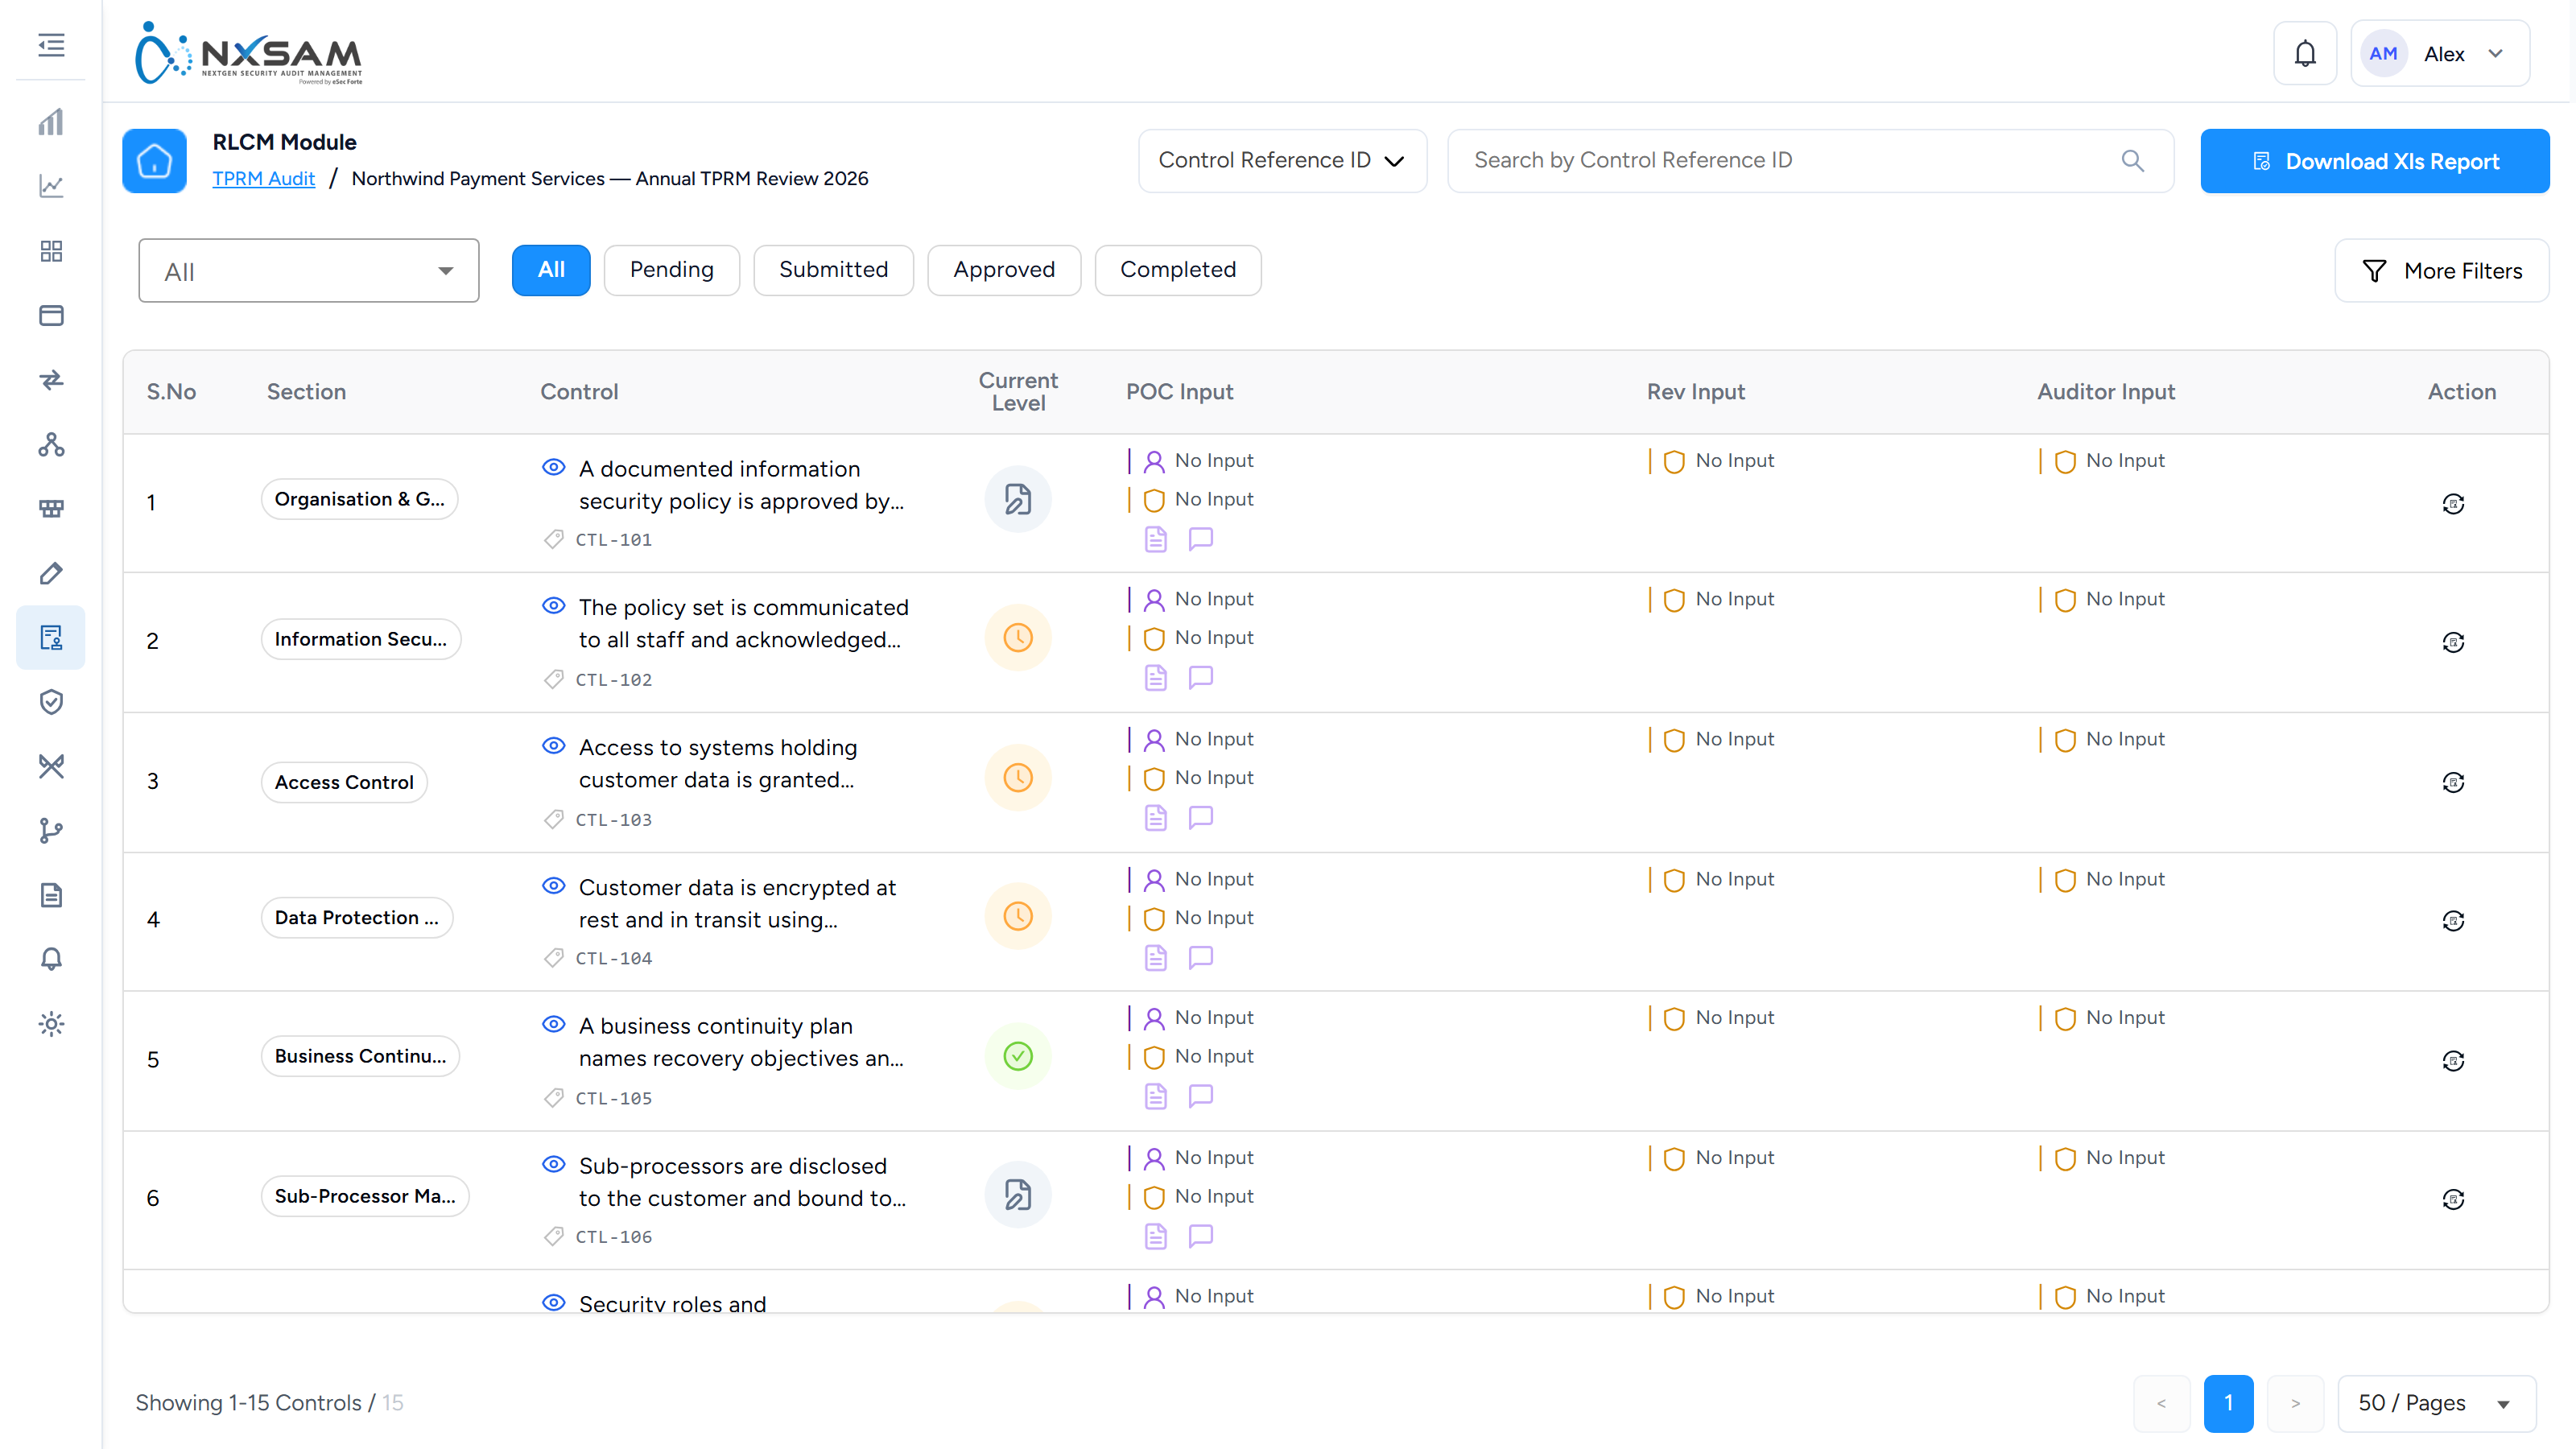
TPRM Control Management
A vendor assessment being worked: each control, who it is waiting on, and what they have done with it.
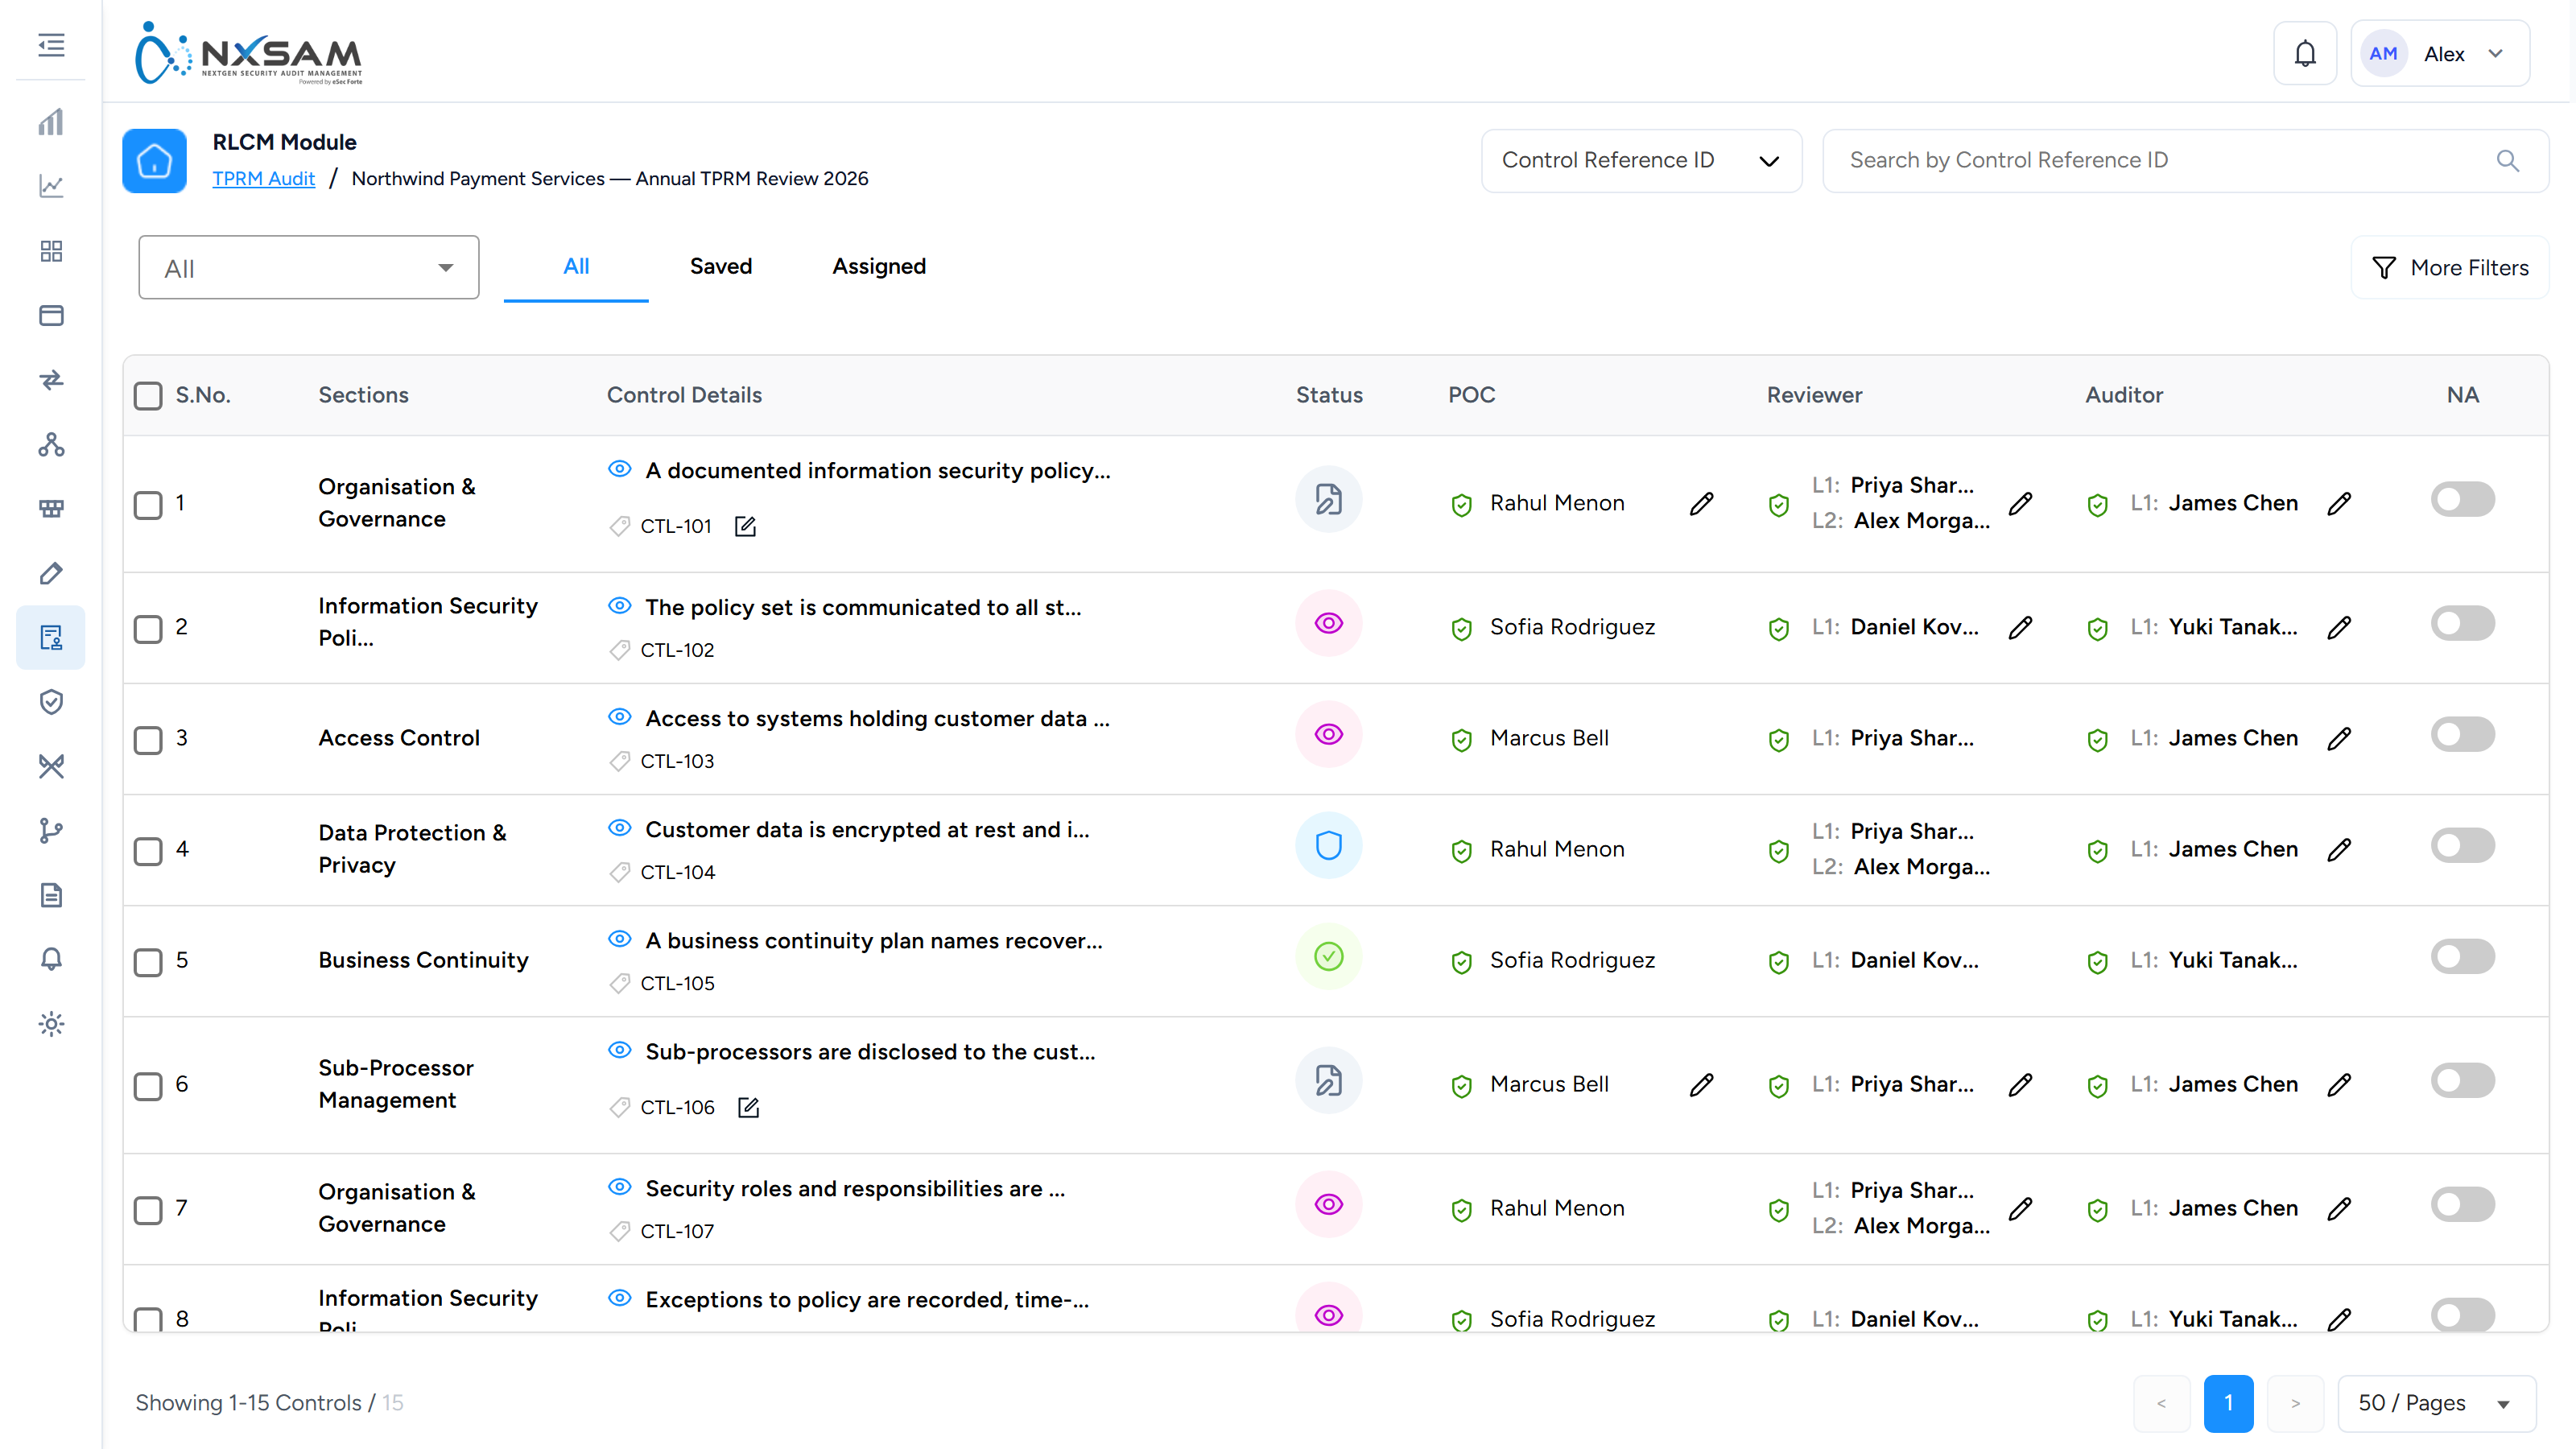
TPRM Dashboard
Third-party risk posture across the vendor portfolio.
TPRM Findings
What a vendor assessment found, and what was asked of the vendor.
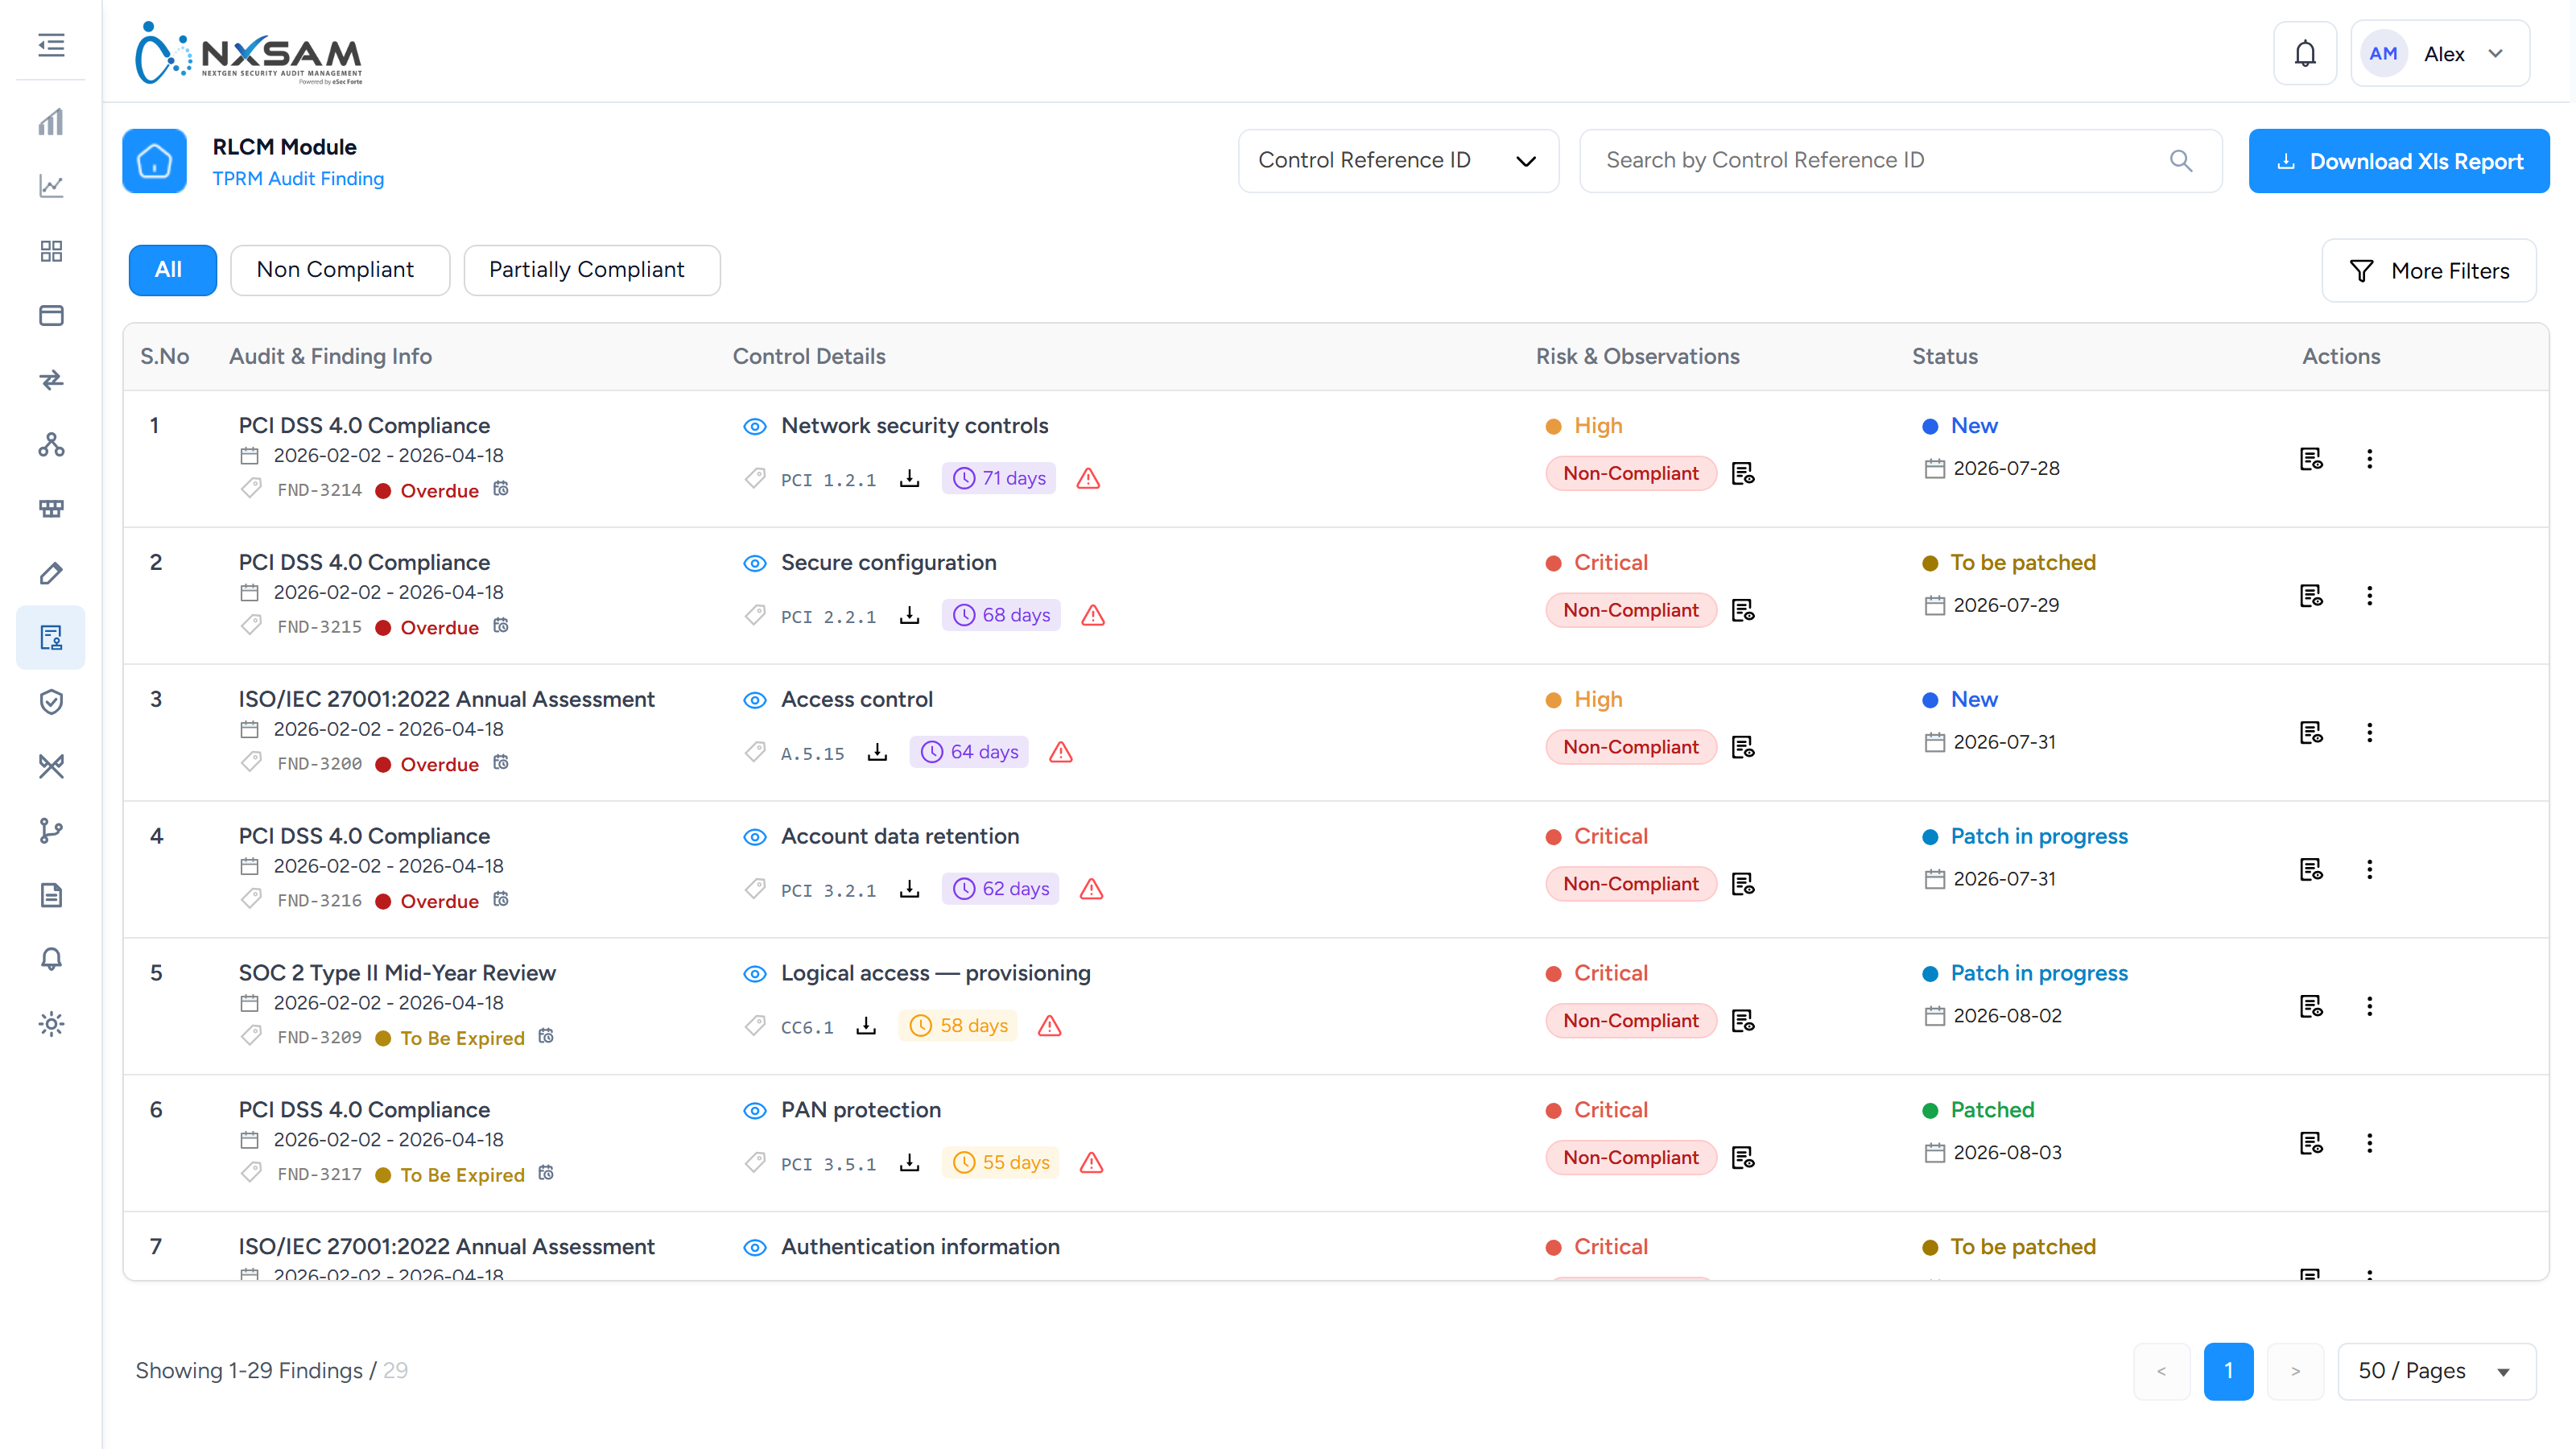
TPRM Question Library
Reusable questions for vendor assessments, so vendors are asked consistently.
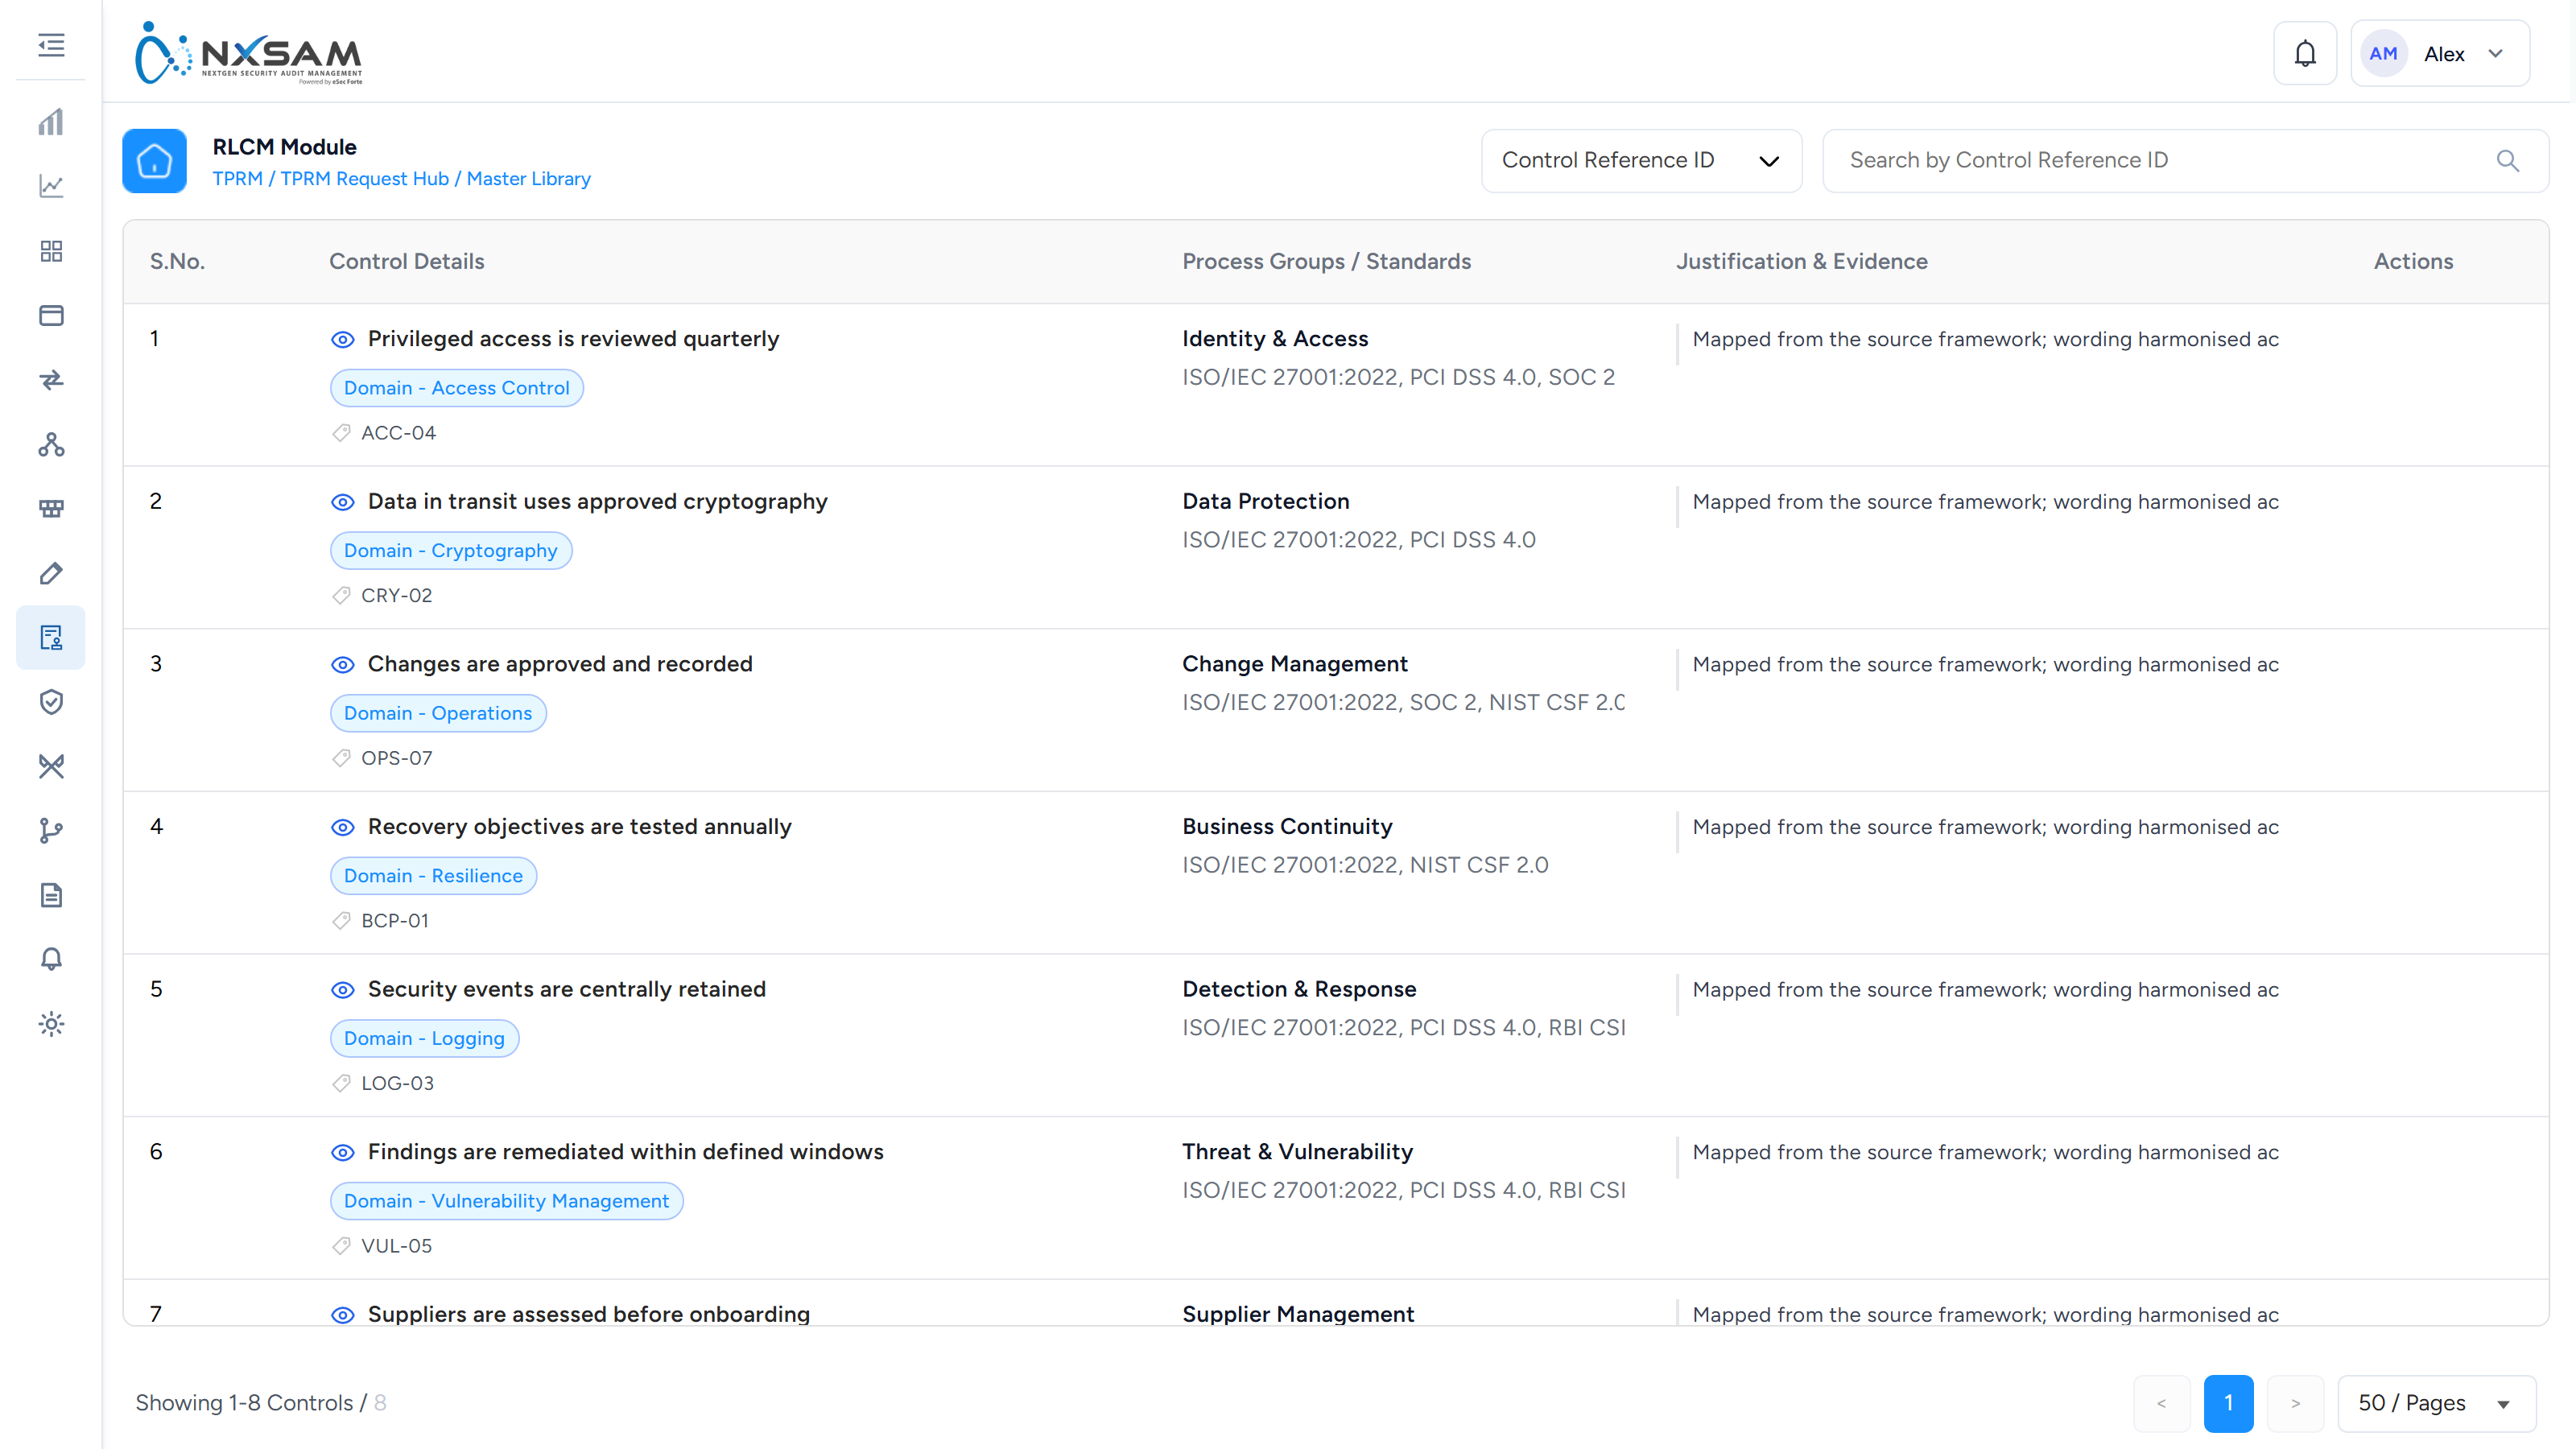
TPRM Risks
Risks arising from a vendor relationship rather than from your own estate.
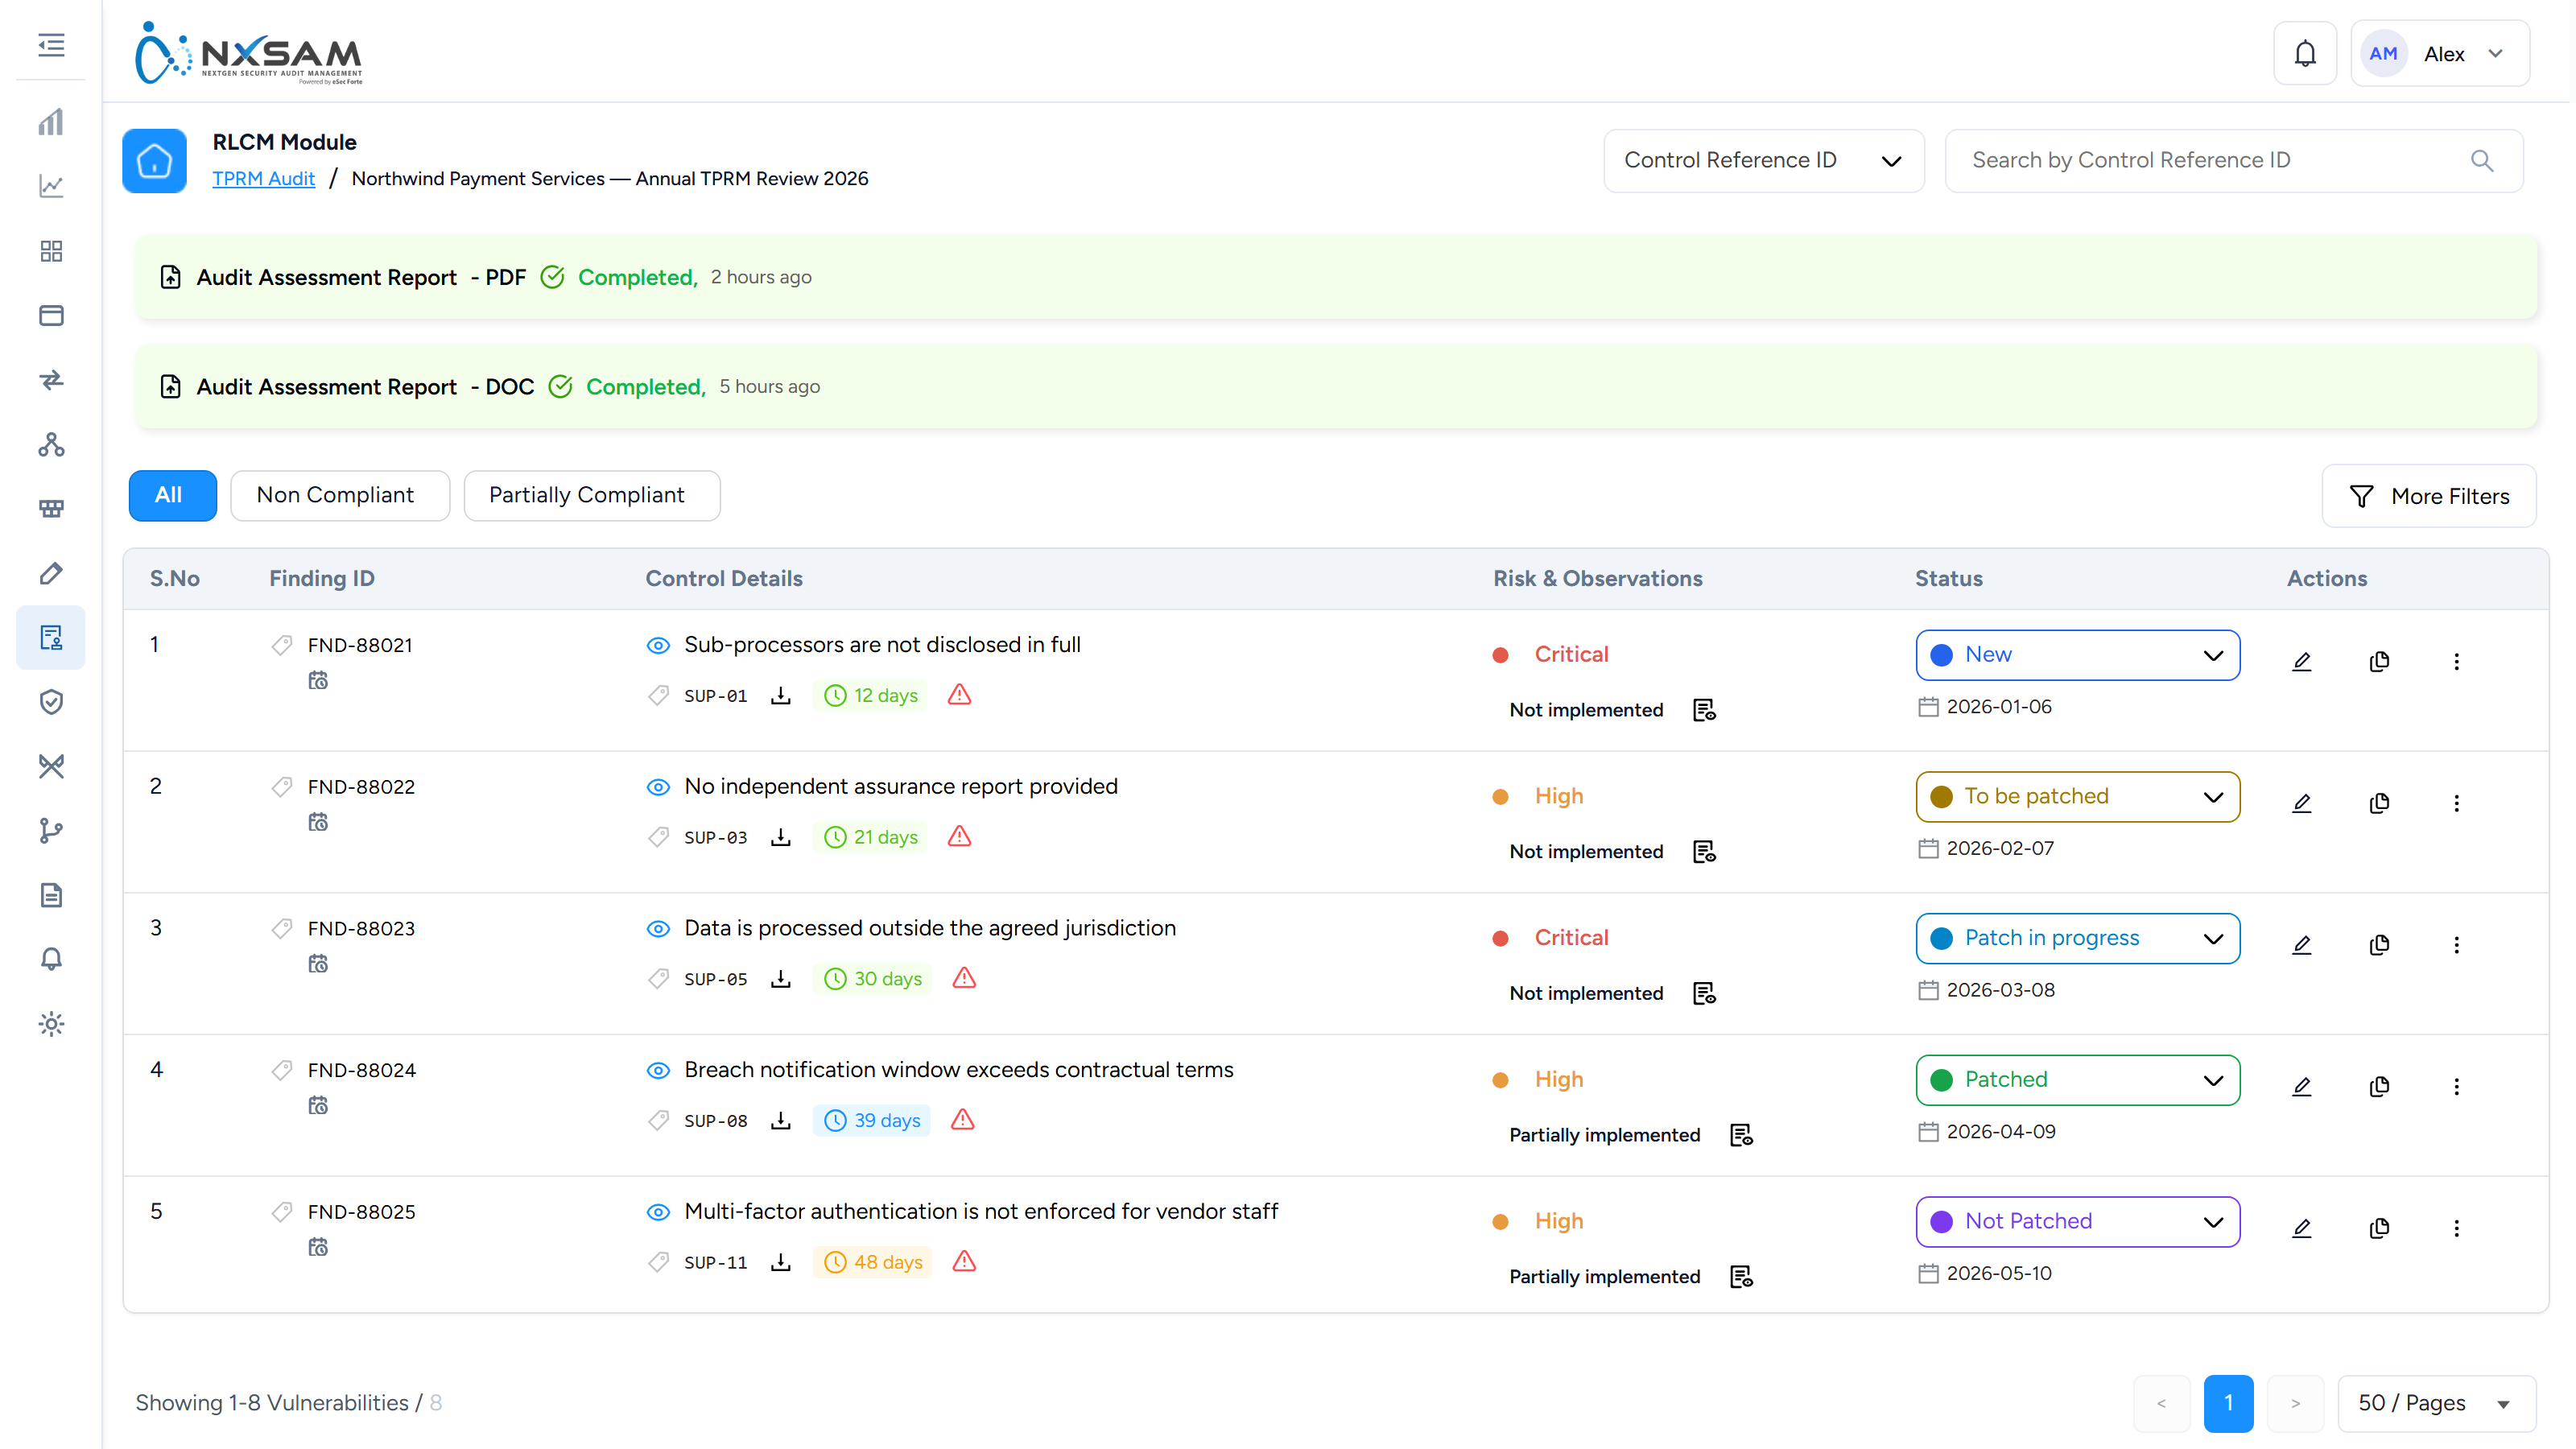
Unified Control Framework
One control mapped to the several frameworks that require it, so evidence is collected once and reused.
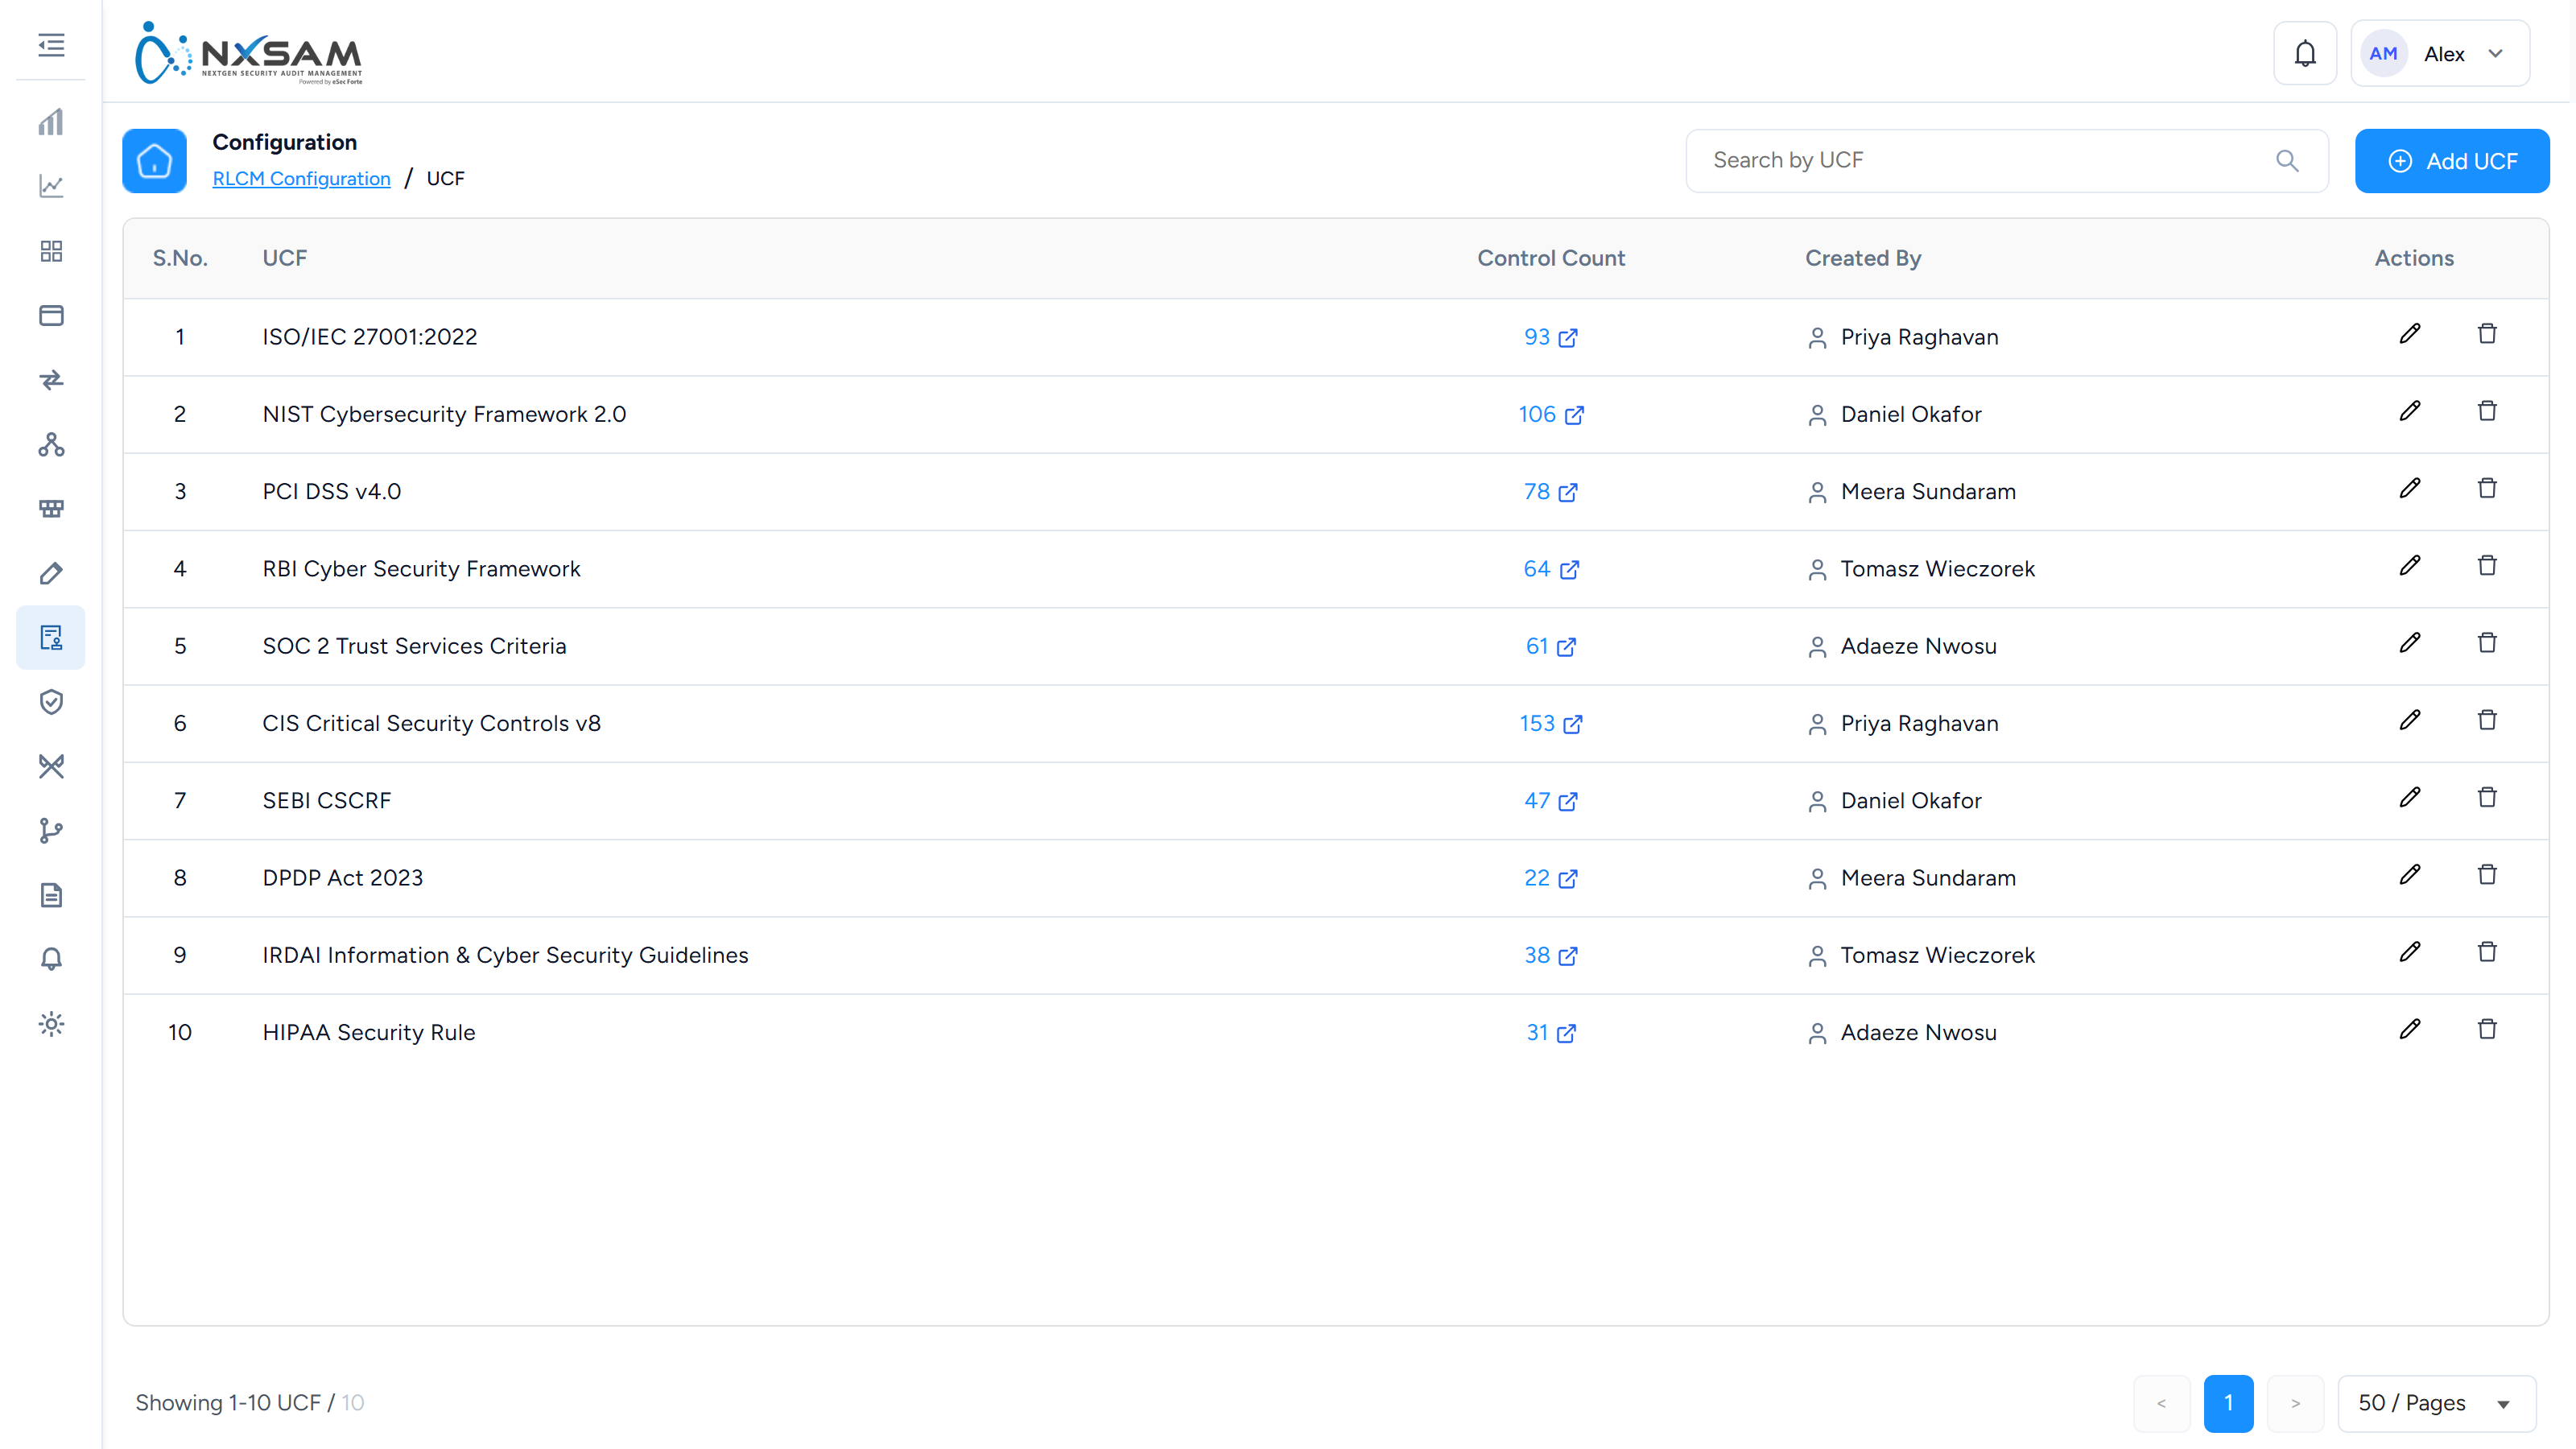
RLCM: support reference
Internal. The customer-facing explanation is in the screen reference and Configuring risk.
RLCM is a control-assessment module rather than a vulnerability module, and it has a three-role review model nothing else in the product uses. Almost every ticket is a question about whose turn it is.
Compliance and TPRM are the same screens
Internal compliance audits and third-party (TPRM) audits share their control-status and risk screens. The audit's type decides which set of controls is loaded and which breadcrumb appears.
Two practical consequences:
- A caller describing "the audit status screen" may be on either. Establish the audit first.
- A screenshot or a link taken from one looks identical to the other. Compare the audit name, not the screen.
The three roles
A control passes through a POC who answers it, a reviewer who accepts or returns it, and an approver. Pending On names whose turn it is, and it is the answer to most "nothing is happening" tickets.
An audit can be configured with the reviewer step disabled. Where it is, controls move straight from POC to final state, and a customer expecting a review stage that never appears has that configuration rather than a defect.
Mandatory answer, comment and evidence
Each control can independently require an answer, a comment and evidence. These are enforced at save time rather than announced beforehand, so the usual report is "it will not let me submit" with no visible reason.
Check the control's own requirements before treating it as a bug. The same audit can have controls with different requirements.
Status flags decide behaviour
Statuses are configured per deployment, and four flags on each decide what it does:
| Flag | Effect |
|---|---|
| Comment Required | Will not save without one |
| Auditor Required | Needs an auditor assigned before the status can be set |
| Evidence Required | Needs an attachment |
| Closed Type | Whether it stops the item counting as open |
| Is Exception | Marks an agreed exception rather than a resolution |
Is Exception is the one that matters for reporting: it separates "we fixed it" from "we agreed not to". A customer whose compliance percentage looks too good may be counting exceptions as closures.
If a customer's counts behave unlike this documentation, their configured statuses are the first thing to read — the flags are data, not fixed behaviour.
CCF frameworks: what cannot be changed, and what the percentage means
- System Framework and System Requirement rows are shipped with the product. Edit and Delete are absent on them by design; a caller asking to correct one should be told to add their own framework alongside rather than raise a defect.
- Compliance % on the framework list is mapping coverage — requirements with at least one mapped control, over all requirements. It is not an assessment result and does not move when controls are answered. A customer reading it as "we are 80 % compliant with ISO 27001" needs the distinction made before it reaches an auditor.
- A CSV upload that "did nothing" almost always failed row validation. Requirement
Upload Logs on the requirements screen records each run with what was rejected and
why; read that before re-uploading. The reference ID has the same character rule as the
framework's: letters, numbers and
. _ -. - The Validity period and Warning period on a framework drive expiry warnings on the framework, not on its assessments. A framework showing as expiring is a framework due for a review of its own version, not a failing audit.
AI evidence analysis: three states, one configuration screen
The AI Evidence Analysis Status on an assessment is one of:
| Shown | Means |
|---|---|
| pending | Queued, or waiting for the next scheduled run, or held back by the per-audit cost cap |
| a score out of 100 | Analysed; the score is the platform's confidence in the finding it suggests |
| failed | The evidence could not be read; the reason is on hover |
Everything that decides whether it runs at all is on System → AI Configuration: the provider and credential, the model, the schedule interval, the Per-Audit Cost Cap, and whether analysis is switched on for Compliance and TPRM. If that screen shows AI service not configured, nothing will ever leave pending, and the fix is the administrator's, not the auditor's.
AI Queue Details on the same screen lists every analysis queue with its status and a Re-analyse this queue action. A stuck pending that survives the next scheduled run is worth re-analysing once before escalating; a failed that repeats on the same evidence is usually the evidence — an image with no readable text, or a file the extractor cannot open.
The evaluation is advisory. It writes no answer, changes no status and is not counted in any report; the auditor's input remains the only input. A customer who wants the score to be the answer is asking for something the product deliberately does not do.
UCF mapping
Controls map to framework entries through the Unified Control Framework. One control can belong to several frameworks, which is the point: answering it once satisfies each of them.
A control appearing in several framework reports is not duplicated data.
Evidence lives in two places
- On the control, as the answer's supporting attachment.
- On the status history, as the justification recorded when someone changed the state.
They serve different audiences — the first is what the assessor asked for, the second is what an auditor asks for later.
What to collect before escalating
- The audit name and type — compliance or TPRM.
- The control's reference and its Pending On value.
- Whether the audit requires a reviewer.
- For "cannot submit": which of answer, comment and evidence the control requires.
- For counting disputes: which statuses the deployment marks as closed type, and which as exceptions.
Third-Party Risk (TPRM)
Third-Party Risk (TPRM)
TPRM assesses the security of organisations you depend on — suppliers, partners, service providers. The questions are the same as for your own systems, but you cannot scan a third party's infrastructure, so the evidence comes from them.
What makes it different
Three things shape how TPRM works:
- The vendor supplies the answers. You send a questionnaire; they respond with evidence. You are assessing their claims, not observing their systems.
- Vendors log in themselves. Vendor users get restricted access — they see only their own assessments and nothing else in your NxSAM.
- Effort should match exposure. A supplier handling customer data warrants far more scrutiny than one supplying stationery.
Pre-assessment: deciding how much scrutiny
Rather than sending every vendor the same long questionnaire, a short pre-assessment establishes what the relationship actually involves — what data they touch, what access they have, how critical they are.
That produces a tier, and the tier determines the depth of the full assessment. It keeps effort proportionate on both sides, and means a low-risk supplier is not asked to complete a two-hundred-question review.
The full assessment
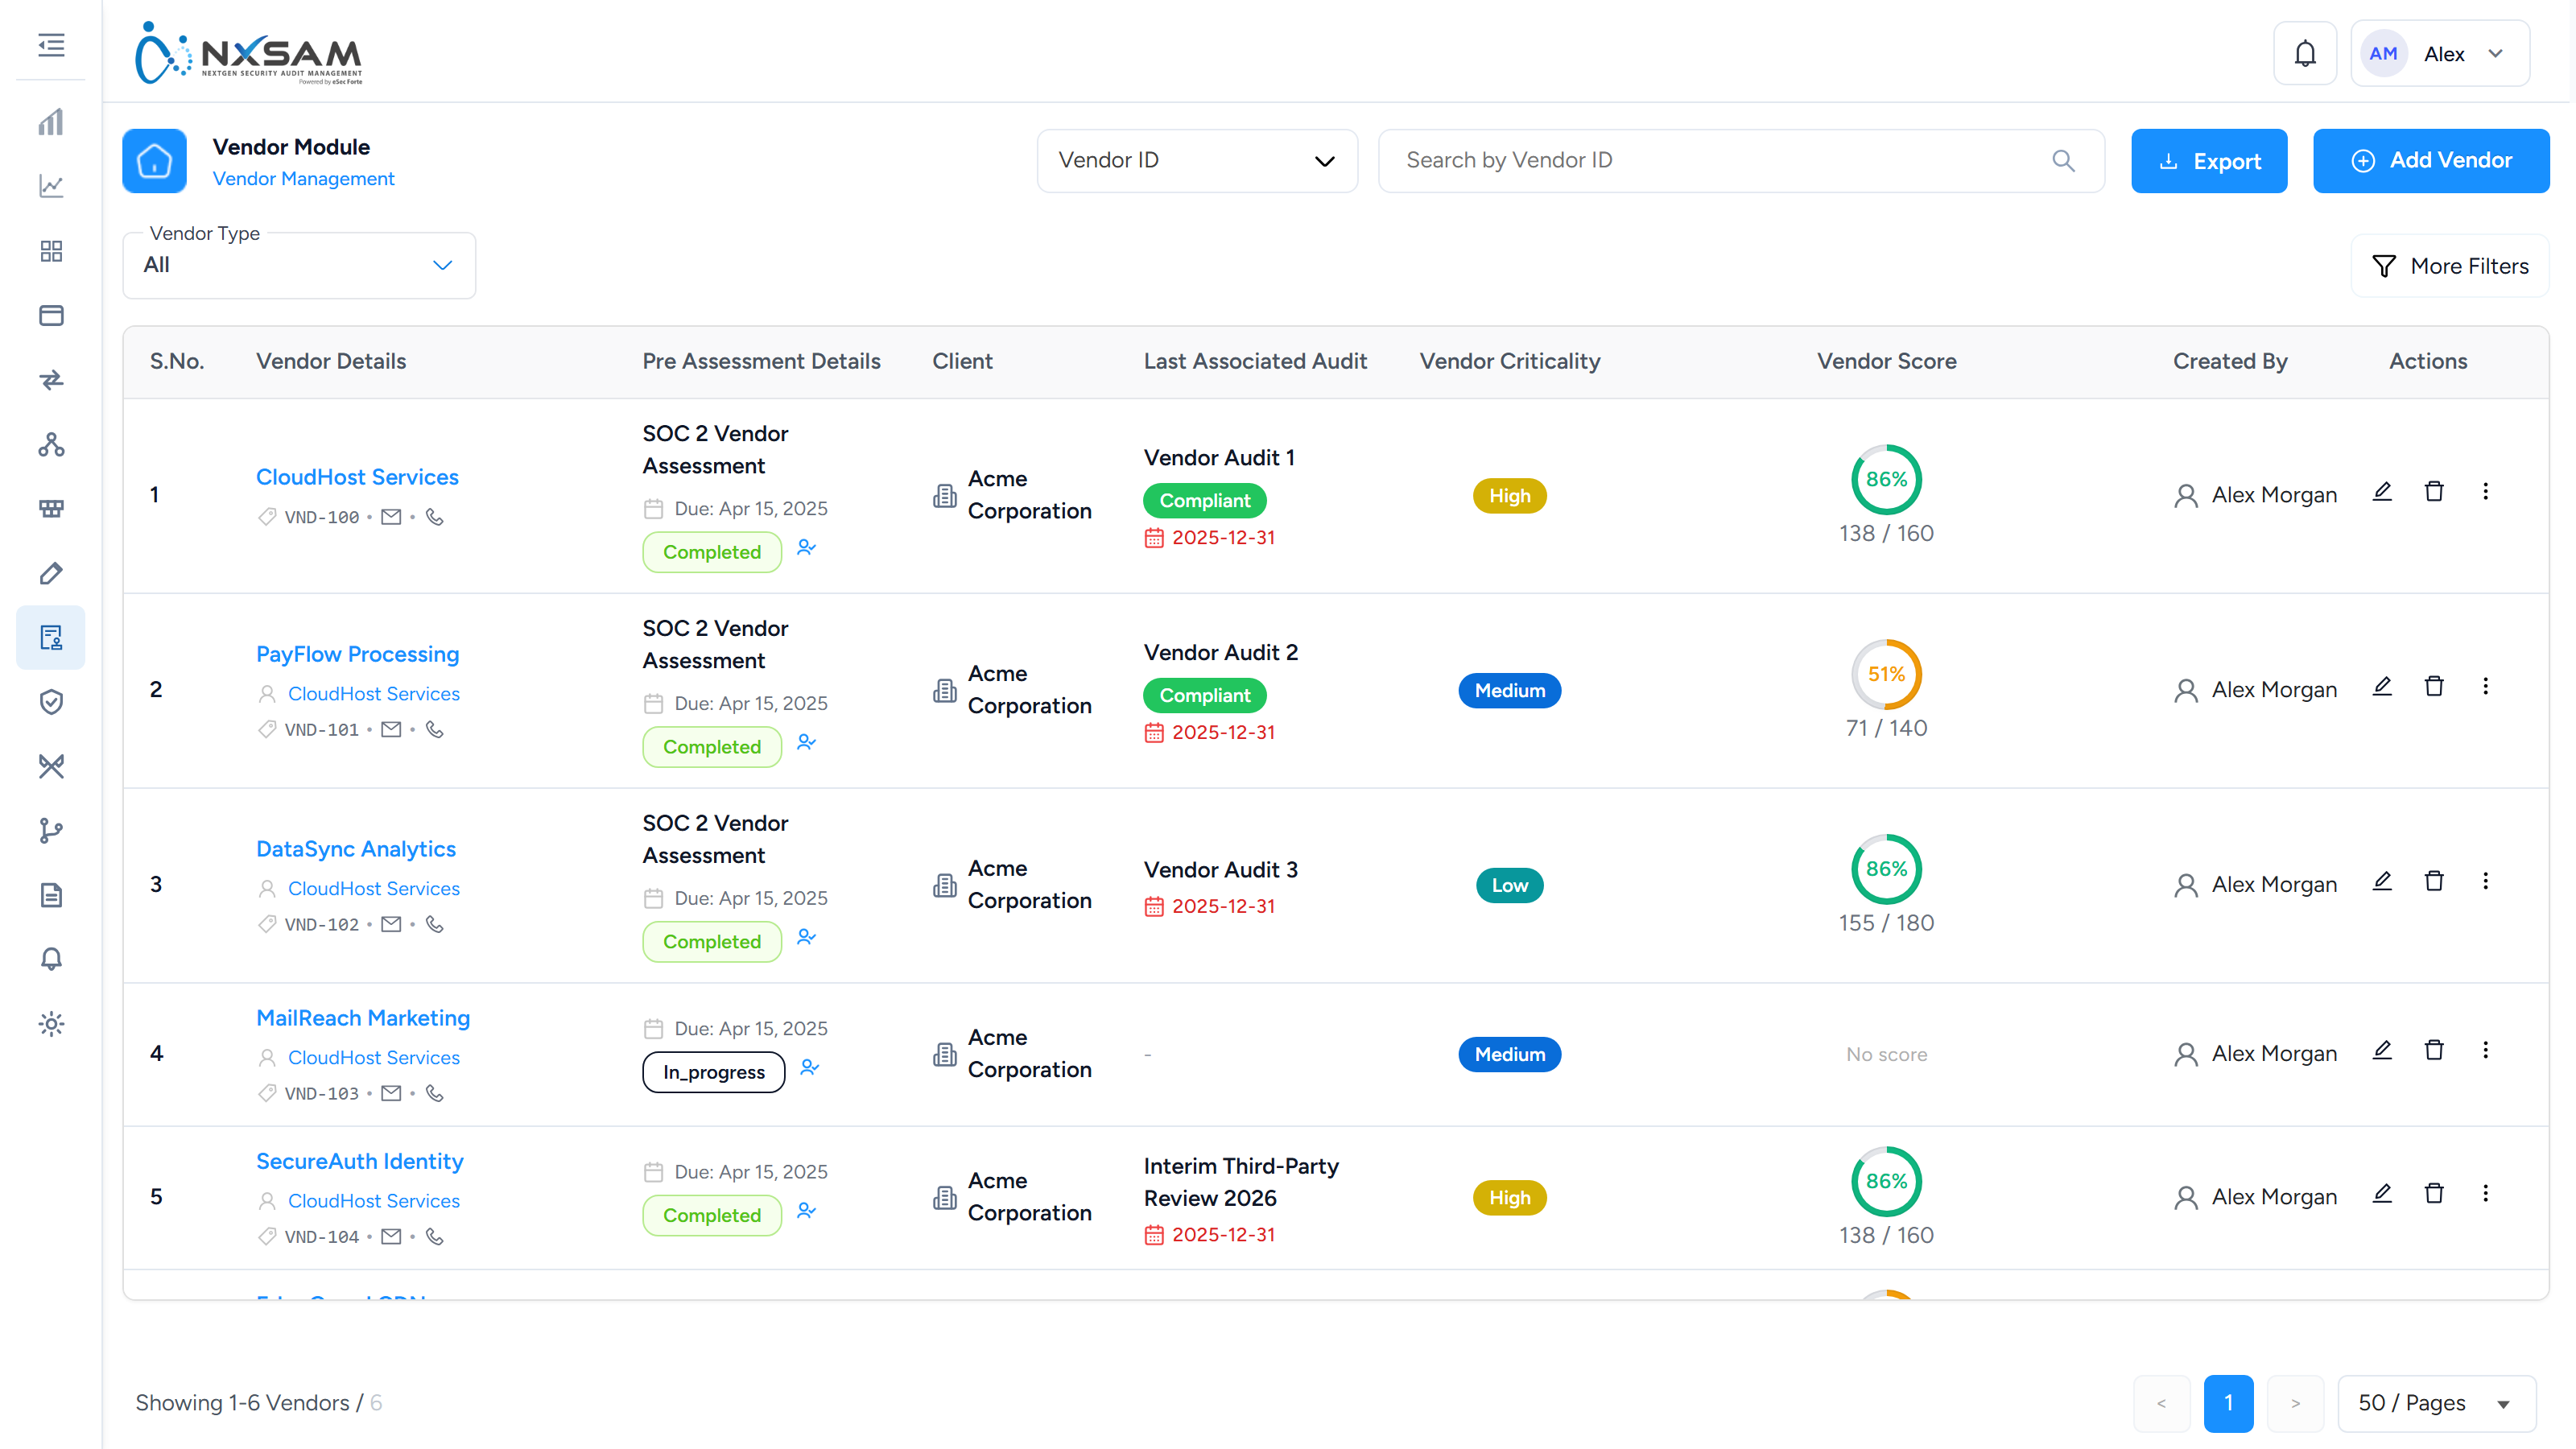
- Create the audit from a template appropriate to the vendor's tier.
- Invite the vendor. Their users receive access to their assessment only.
- The vendor responds, answering controls and attaching evidence.
- You review the responses — accepting, challenging, or asking for more.
- Findings are raised where responses are inadequate.
- Risks are recorded where gaps represent ongoing exposure.
Vendor users
Vendor users are external people with deliberately narrow access. They see their own assessments and nothing else — not your assets, not your findings, not other vendors.
Because they are external, their access needs managing as relationships change. A vendor user whose engagement has ended should be deactivated.
Reusing work across vendors
Vendors answering similar questionnaires give similar answers, and standards overlap heavily. TPRM includes support for identifying where a control in one framework matches a control in another, so an answer already given can be reused rather than re-collected.
This matters most when a vendor is assessed against several frameworks, or reassessed year after year — a great deal of what they told you last time remains true.
What good looks like
- Tier first, then assess. Pre-assessment before the full questionnaire keeps effort proportionate.
- Findings need owners on your side. A vendor gap is your exposure; someone internal has to decide what to do about it.
- Reassess on a cycle. A vendor assessed once three years ago is effectively unassessed.
Third-Party Risk: every screen, column and action
TPRM assesses organisations rather than systems, and the people answering are outside yours — which shapes every screen in the module.
The vendor register
| Column | What it holds |
|---|---|
| Vendor Details | Name, identifier, and the parent vendor where one exists |
| Pre Assessment Details | The triage result that decided how much scrutiny this vendor gets |
| Client | Which of your organisations engages them |
| Last Associated Audit | The most recent assessment |
| Max Expiry Date | When the current assessment stops being valid |
| Vendor Criticality | How much your business depends on them |
| Vendor Score | The assessment result |
| Created By | Who onboarded them |
Max Expiry Date is the register's working column
A vendor assessment has a validity period. Max Expiry Date is the latest date the current assessment remains acceptable, and a register sorted by it is a work queue — everything approaching that date needs reassessment.
A vendor past it is not "overdue on a task"; they are a supplier you can no longer evidence having assessed, which is a different conversation with an auditor.
Vendor Criticality against Vendor Score is the pair that matters. A low score on a low-criticality supplier is tolerable. The same score on a critical one is the finding.
Parent and child vendors exist because large suppliers are engaged through subsidiaries — assessing the parent once and inheriting to the children avoids assessing the same organisation repeatedly.
Vendor Email on the onboarding form is optional, and it does two things when given. If it matches an existing user, that user is linked as the vendor's default user; if it does not, a new user is created with it. Left blank, no user is created and one can be added later from Vendor users. Give it when you know who at the vendor will answer the assessment; leave it blank when you do not, rather than inventing a contact.
Pre-assessment
A short questionnaire that decides how much assessment a vendor warrants.
| Column | What it holds |
|---|---|
| Vendor | Who is being triaged |
| Scorecard | Which scoring model was applied |
| Submitted | Whether the vendor has responded |
| Scope | What the engagement covers |
| Computed Tier | The tier the scorecard calculated |
| Final Tier | The tier actually applied |
| Status | Where the pre-assessment is |
Computed Tier and Final Tier are separate on purpose
The scorecard computes a tier from the answers. A human can override it, and the override is recorded separately rather than replacing the computation.
When they differ, someone made a judgement — and that is exactly what an auditor asks about. The two columns exist so the question has an answer.
The detail and summary screens follow the RLCM shape: Sections, Control Details,
Current Level, User Input for the detail; Section, Control, Current Level,
POC Input, Rev Input for the summary; and Sections, Control details, Status,
POC, Reviewer for management.
Note there is no auditor column in pre-assessment. Triage is an internal judgement about how much work to do, not an assessment in its own right.
The scorecard configuration
Defines how pre-assessment answers become a score and a tier. Changing it re-tiers future pre-assessments; it does not re-tier vendors already triaged, so a register can hold vendors tiered under two different models.
Vendor users
External people who sign in to complete assessments.
| Column | What it holds |
|---|---|
| Vendor Details | Which vendor they belong to |
| User Details | Name and contact |
| Role | What they can do |
| User Type | The kind of account |
| Allowed Audit Type | Which assessments they may see |
| OTP Login | Whether one-time-password sign-in is enforced for them |
| User Status | Active or not |
These are accounts outside your organisation
Allowed Audit Type is an access control, not a convenience filter. A vendor user who can see assessments beyond their own engagement can see how you assess their competitors.
OTP Login matters more here than for internal users: you do not control these people's password hygiene, their device, or what happens to their account when they change jobs. Enforcing OTP is the only lever you have.
User Status is what you set when an engagement ends. Deleting the user loses the audit trail of who answered what.
Which fields the vendor user form shows is a setting, not a property of the form. Configurations → RLCM Configuration → Vendor User Form Setting has a Form Type of Basic — only the core fields, for quick onboarding — or Advanced, which adds User type, Roles, User status, Landing page, IP group and Allowed audit type, and a separate switch for OTP Login. A vendor user created under Basic gets the defaults for everything Advanced would have asked; check them there if a vendor user can see more or less than intended.
Vendor properties
Property Name, Property Type, Order, Required, Created By — custom fields on a
vendor record. Required blocks vendor creation until filled, which is how an
organisation enforces that, say, a contract reference is always captured.
TPRM audits and findings
Findings share the RLCM shape — Audit & Finding Info, Control Details,
Risk & Observations, Status — with Add Risk and Map Existing Risk.
The distinction that matters: a TPRM risk belongs to your register, not the vendor's. You are recording a risk your organisation carries because of a supplier, which is why these findings feed the same register as internal ones.
Control similarity
Matches a vendor's questionnaire against controls already assessed elsewhere, so a vendor who has answered an equivalent question for another framework is not asked again. Broad Match finds the same requirement worded differently; Precision Match finds close textual correspondence.
This is the difference between a fifty-question assessment and a two-hundred-question one, and vendors notice.
Third-Party Risk (TPRM): find the right screen
Every screen in this module, what each one is for, and where it lives. Use it to find the right screen quickly, and to confirm you are on the one a colleague means — several screens in this product have similar names and different jobs.
Screenshots come from a demonstration data set, so the figures are illustrative. Click any screenshot to open it at full resolution.
Pre-Assessment Detail
One vendor's pre-assessment responses in full.

Pre-Assessment Management
Pre-assessments in flight and their outcomes.
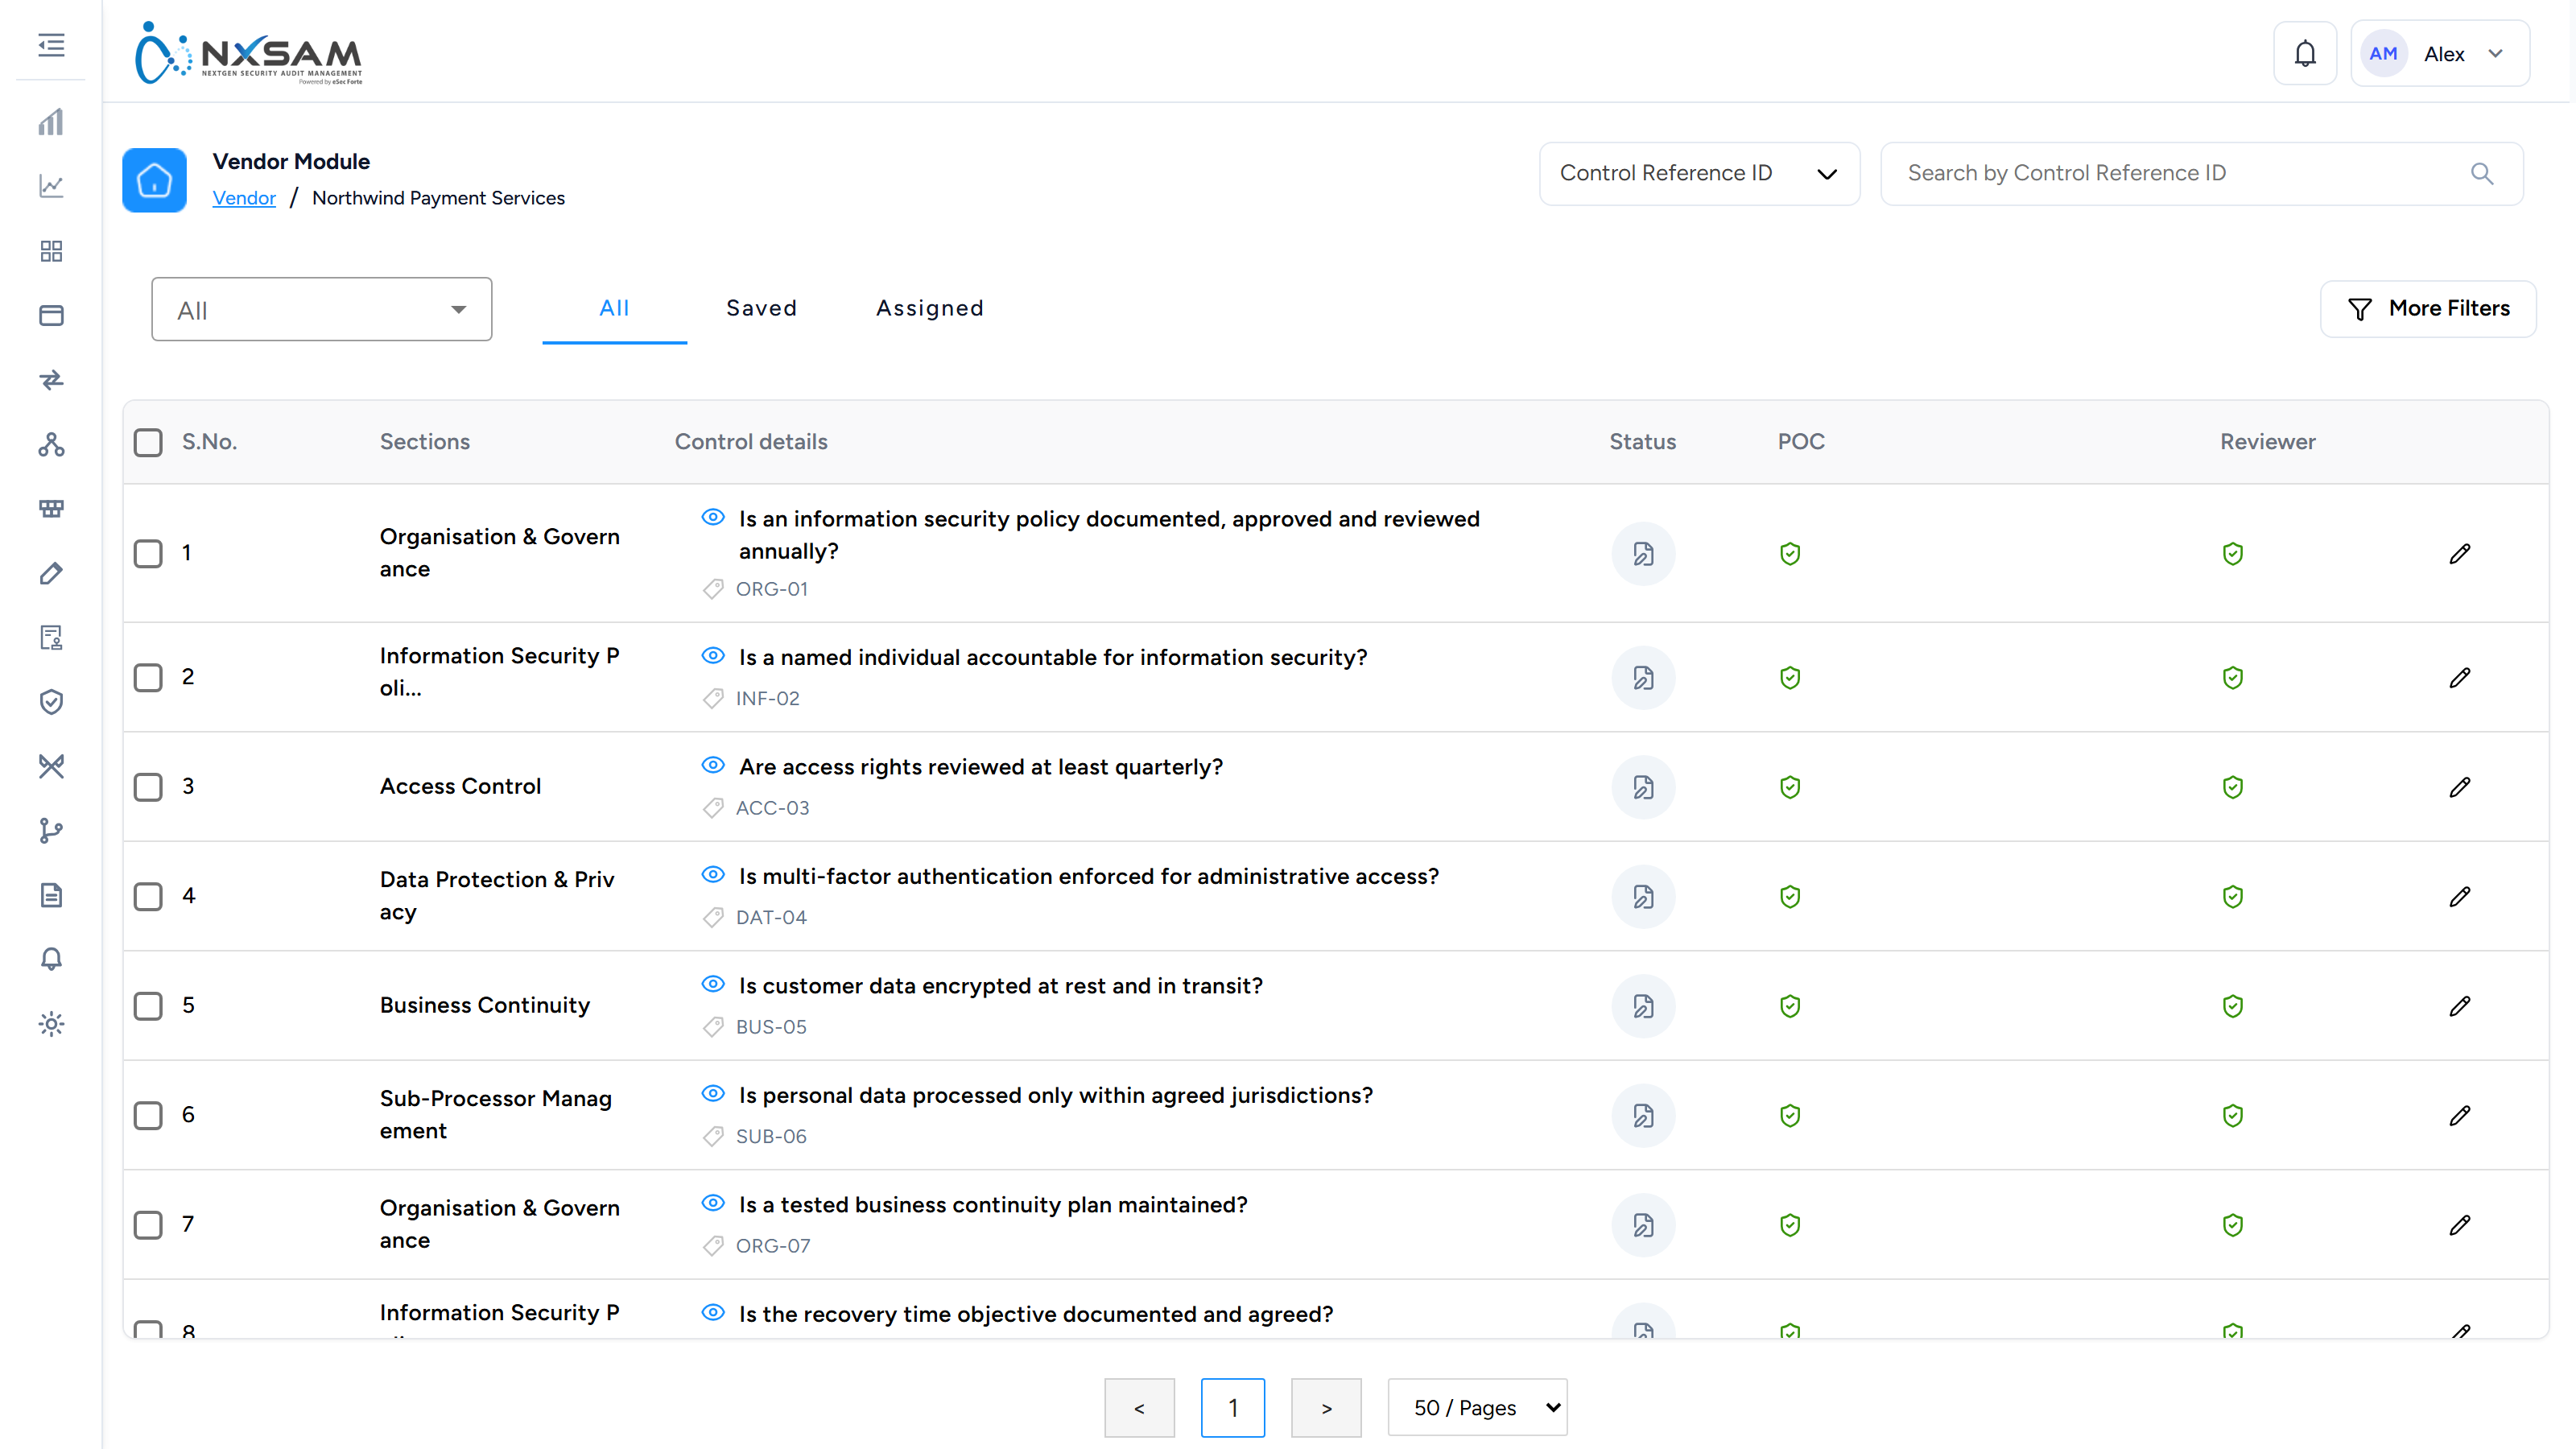
Pre-Assessment Scorecard
How pre-assessment answers turn into a score and a tier.

Pre-Assessment Summary
The resulting tier and score, and what it means for the assessment that follows.
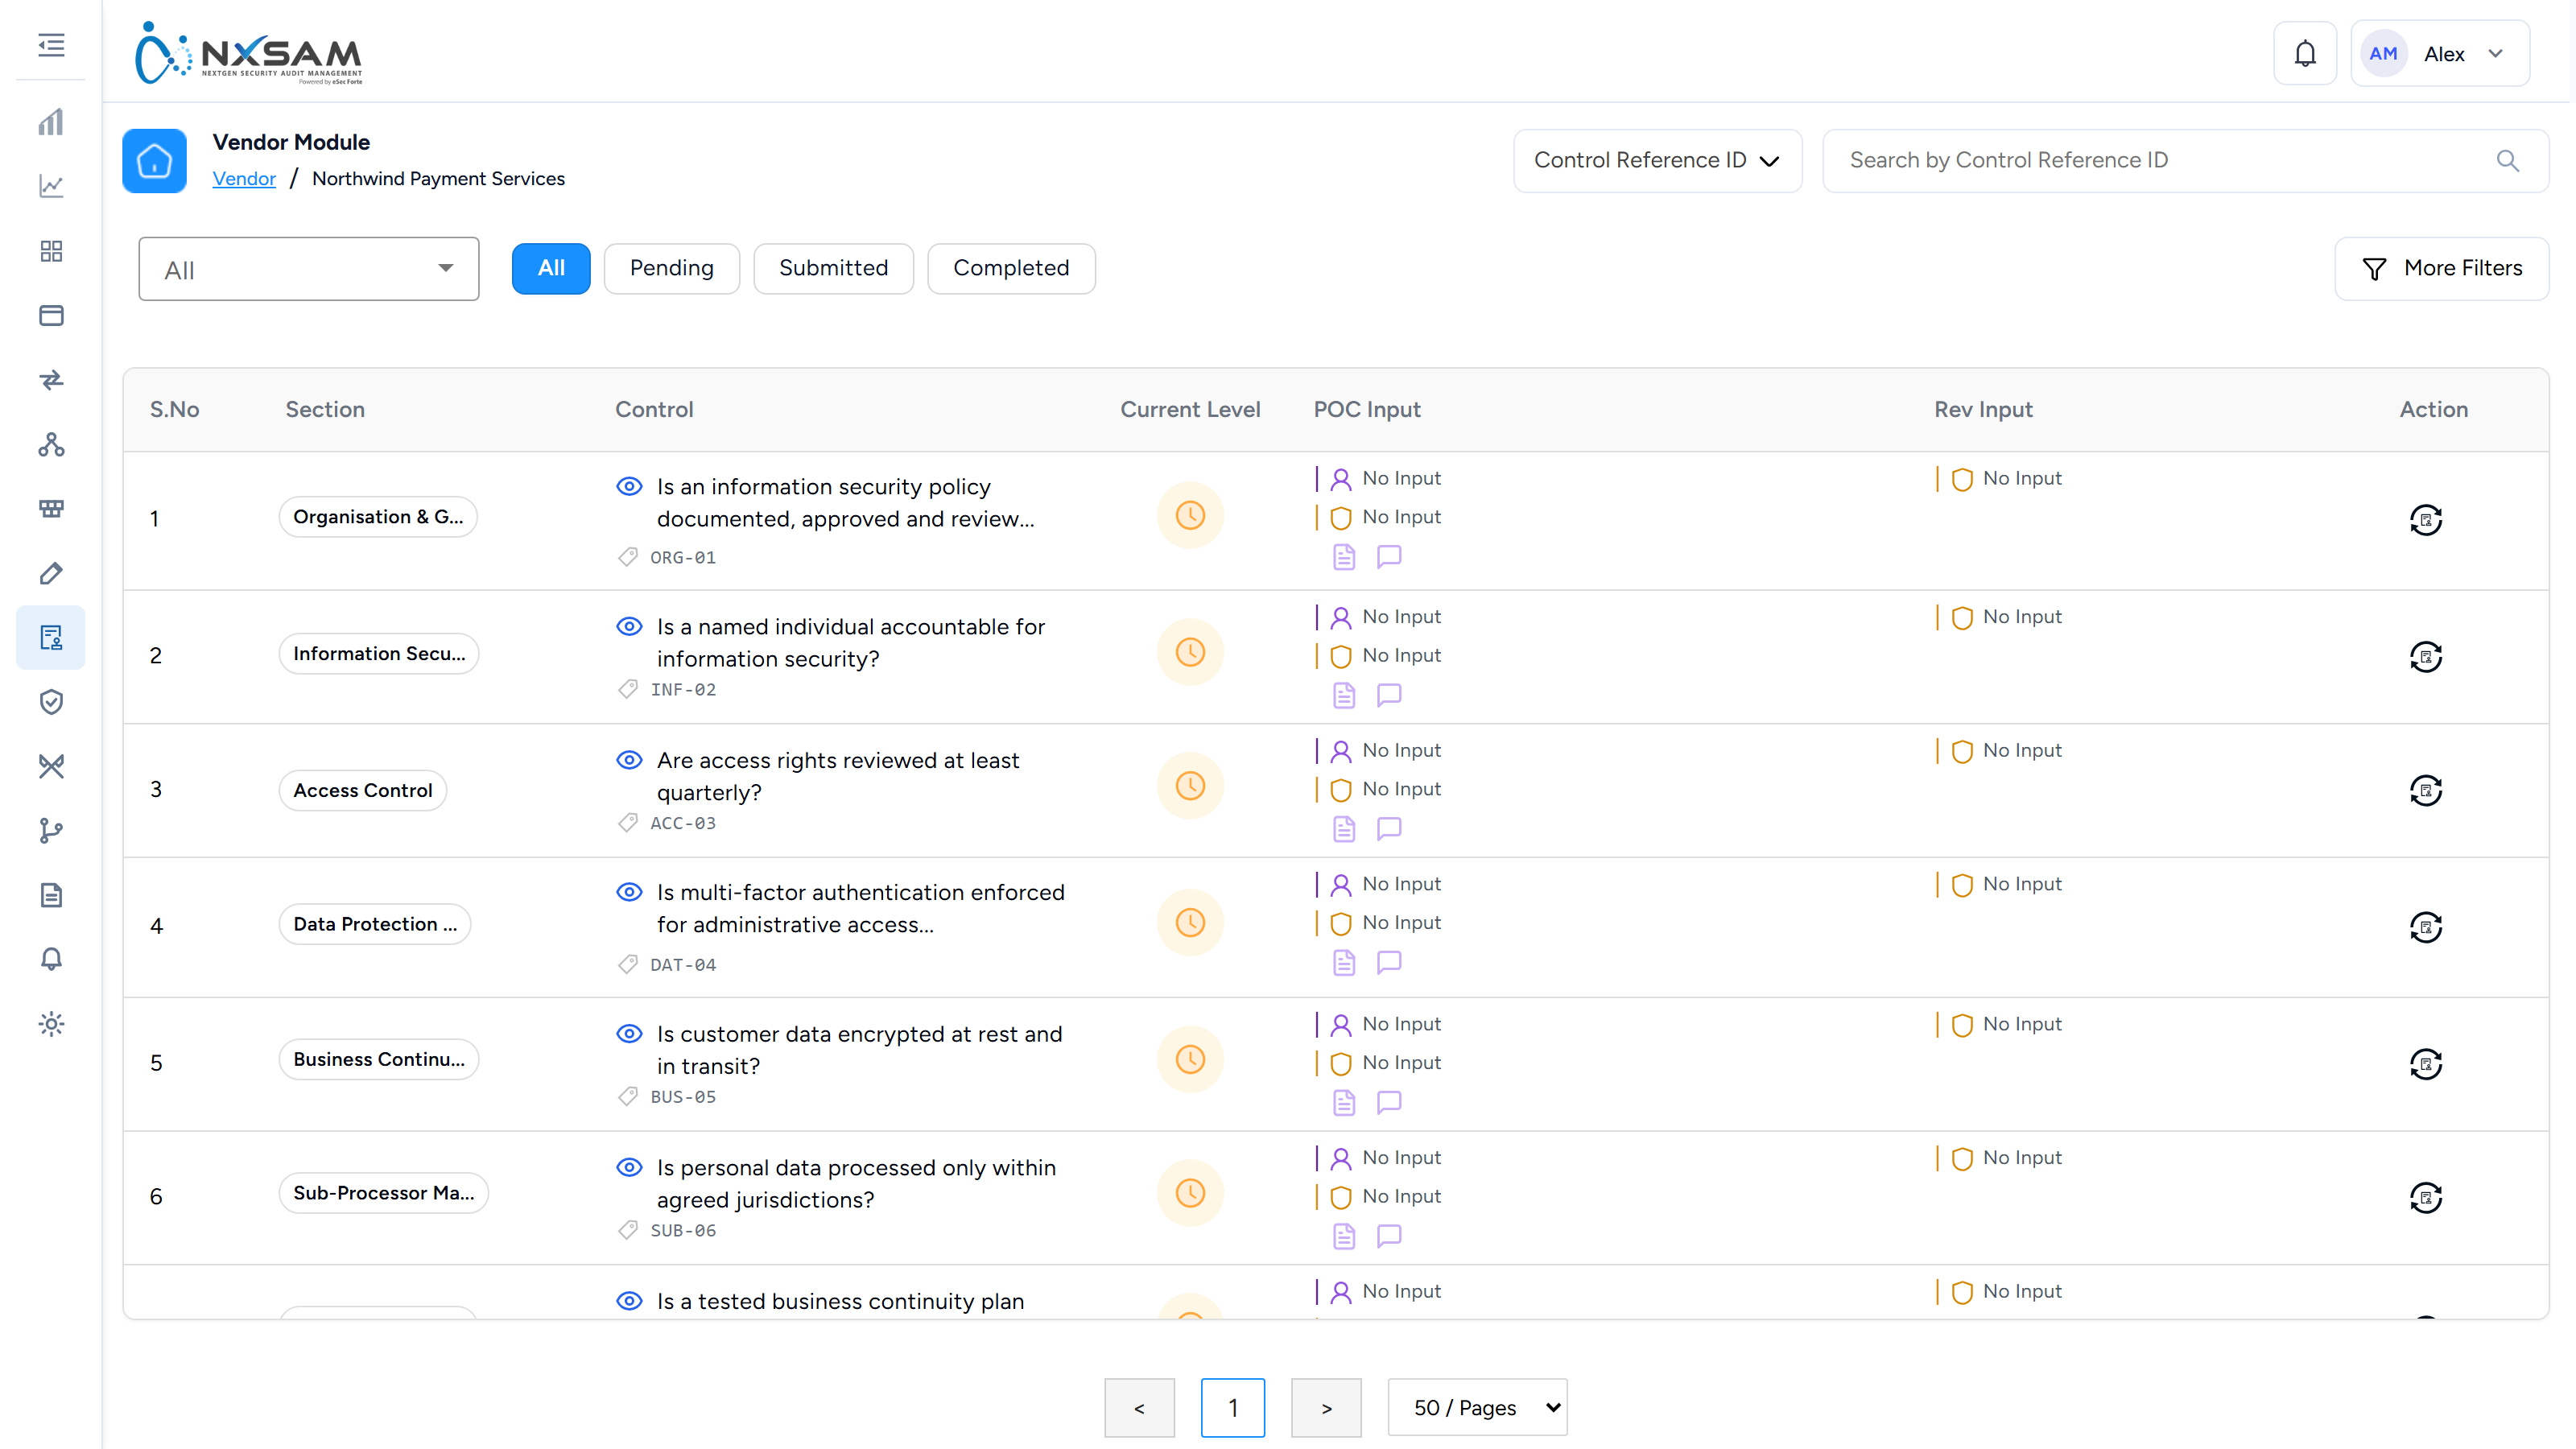
TPRM Audits
Vendor assessments run as audits, with findings against the vendor rather than an asset.
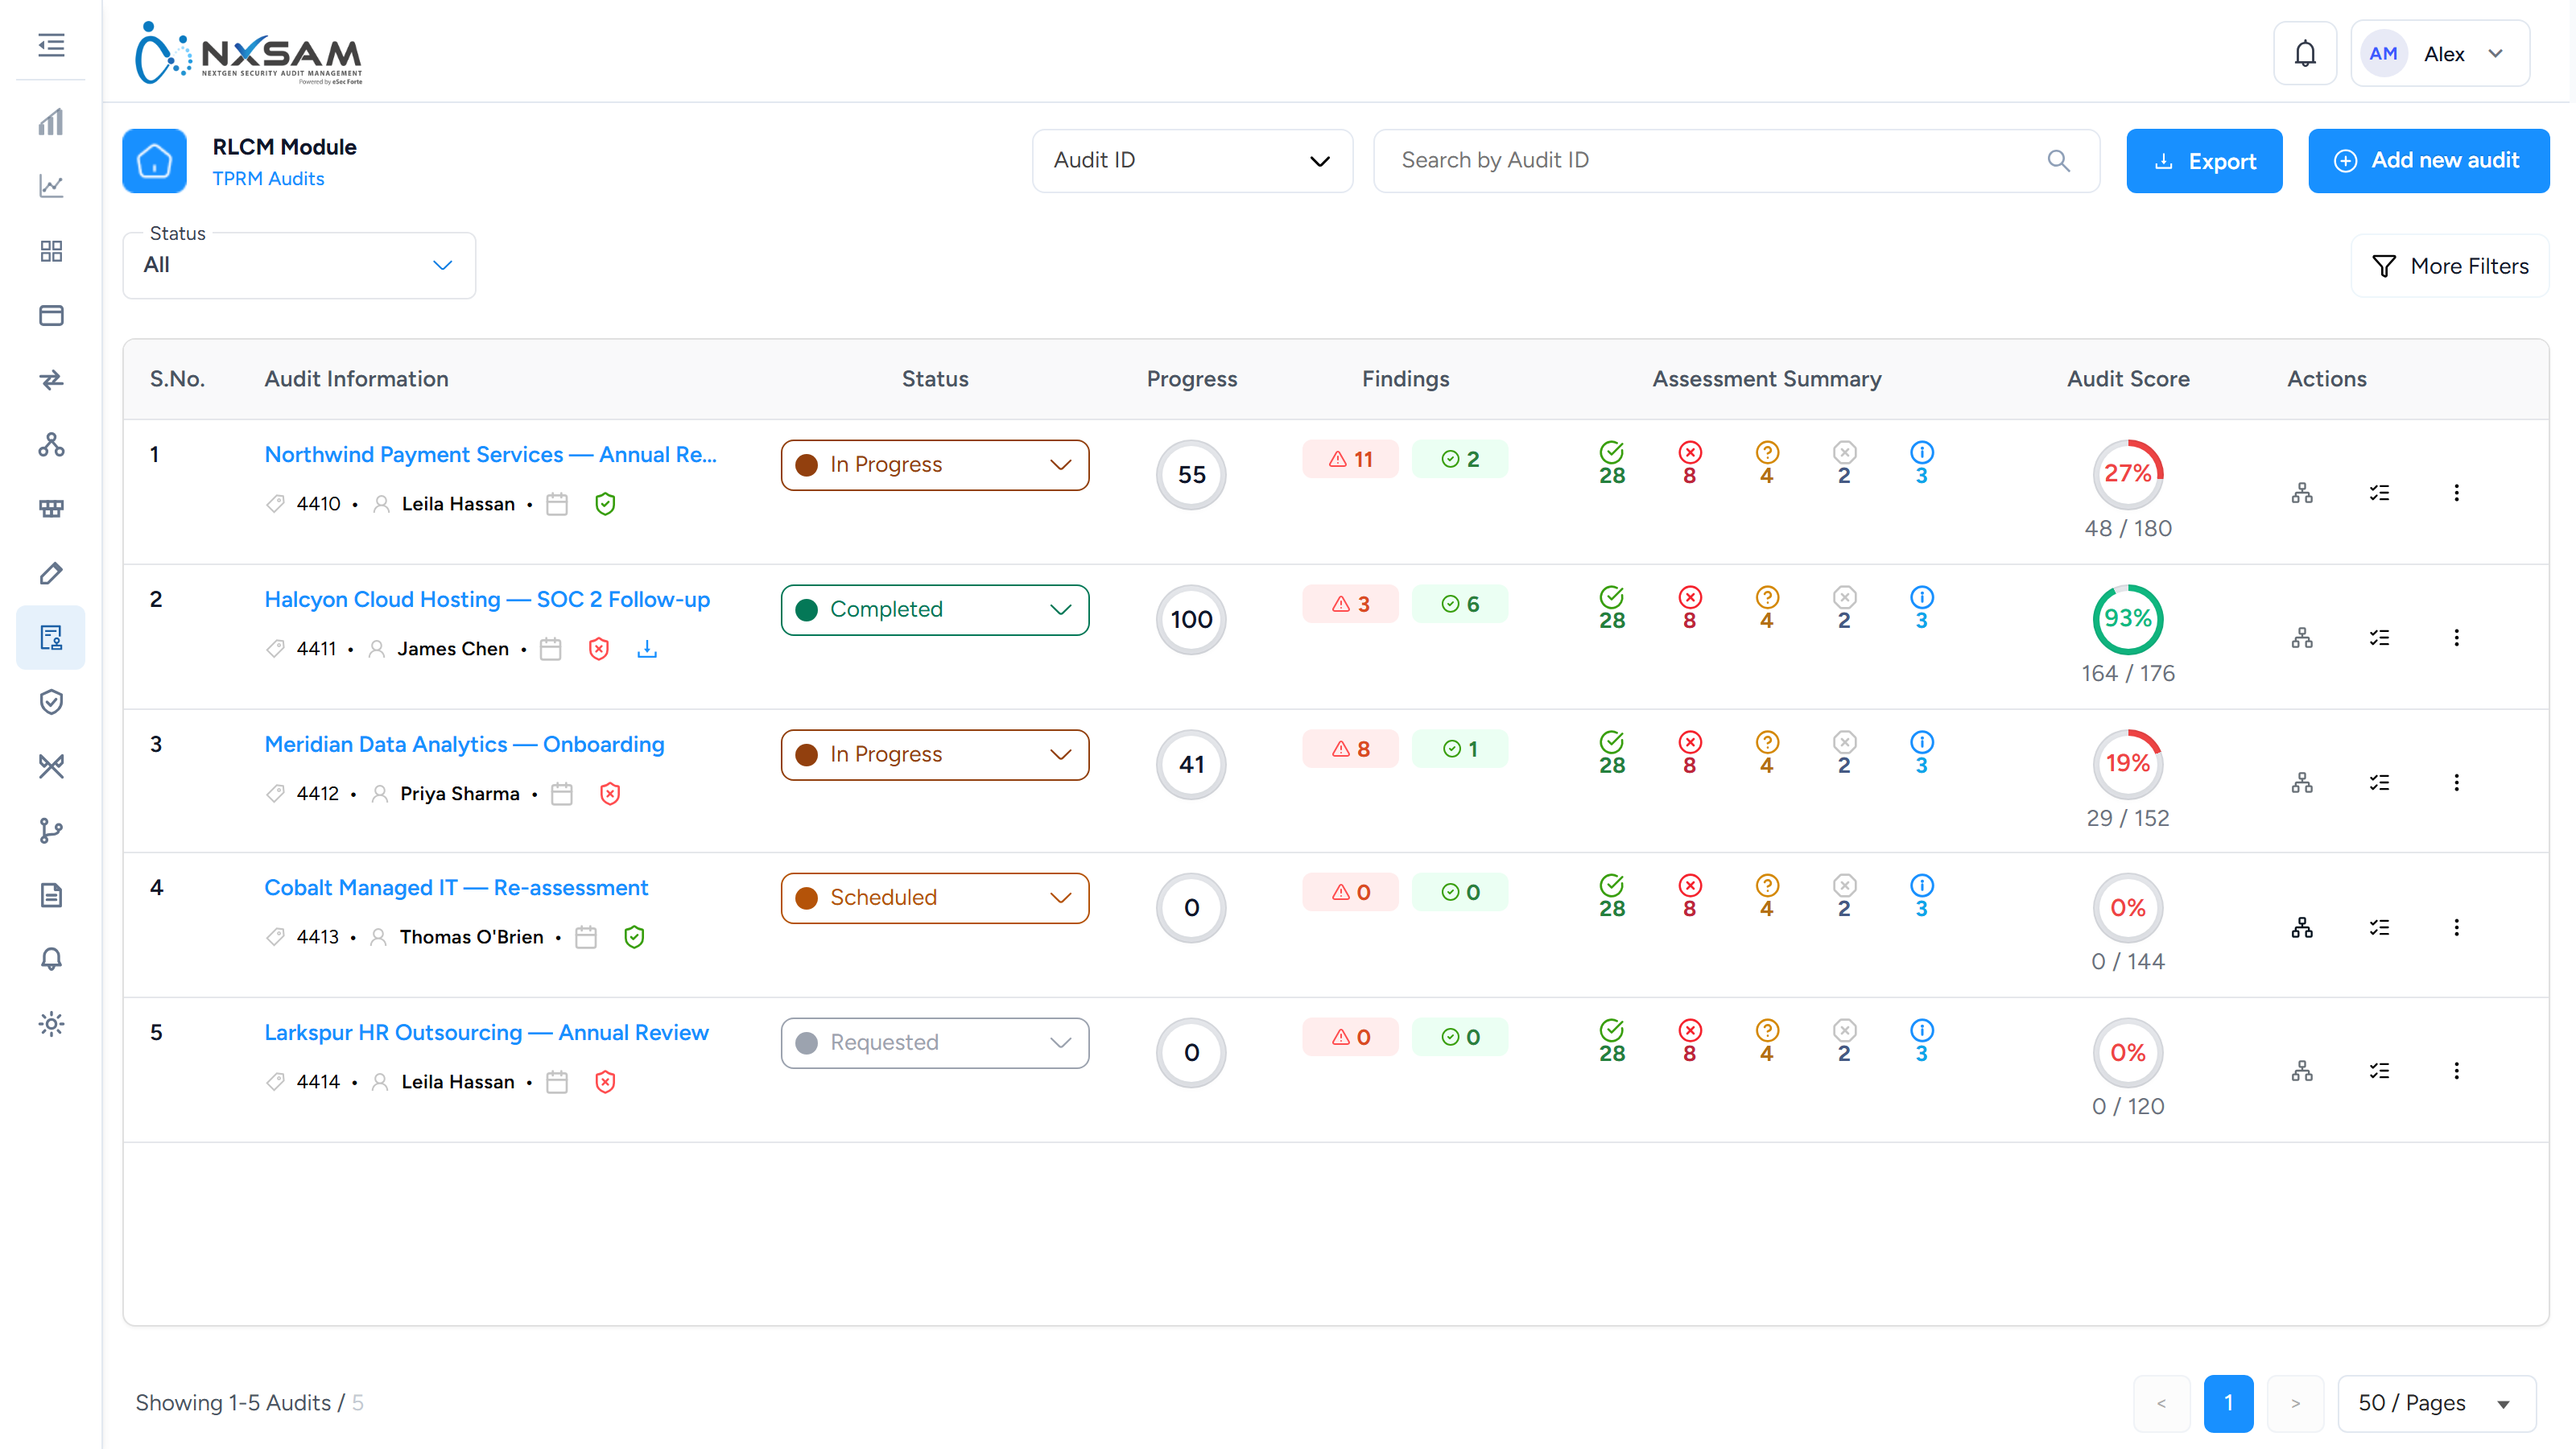
Vendor Pre-Assessment
A short questionnaire that decides how much scrutiny a vendor warrants before the full assessment.

Vendor Properties
Custom fields recorded against a vendor.
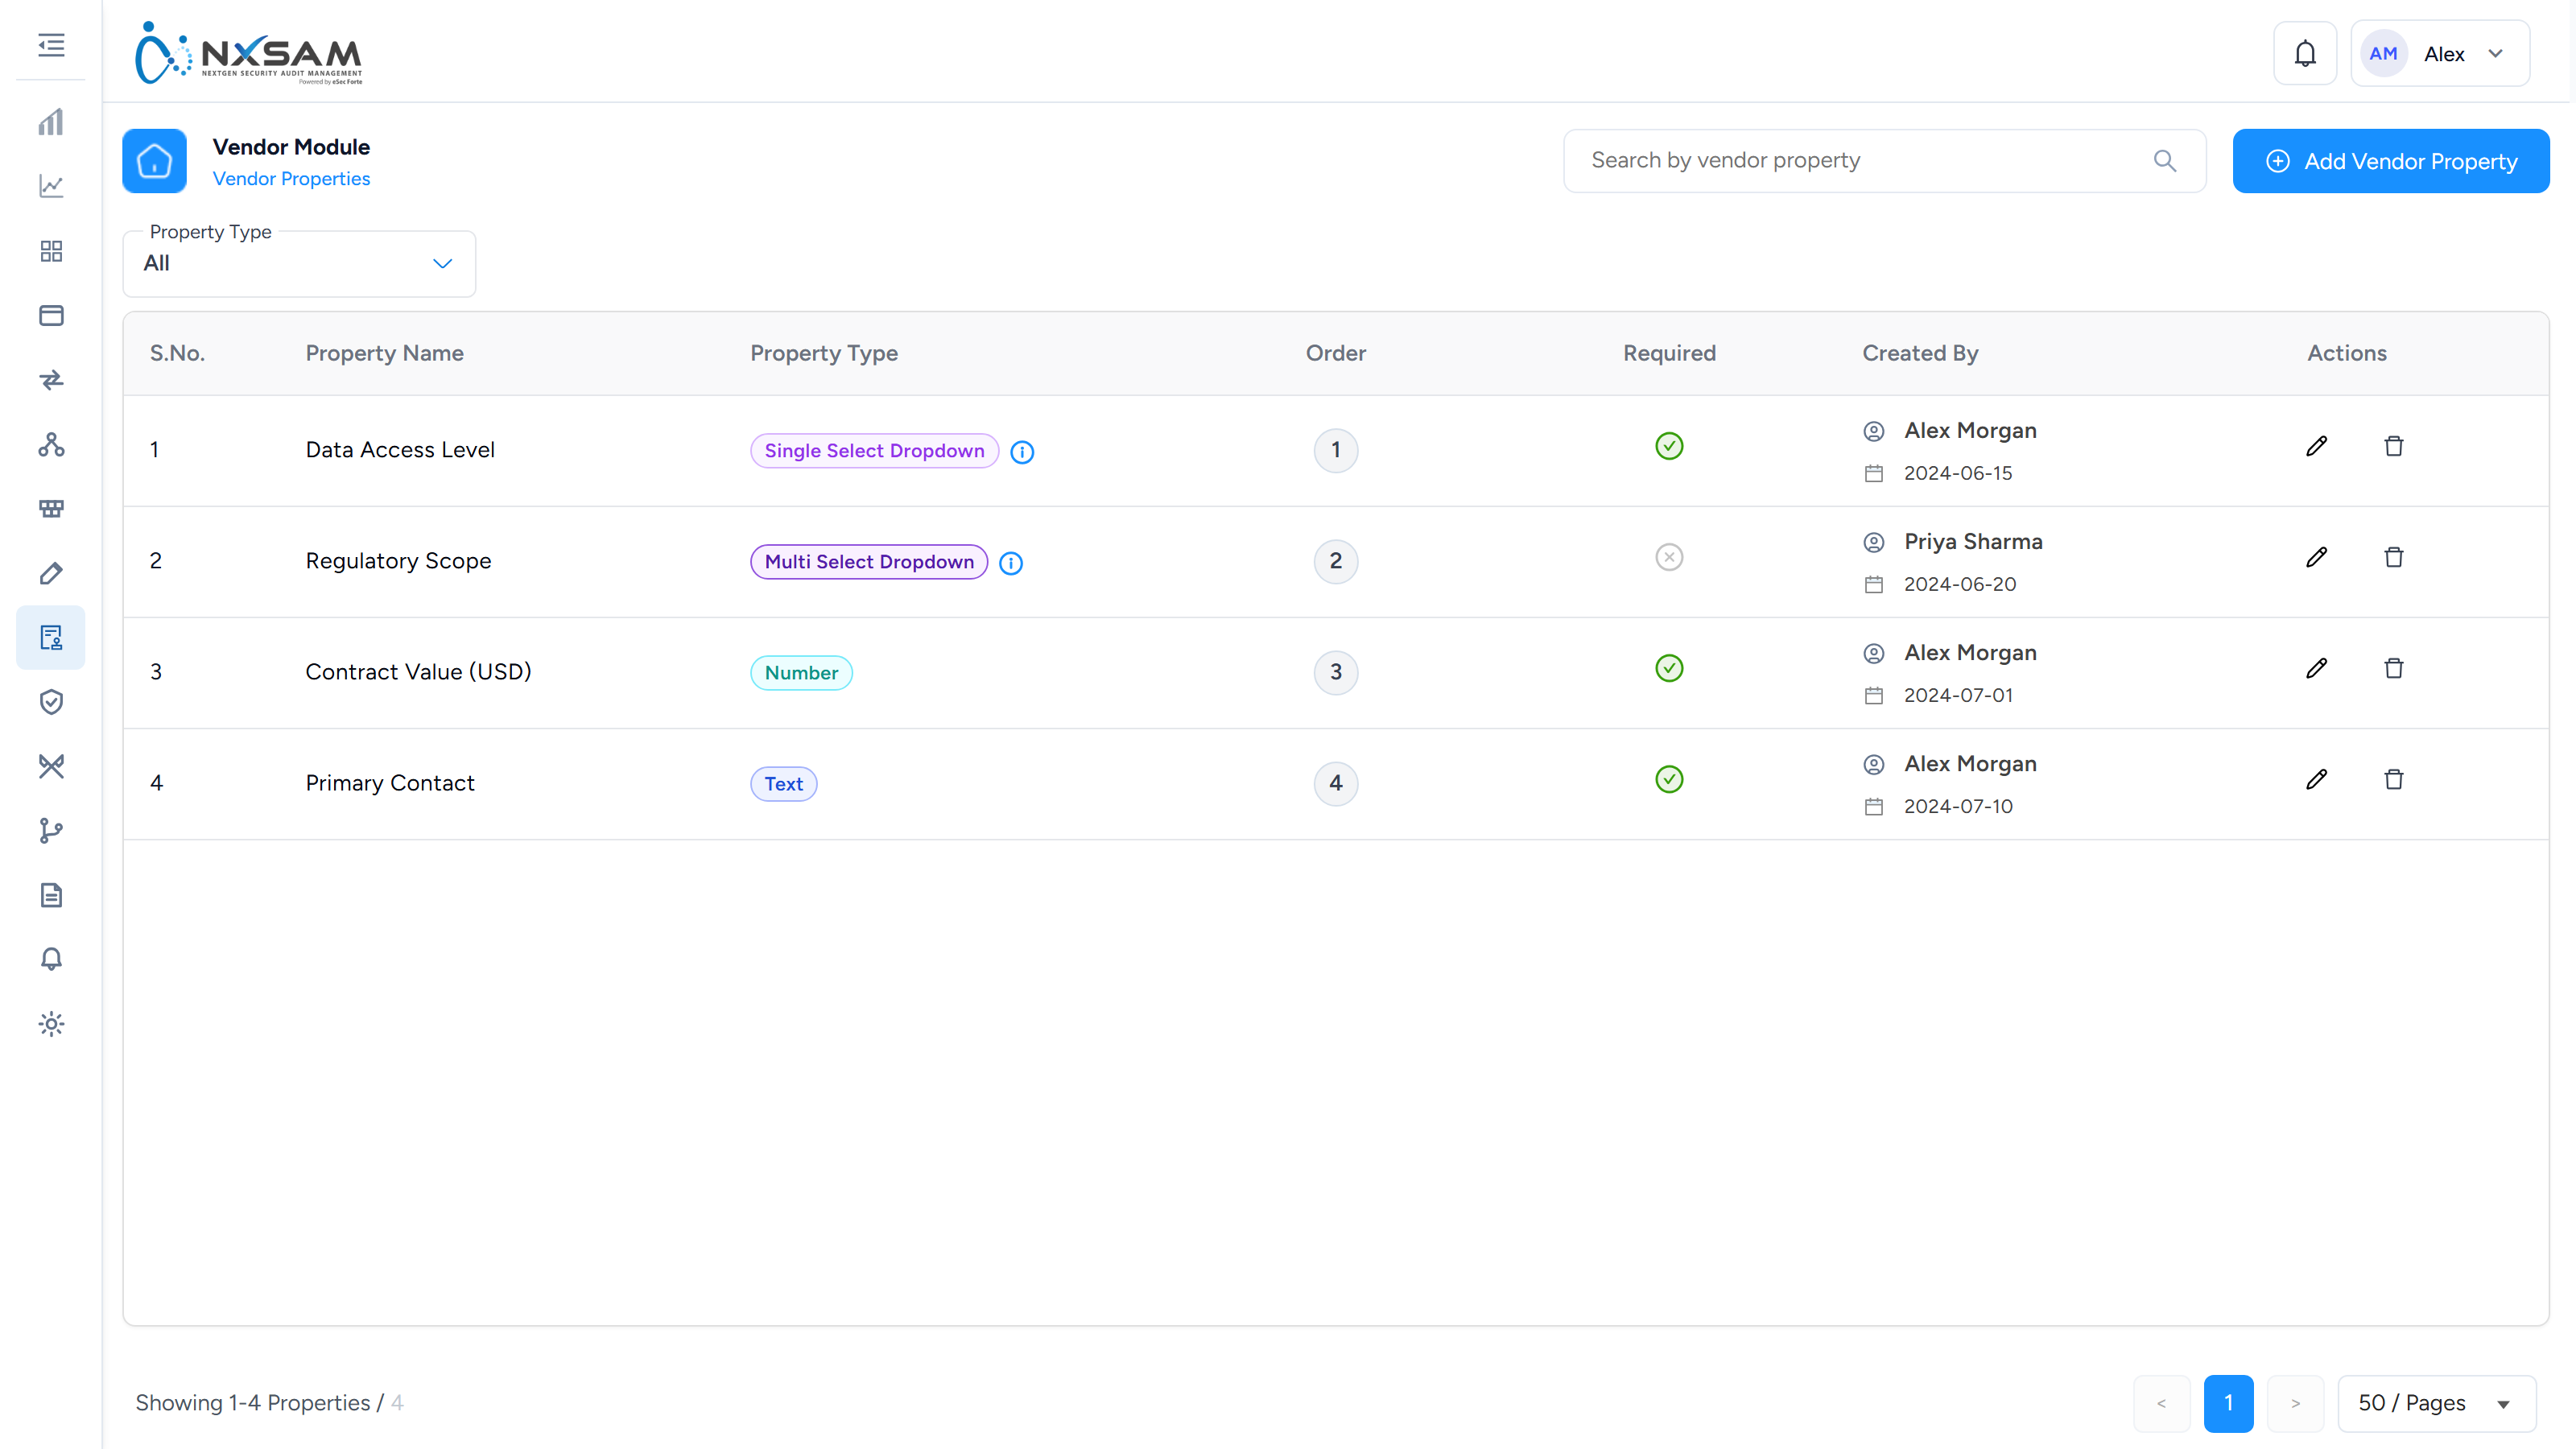
Vendor Users
External contacts who can sign in to complete assessments. They see only what the vendor form settings allow.
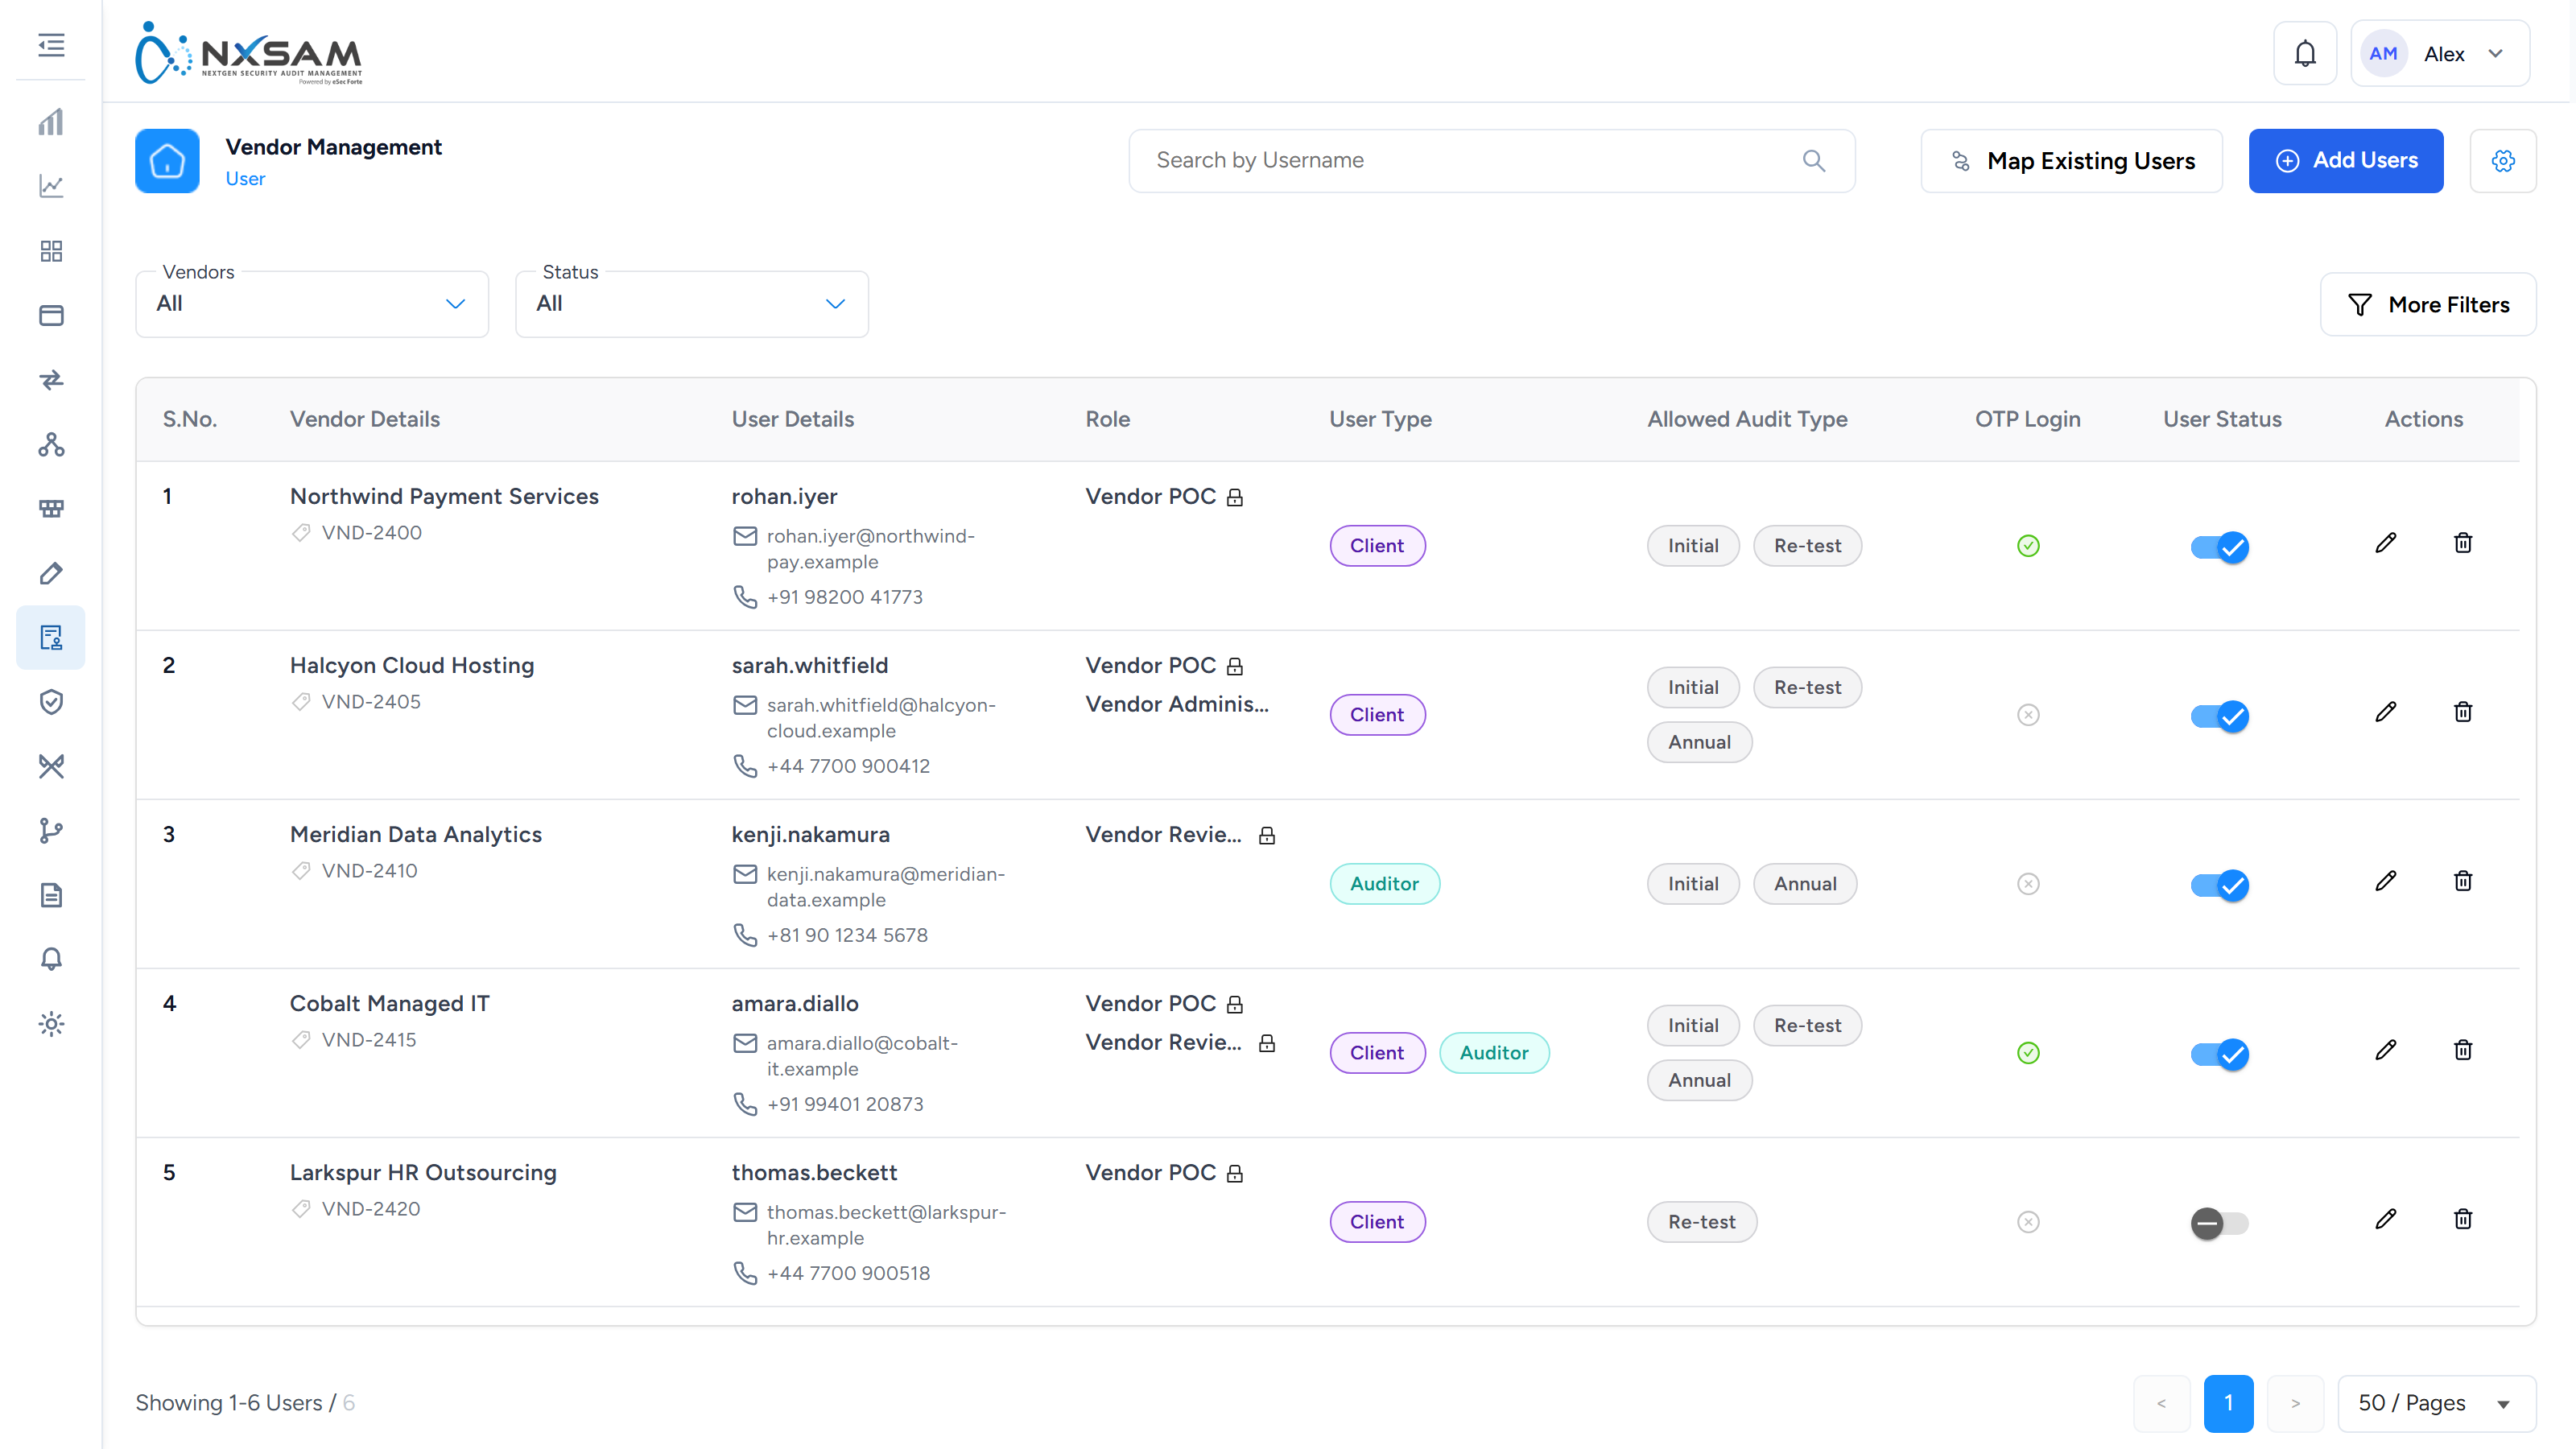
Supplier assessment (TPRM): support reference
Internal. The customer-facing explanation is in the screen reference.
TPRM assesses organisations rather than systems, and the people answering are outside your organisation. Both facts shape its tickets: access problems and stalled assessments dominate, and neither is a defect.
Vendor users are a separate population
A supplier's staff sign in as vendor users, with vendor roles, and see only their own assessment. Three fields decide what they can do, and all three are edited on the user rather than on the assessment:
| Field | Decides |
|---|---|
| Role | Vendor POC, reviewer or administrator |
| User Type | Whether they act as client, auditor, or both |
| Allowed Audit Type | Which kinds of assessment they may open |
A vendor contact who "cannot see the questionnaire" usually has no allowed audit type covering it, or is set to the wrong user type.
OTP login can be enabled per vendor user. Where it is, sign-in depends on their mobile or email being correct on the account — a detail nobody notices until the first attempt.
Assessments stall on people, not on the platform
The pre-assessment moves POC → reviewer → decision, and Pending On names whose turn it is. An assessment that "isn't progressing" is nearly always waiting on a named person, and the screen already says who.
Control status and the person it is pending on are shown together for that reason.
Computed tier against final tier
The scorecard produces a computed tier from the answers. The final tier is what the organisation actually assigns, and it can differ — with a stated override reason.
Two consequences:
- A vendor's tier "not matching the score" is the override working as designed. The reason field says why.
- Reporting that reads the computed tier where the business acts on the final one will disagree with the business.
Scoring may be switched off
Scoring and manual re-assessment are configurable. Where scoring is disabled, tiers are assigned rather than calculated, and a caller expecting a score will not find one.
Evidence comes from outside
Vendor-supplied evidence is uploaded by people you do not administer. Where a control requires evidence, it cannot be completed without it, and chasing that is the account manager's job rather than a platform issue.
It shares screens with RLCM
TPRM control assessment uses the same screens as internal compliance, differing by the audit's type. A screenshot or a link from one is indistinguishable from the other — compare the audit name, not the screen.
What to collect before escalating
- The vendor, and the assessment's name.
- The vendor user's role, user type and allowed audit types.
- The control reference and its Pending On value.
- Whether scoring is enabled for this deployment.
- For tier disputes: the computed tier, the final tier, and the override reason.
Deviations & Risk Acceptance
Deviations & Risk Acceptance
Sometimes a vulnerability cannot be fixed within its SLA. The fix may need a vendor release, a change freeze may be in force, or the cost of fixing may genuinely outweigh the risk. A deviation records that decision formally — who asked, who approved, on what grounds, and until when.
The purpose is that accepting risk is a dated, reviewable decision with a name attached, rather than a finding quietly ageing out of sight.
The shape of a deviation
| Requested by | The person asking to defer the fix |
| Justification | Why it cannot be fixed now, and what compensates for it |
| Approver | Determined by the approval configuration, usually by severity |
| Valid until | The date the acceptance stops being valid |
How one moves through the system
- Raised against a specific vulnerability, with a justification and a proposed end date.
- Routed to an approver. Who that is depends on your approval configuration — more severe findings usually require more senior sign-off.
- Approved or rejected. Rejection returns the vulnerability to normal tracking.
- Active until its end date.
- Expired once that date passes.
What expiry means
When a deviation expires, the vulnerability returns to normal tracking. It does not re-open — it was never closed — but it stops being covered by an accepted-risk decision and appears again in the expired list for attention.
Expired deviations can be renewed if the situation genuinely has not changed. Renewal is a fresh decision with a fresh end date, not an extension of the old one, so it goes through approval again.
A deviation does not close the vulnerability
This is the most common misunderstanding. A finding under an approved deviation is still an open finding. It still appears in open counts, and depending on your configuration it may still age.
A deviation documents why nothing is being done yet. It does not assert the weakness is gone. Only validation of an actual fix does that.
Where to find things
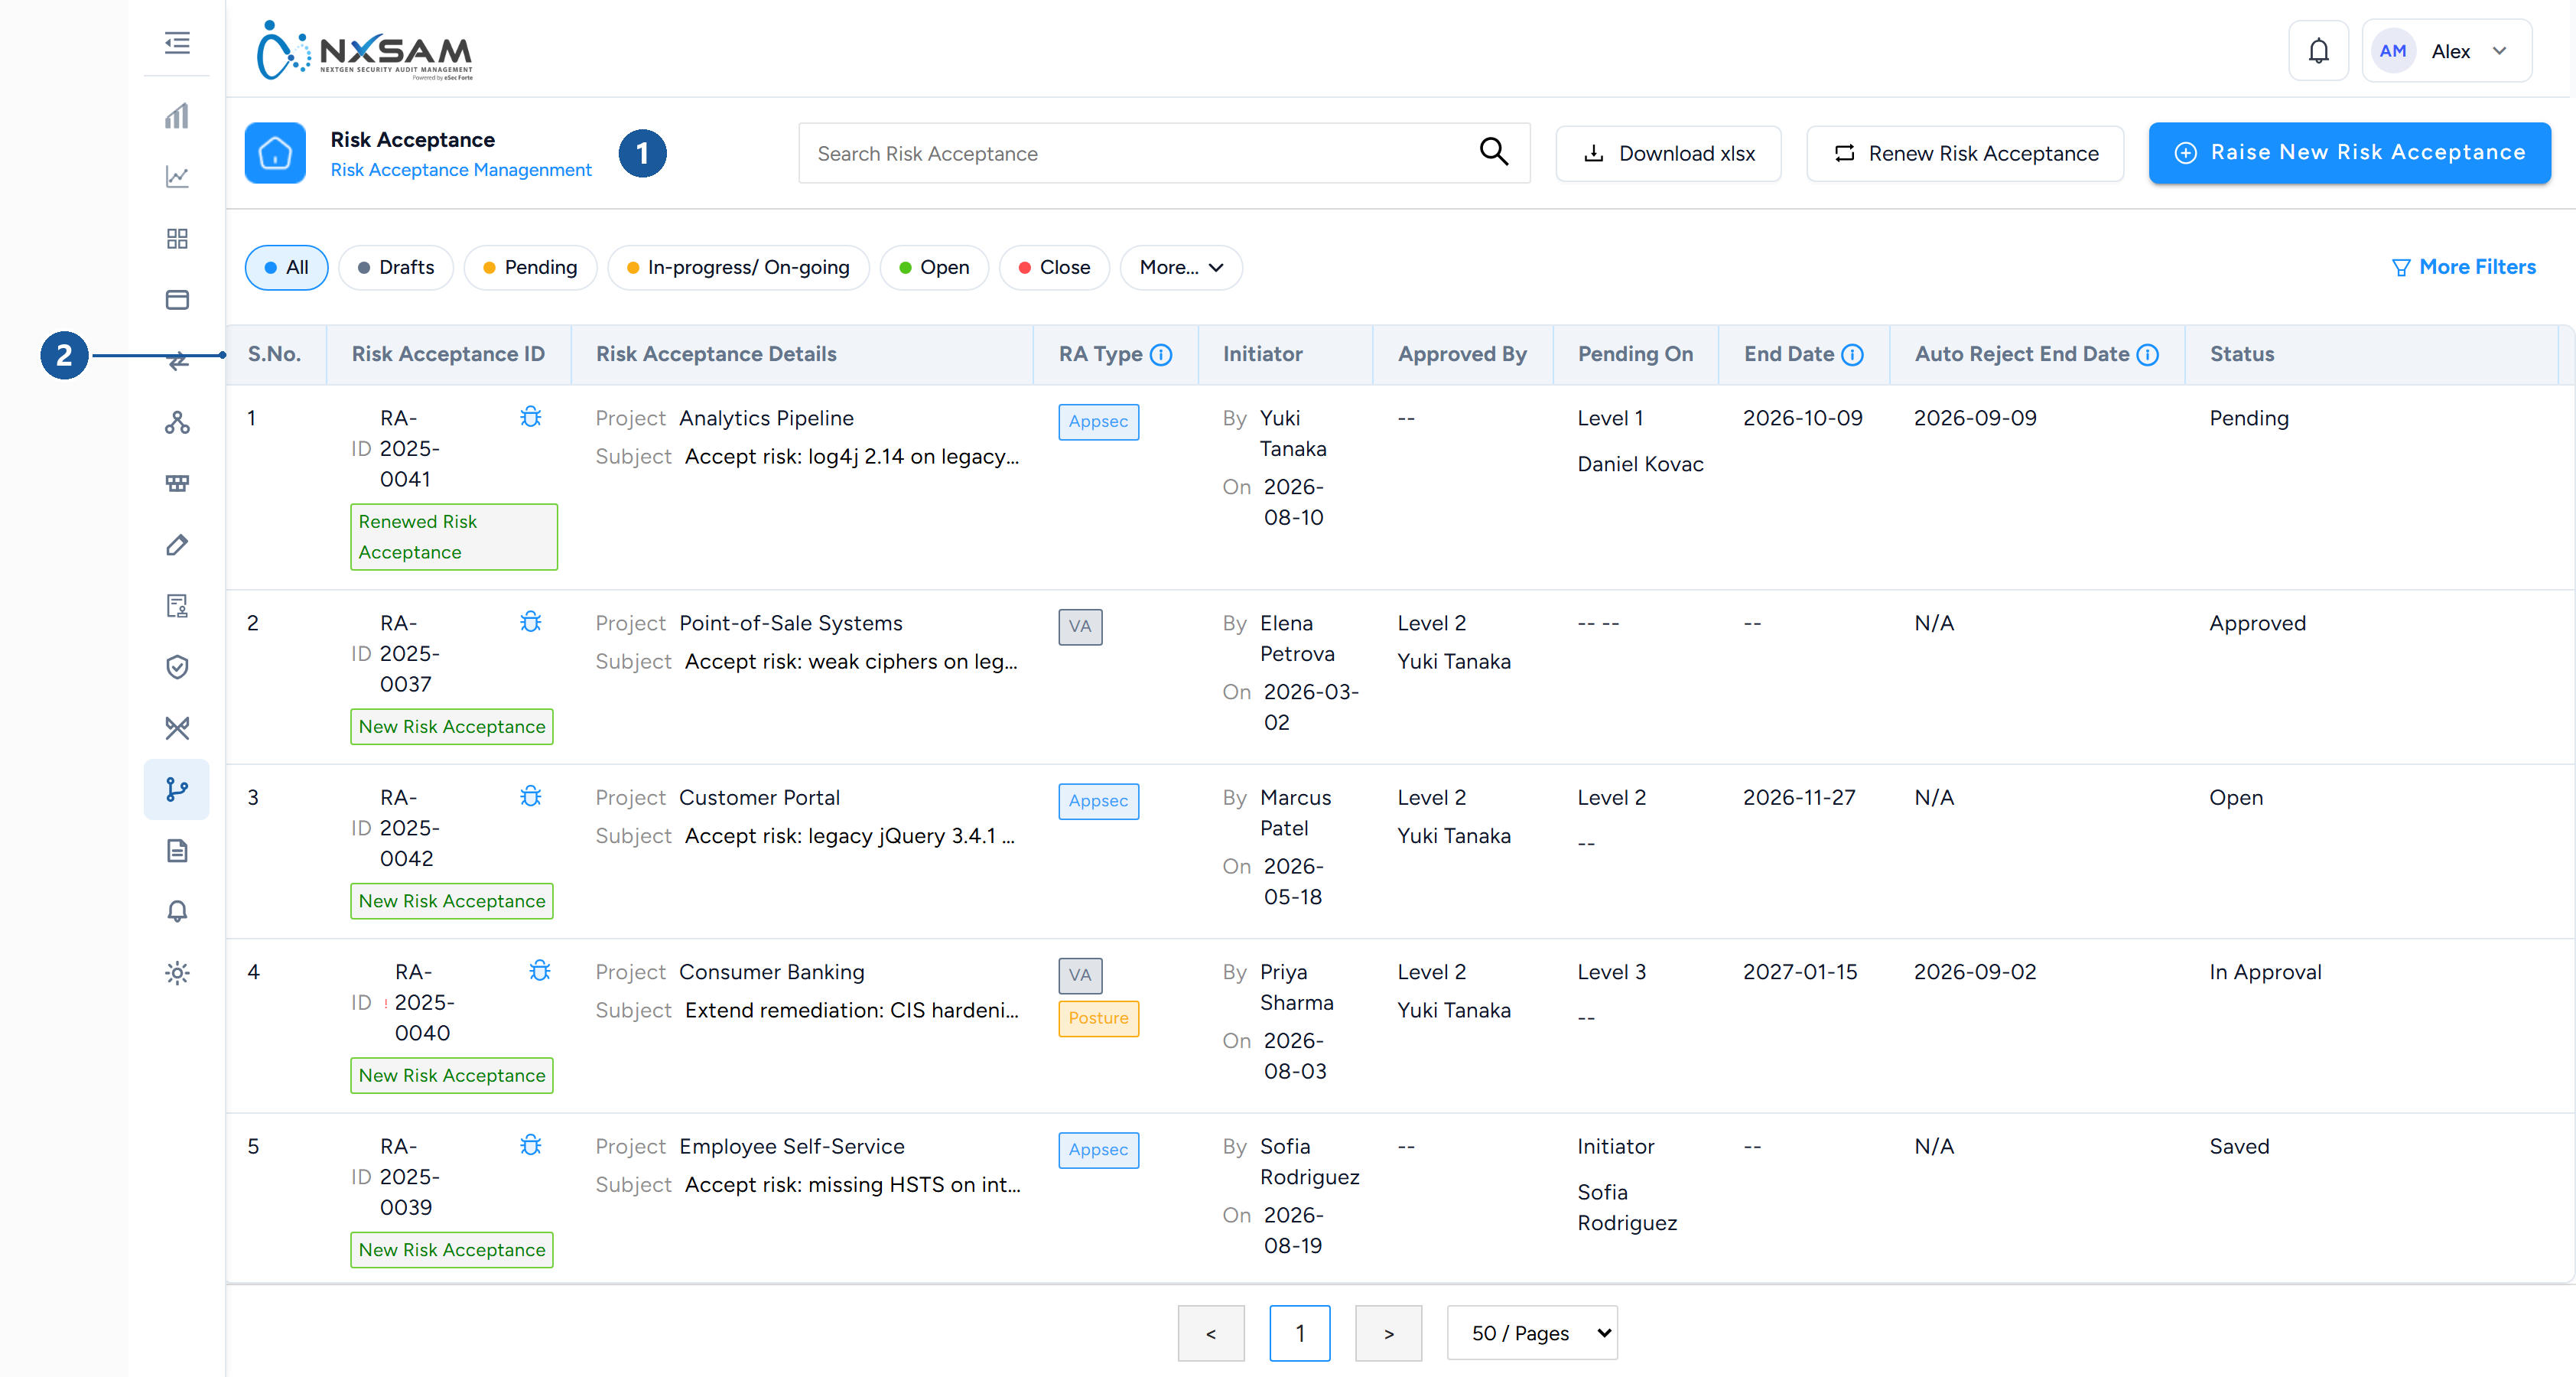
1 where you are · 2 approval state and expiry
| Screen | Shows |
|---|---|
| Deviation Management | All deviations and their current state |
| Validated Vulnerabilities | Findings with an approved, still-valid deviation |
| Expired Vulnerabilities | Findings whose deviation has lapsed and now need attention |
The Expired list is the one worth reviewing on a schedule. Items land there without anyone doing anything — the date simply passes — so nothing prompts you unless you look.
Configuration
Two settings shape how deviations behave:
- Approval configuration — who must approve, usually by severity.
- Designation configuration — which roles may request and which may approve.
Both are administrative settings. Changing them affects future requests, not decisions already made.
Request a deviation
Use this when a vulnerability genuinely cannot be fixed within its SLA — the fix needs a vendor release, a change freeze is in force, or the remediation carries more risk than the finding does.
Before you raise one
Be able to answer three questions. An approver will ask all of them.
- Why can it not be fixed now? A specific reason, not "no capacity".
- What reduces the risk meanwhile? Compensating controls — restricted access, additional monitoring, network segmentation.
- When will it be fixed? A date you can defend, not an open-ended extension.
Raising the request
- Open the vulnerability.
- Choose the option to request a deviation or risk acceptance.
- Complete:
- Justification — the answers to the three questions above.
- Valid until — the date the acceptance should lapse.
- Compensating controls — what is in place meanwhile.
- Submit.
The request routes to an approver automatically, based on severity. More severe findings require more senior approval.
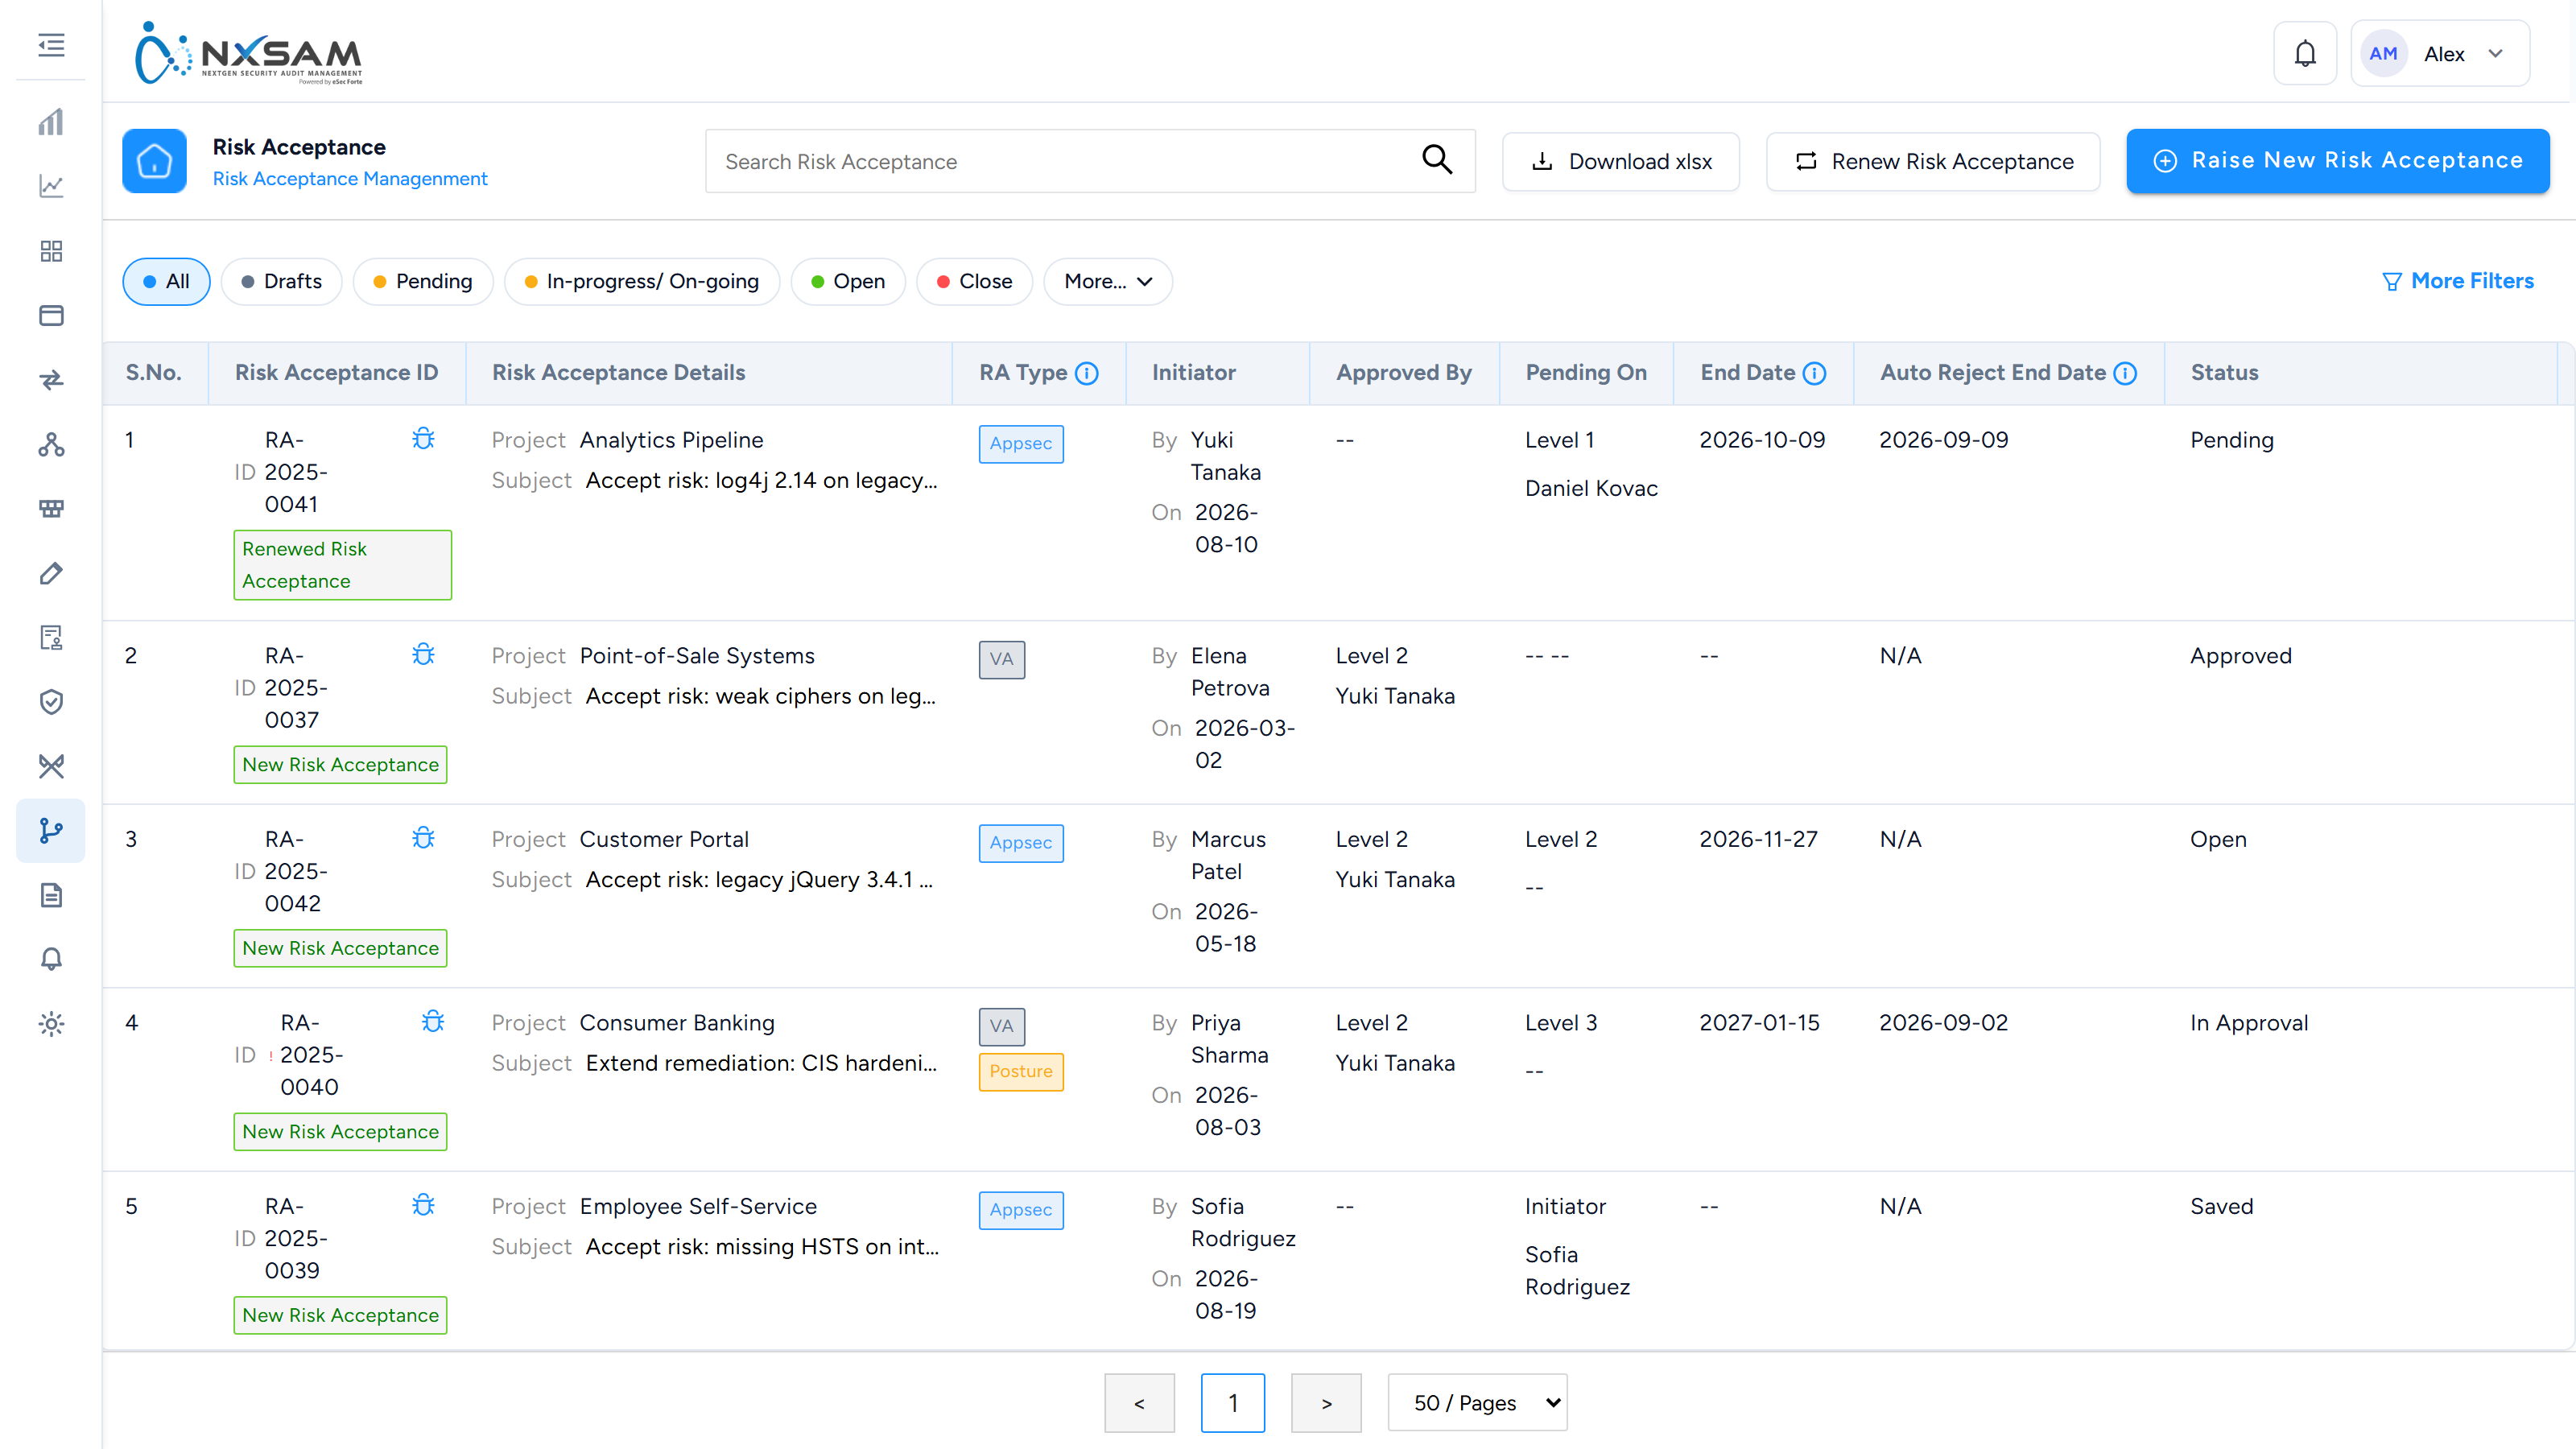
Which approver a request reaches is not decided per request: it follows the designation and approval-level configuration held under Deviation Management.
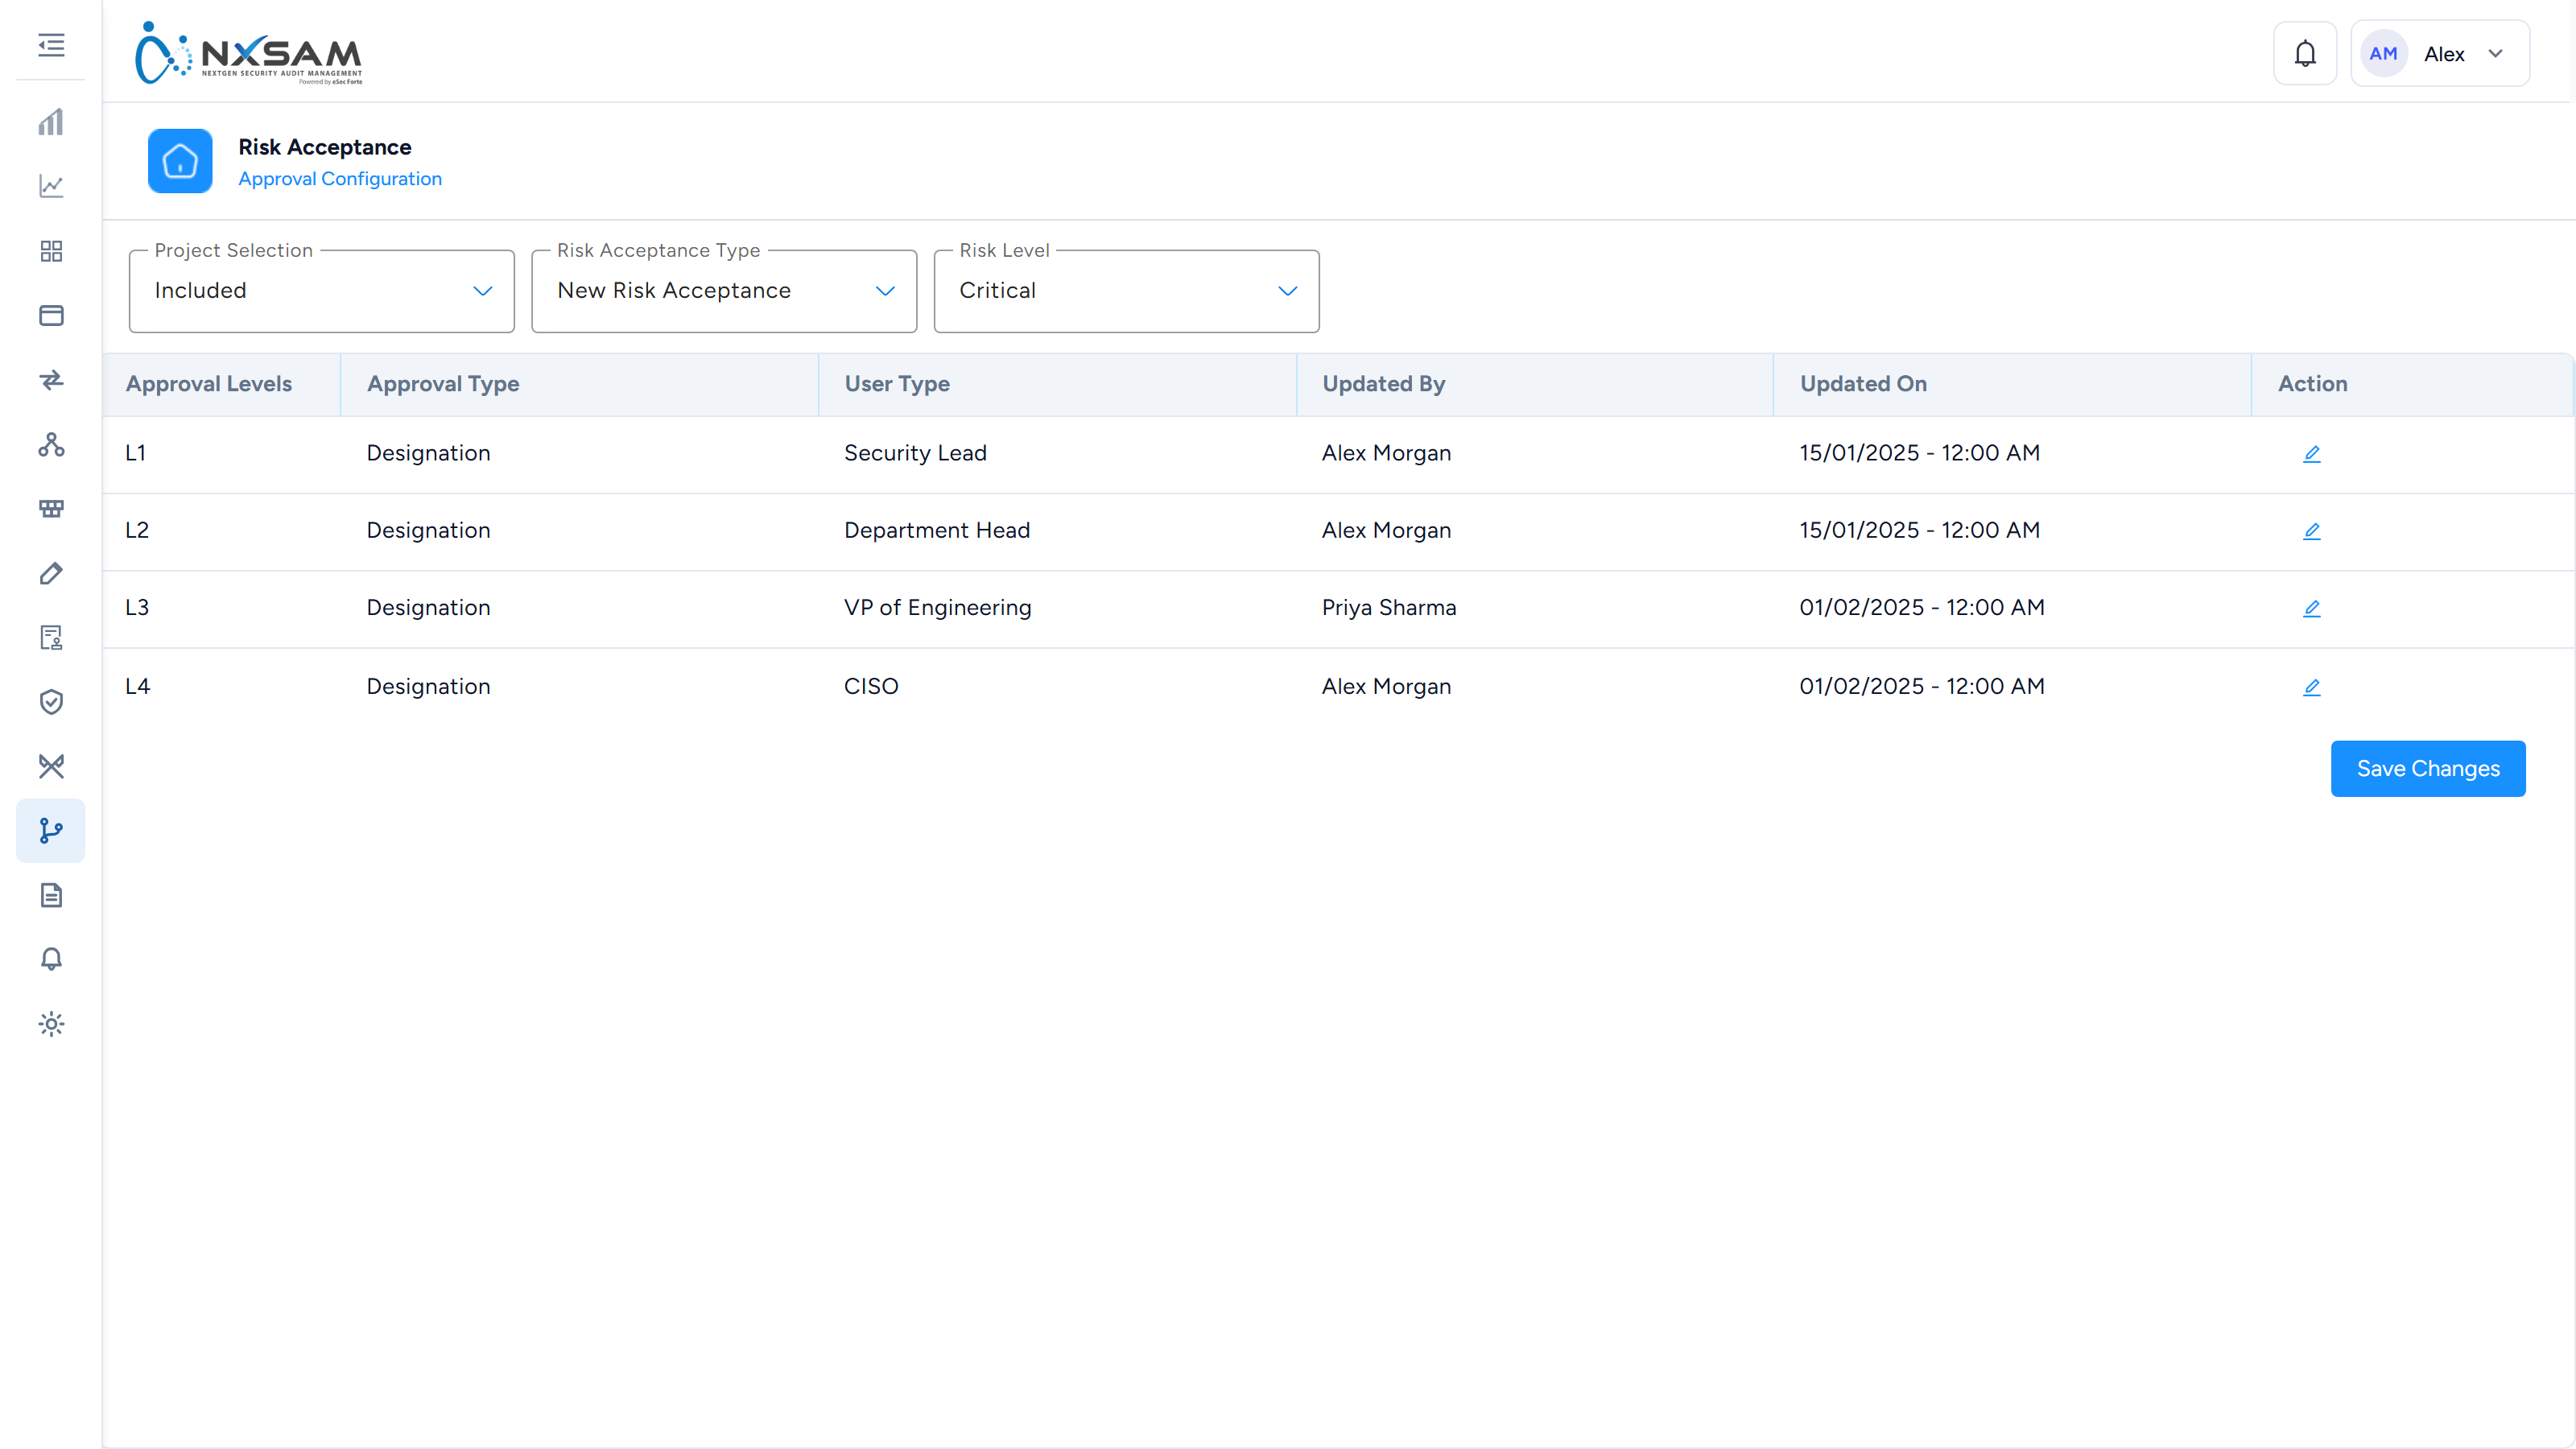
After submitting
| Outcome | What happens |
|---|---|
| Approved | The finding is covered until the end date |
| Rejected | It returns to normal tracking; remediate it |
| Expired | The end date has passed; it appears in the Expired list |
The vulnerability stays open throughout
A deviation does not close a finding or remove it from open counts. It records why nothing is being done yet. The weakness is still there, and NxSAM still reports it as an exposure.
This surprises people who expect an approved deviation to clear the number. It does not, deliberately.
When it expires
Nothing prompts you. The date passes and the finding appears in Expired Vulnerabilities.
You then either:
- Remediate it — the intended outcome, and the reason the deviation was time-limited.
- Renew it — if circumstances genuinely have not changed. Renewal is a fresh request with a fresh end date and fresh approval, not an extension.
Review the Expired list on a schedule. Items arrive there without anyone acting, so nothing draws attention to them.
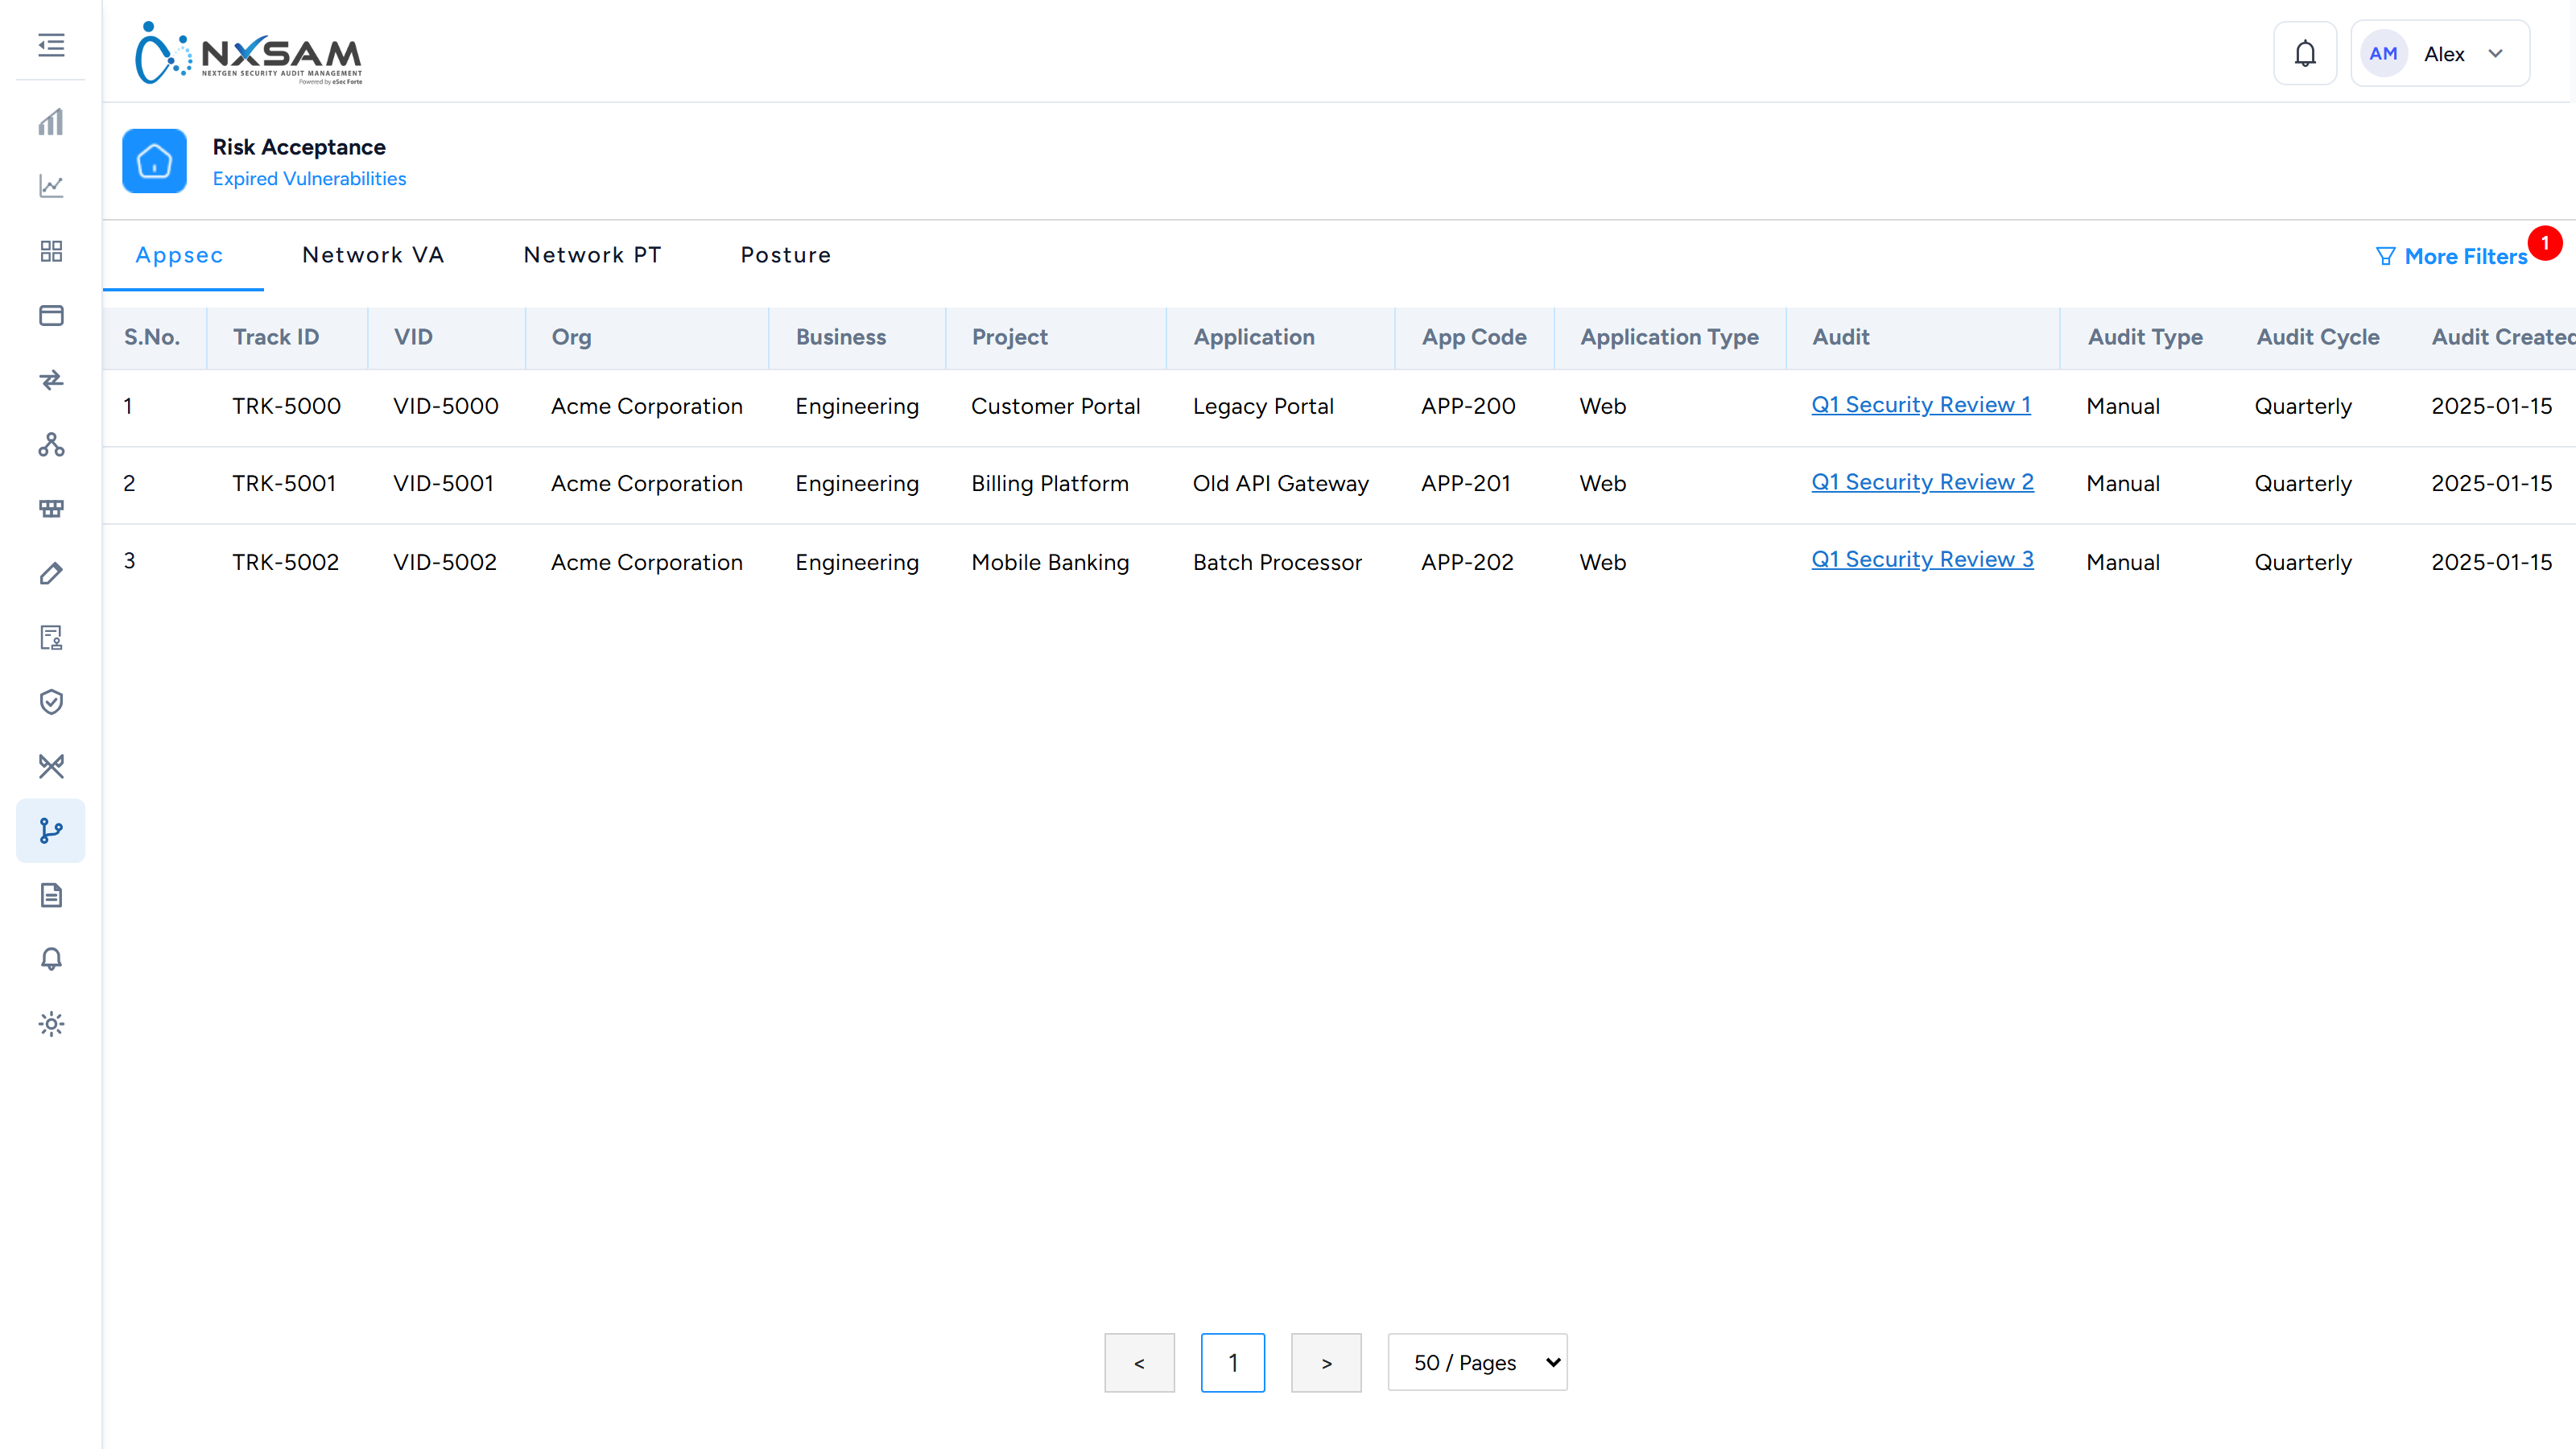
Good practice
- Keep periods short. A three-month deviation reviewed on time is better governance than a two-year one nobody revisits.
- Be specific in the justification. It will be read by an auditor eventually, possibly long after everyone involved has forgotten the context.
- Do not use deviations for false positives. If the finding is not real, mark it a false positive. A deviation says "this is real and we accept it" — a materially different statement.
Deviations: every screen, column and action
A deviation is a decision not to fix something, recorded with an approval chain and an expiry. The module is mostly about who agreed and until when.
The deviation list
| Column | What it holds |
|---|---|
| Risk Acceptance ID | The request identifier |
| Risk Acceptance Details | Subject and reason |
| RA Type | Which vulnerability types the acceptance covers — AppSec, VA, PT, Posture or RLCM |
| Initiator | Who raised it |
| Approved By | Who has approved so far |
| Pending On | Whose approval it is waiting for |
| End Date | When the acceptance expires |
Row actions
View History, Update Initiator, Delete Risk Acceptance.
Update Initiator exists because acceptances outlive people. When the person who raised one leaves, the request would otherwise be pending on an account nobody uses — this reassigns it without restarting the approval chain.
RA Type spans modules, which is why the module sits outside them
One acceptance can cover AppSec, VA, PT, Posture and RLCM findings together. That is deliberate: a decision to accept a risk is usually about a system, not about which scanner happened to find it.
It also means a finding can be under an acceptance raised from a module you are not looking at, which is the usual reason a finding shows as accepted with no visible acceptance in its own module.
Approval configuration
| Screen | Columns |
|---|---|
| Approval levels | Approval Levels, Approval Type, User Type, Updated By, Updated On |
| Approver configuration | Approval Levels, User Type, Approver Name, Status, Updated On, Comments |
| Designations | Designation Type, Users, Created By, Created On |
Approval is by level, and each level is satisfied by a user type or designation rather than by a named person. That is what lets the chain survive staff changes: a level requiring "Head of Infrastructure" is satisfied by whoever currently holds it.
Comments on the approver configuration record why a level was added or changed, which matters when an auditor asks who authorised the authorisation structure.
Deviation properties
Property Name, Property Type, Mandatory, Info Hint, Sequence, Created By.
Info Hint is the help text shown beside the field when someone raises a request. It is the cheapest place in the product to prevent bad requests — a mandatory "compensating control" field with a hint explaining what counts as one produces usable answers, and without the hint produces "N/A".
Raising a deviation
The request form lists the findings being accepted:
| Column | What it holds |
|---|---|
| vulVid | The finding's identifier |
| Observation | What was found |
| Recommendation | What was advised |
| Vulnerability Name and Status | The finding and its status at the time the deviation was raised |
| Audit Name | Where it came from |
| Asset Name | What it affects |
The status shown is historical, not current
The product states this on the screen itself: the status is the state of the
vulnerability when the deviation was raised. A finding accepted while New still
reads New on the acceptance months later, even if it has since moved.
Read the finding's own screen for its current state. Reading the acceptance instead is the most common misinterpretation in this module.
Generate PDF Report produces the acceptance as a document — the artefact an auditor asks for, showing what was accepted, by whom, on what grounds and until when.
Bulk upload
Accepts CSV or XLSX, and covers APPSEC / VA / PT / POSTURE or RLCM — the two groups are uploaded separately because their identifiers differ.
The queue reports Status, Initiated By, Uploaded At, Download and Log File
Download. The log is the per-row outcome; a bulk upload that accepted fewer findings than
expected explains itself there.
Validated and expired vulnerabilities
Both tables carry the full provenance of each finding:
Track ID, VID, Org, Business, Project, Application, App Code,
Application Type, Audit, Audit Type, Audit Cycle, Audit Created On,
Audit Completed On, Audit First Reported On, Vulnerability Name, Severity,
Risk Acceptance Expiry Date, Expired On.
Risk Acceptance Expiry Date is the date the acceptance runs out — it was labelled Risk Acceptance Date in earlier releases, which read as the date it was granted. The value is unchanged; only the label is, and it now says what it always meant. Reports and the health-check rules that test it use the same wording.
Because an acceptance can cover findings from any module, the tables also carry the identifiers each module uses:
| Column | Applies to |
|---|---|
| Tools | Which scanner reported the finding |
| QID / NEXPOSE ID / NESSUS ID | The scanner's own identifier — Qualys QID, Nexpose or Nessus id |
| Host, Port, Protocol | Network findings, where the acceptance is per service rather than per machine |
| Category | The finding's classification |
| Policy Name, Control Name | Policy Compliance findings, where the acceptance is against a control |
The scanner identifier is what makes an acceptance verifiable. An auditor checking that an accepted finding is the one described will look it up by QID or plugin id in the scanner, not by the title — titles get rewritten, identifiers do not.
Audit First Reported On is the one that matters for an expiry dispute. It is when the finding was first raised, which may be several audits before the acceptance — so an acceptance expiring after six months can cover a finding that has been open for two years.
The expired list is the module's most actionable screen: those acceptances have lapsed, so the findings are open again and, unless someone is watching this list, nobody has been told.
Vulnerability status history
Audit ID, Audit Name, Severity, Vulnerability Status, Sub Status, Created On,
Status Changed By.
Sub Status carries the qualifier beneath the main status — which kind of acceptance,
or which stage of an approval. Two findings both reading Risk accepted can differ in sub
status, and that is what distinguishes a permanent acceptance from a temporary one.
Vulnerability summary
Assets, Critical, High, Medium, Low, Info — what an acceptance covers, at a
glance, before approving it. An approver looking at a request for forty findings across
twelve assets is being asked a different question from one looking at a single Low.
Deviations: counting rules and expiry behaviour
1. An accepted risk is still an open finding
Worth restating here because it is asked constantly, and because the platform's own status list makes it look otherwise.
Risk accepted is not flagged as a closed type in the status master. A vulnerability under an approved, in-date deviation therefore:
- continues to count as open,
- continues to appear in open totals and severity breakdowns,
- and continues to age.
Customers frequently expect an approved deviation to remove the finding from their open figures. It does not, and that is deliberate — an accepted risk is still an exposure. See the platform-wide counting rules for the full status table.
2. Expiry is a date passing, not an event
A deviation is expired when its acceptance date has passed — recorded as the acceptance's expiry date on the vulnerability. Nothing runs to "expire" it in a way a user would witness, and nobody is necessarily told.
Consequences:
- Items appear in the Expired list without any action. The date passed; that is all.
- Nobody is prompted. Unless your deployment has notification configured, an expired deviation waits to be noticed. The Expired list needs reviewing on a schedule.
- Expiry does not change the vulnerability's status. The finding does not reopen — it was never closed. It simply stops being covered.
3. Renewal is a new decision, not an extension
Renewing an expired deviation creates a fresh acceptance with a fresh end date and goes through approval again. It does not extend the original.
This matters for audit trails: a finding accepted for three consecutive years shows three separate approvals, not one long one. That is the intended behaviour — each renewal is a point at which somebody consciously re-accepted the risk.
4. Approval routing is evaluated at request time
Which approver a request goes to is determined by the approval configuration when the request is raised. Changing the configuration afterwards does not re-route requests already in flight.
Support check: "we changed the approval matrix but requests are still going to the old approver" — check whether those requests predate the change. New requests will route correctly.
5. Two lists that look similar and are not
| List | Contains |
|---|---|
| Validated Vulnerabilities | Findings with an approved, still-valid deviation |
| Expired Vulnerabilities | Findings whose deviation has lapsed |
Neither list is "closed findings". Both contain open vulnerabilities. The names suggest resolution; the contents are exposures in different administrative states.
Triage order
- "Why is an accepted risk still in our open count?" → rule 1, by design
- "These expired without warning" → rule 2, expiry is a date passing
- "Why do we have three approvals for one finding?" → rule 3, renewals are separate
- "Approvals are going to the wrong person" → rule 4, check request dates
- "The Validated list isn't closed items" → rule 5, correct — both lists are open findings
Deviations & Risk Acceptance: find the right screen
Every screen in this module, what each one is for, and where it lives. Use it to find the right screen quickly, and to confirm you are on the one a colleague means — several screens in this product have similar names and different jobs.
Screenshots come from a demonstration data set, so the figures are illustrative. Click any screenshot to open it at full resolution.
Approver Designations
The roles that can approve, used to build the approval chain.
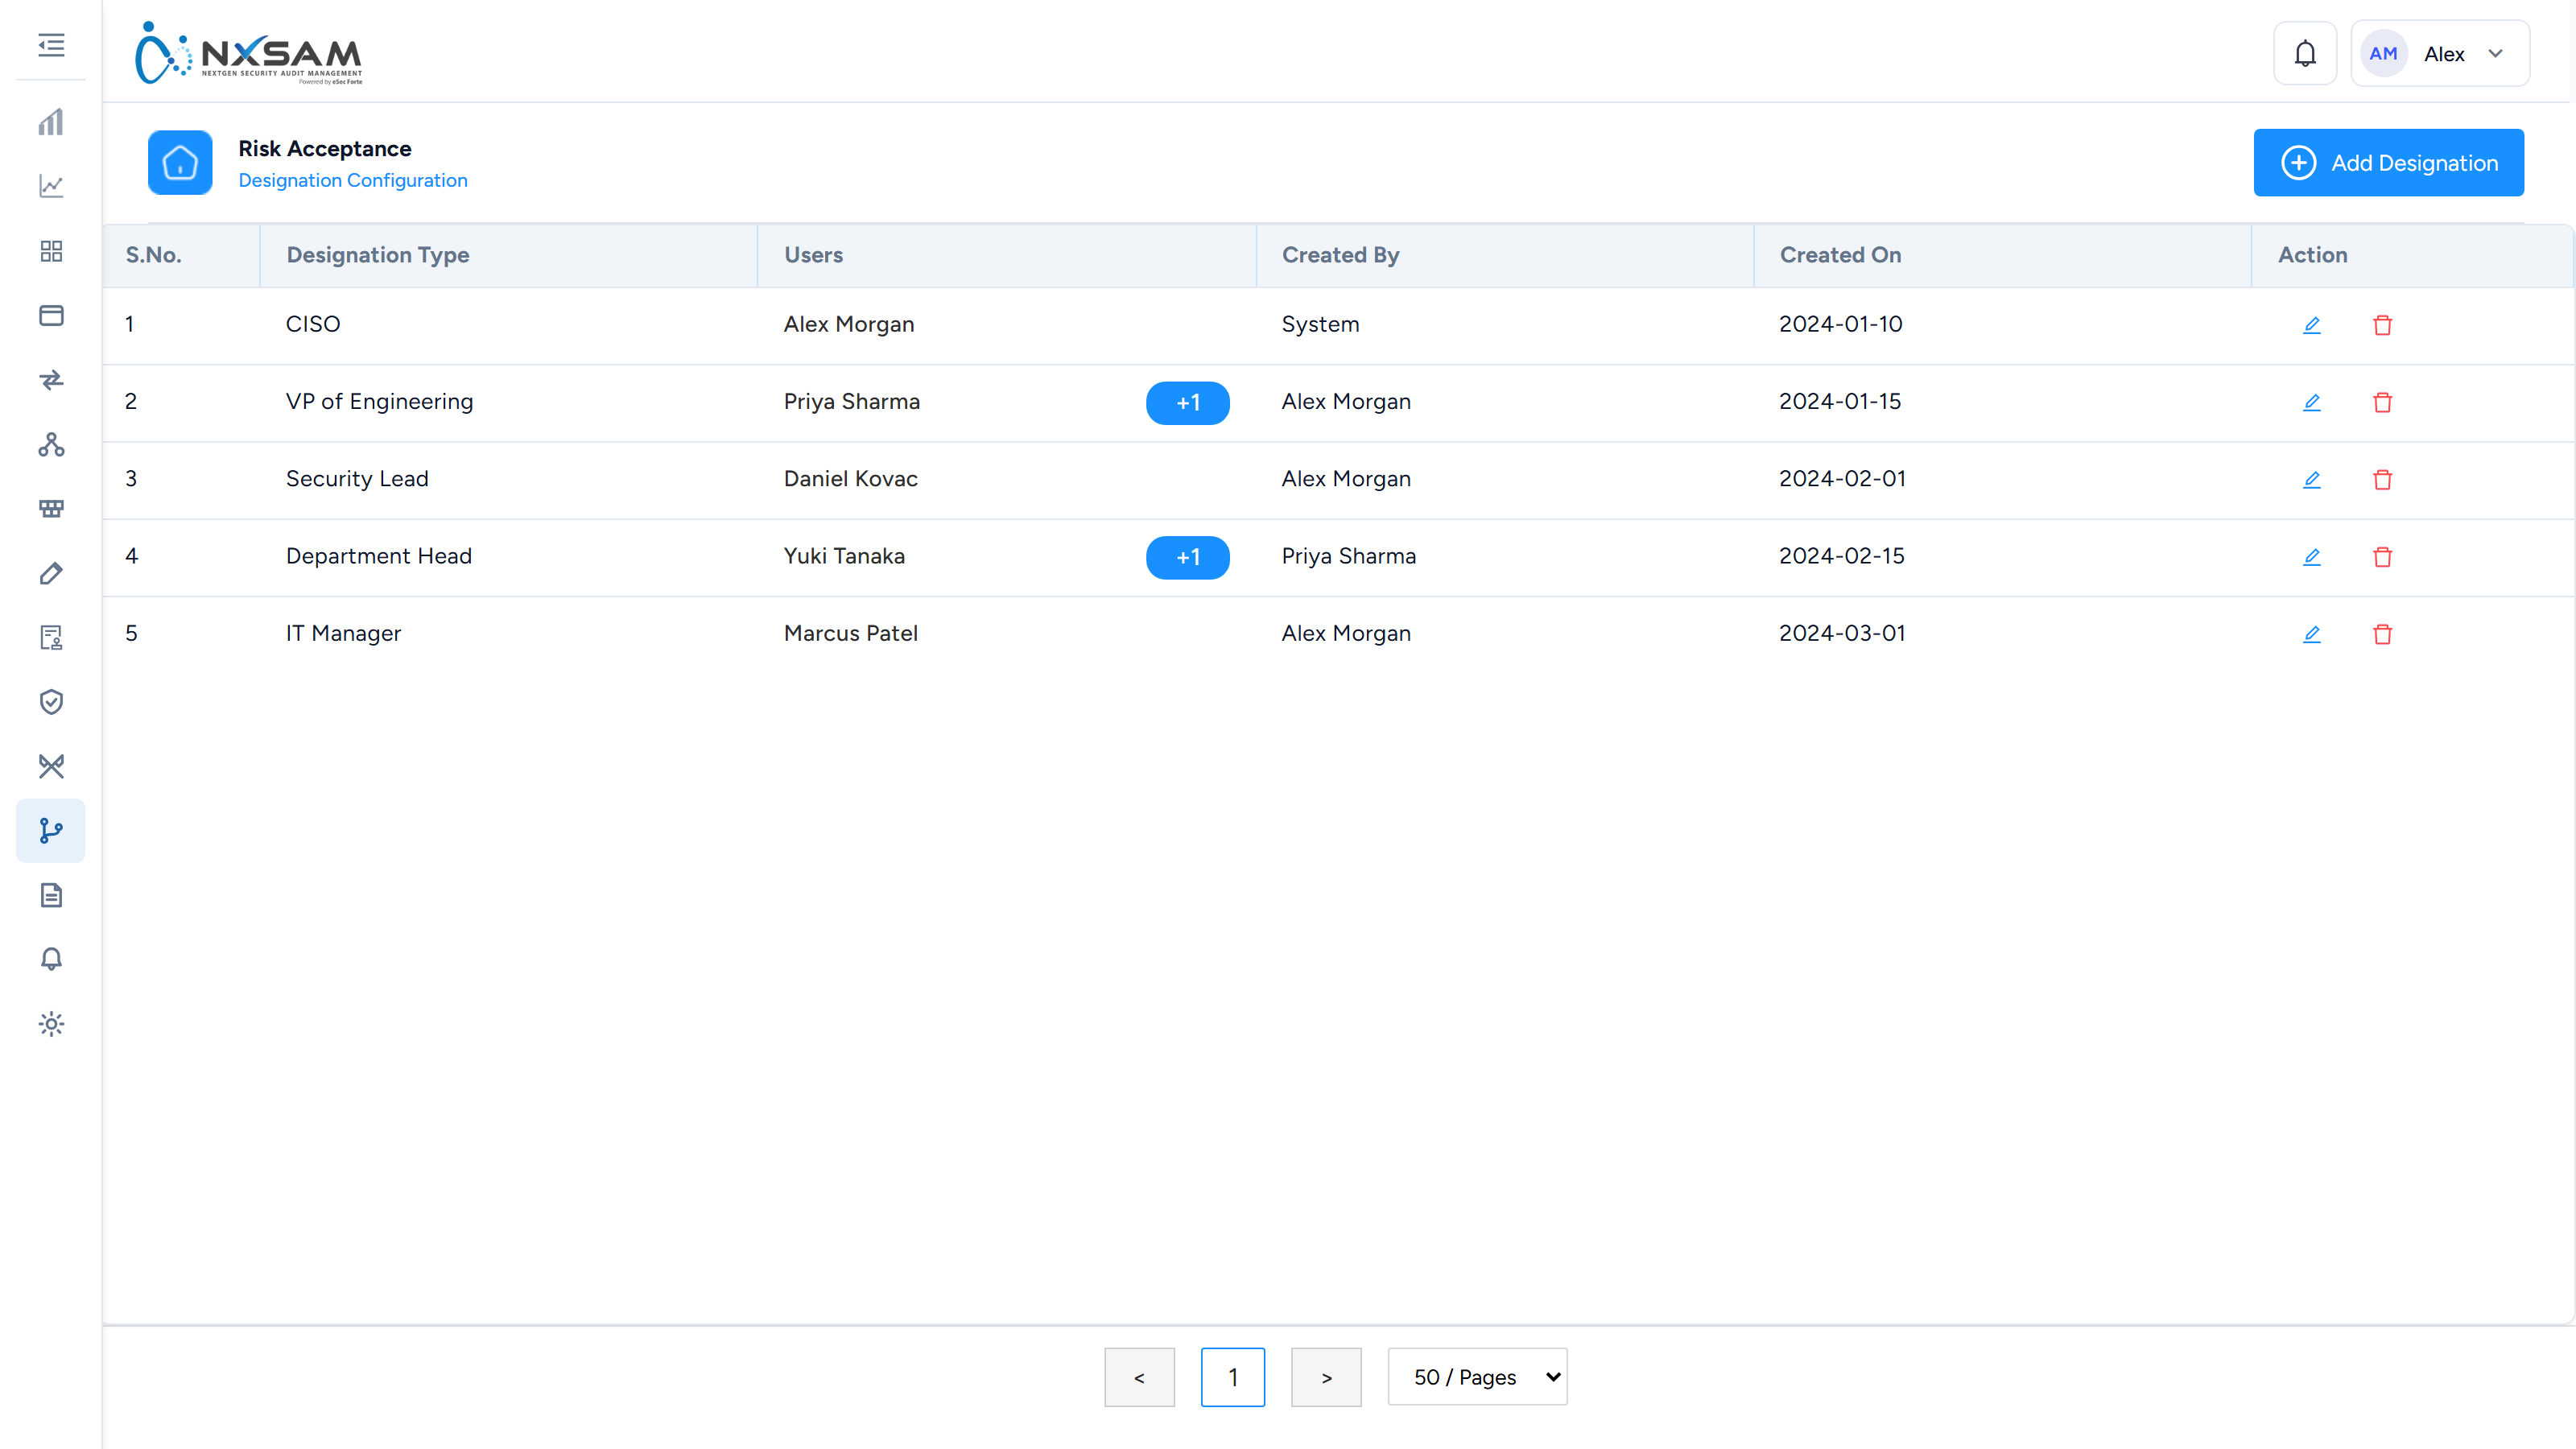
Deviation Properties
Additional fields captured on a deviation request, such as the compensating control.
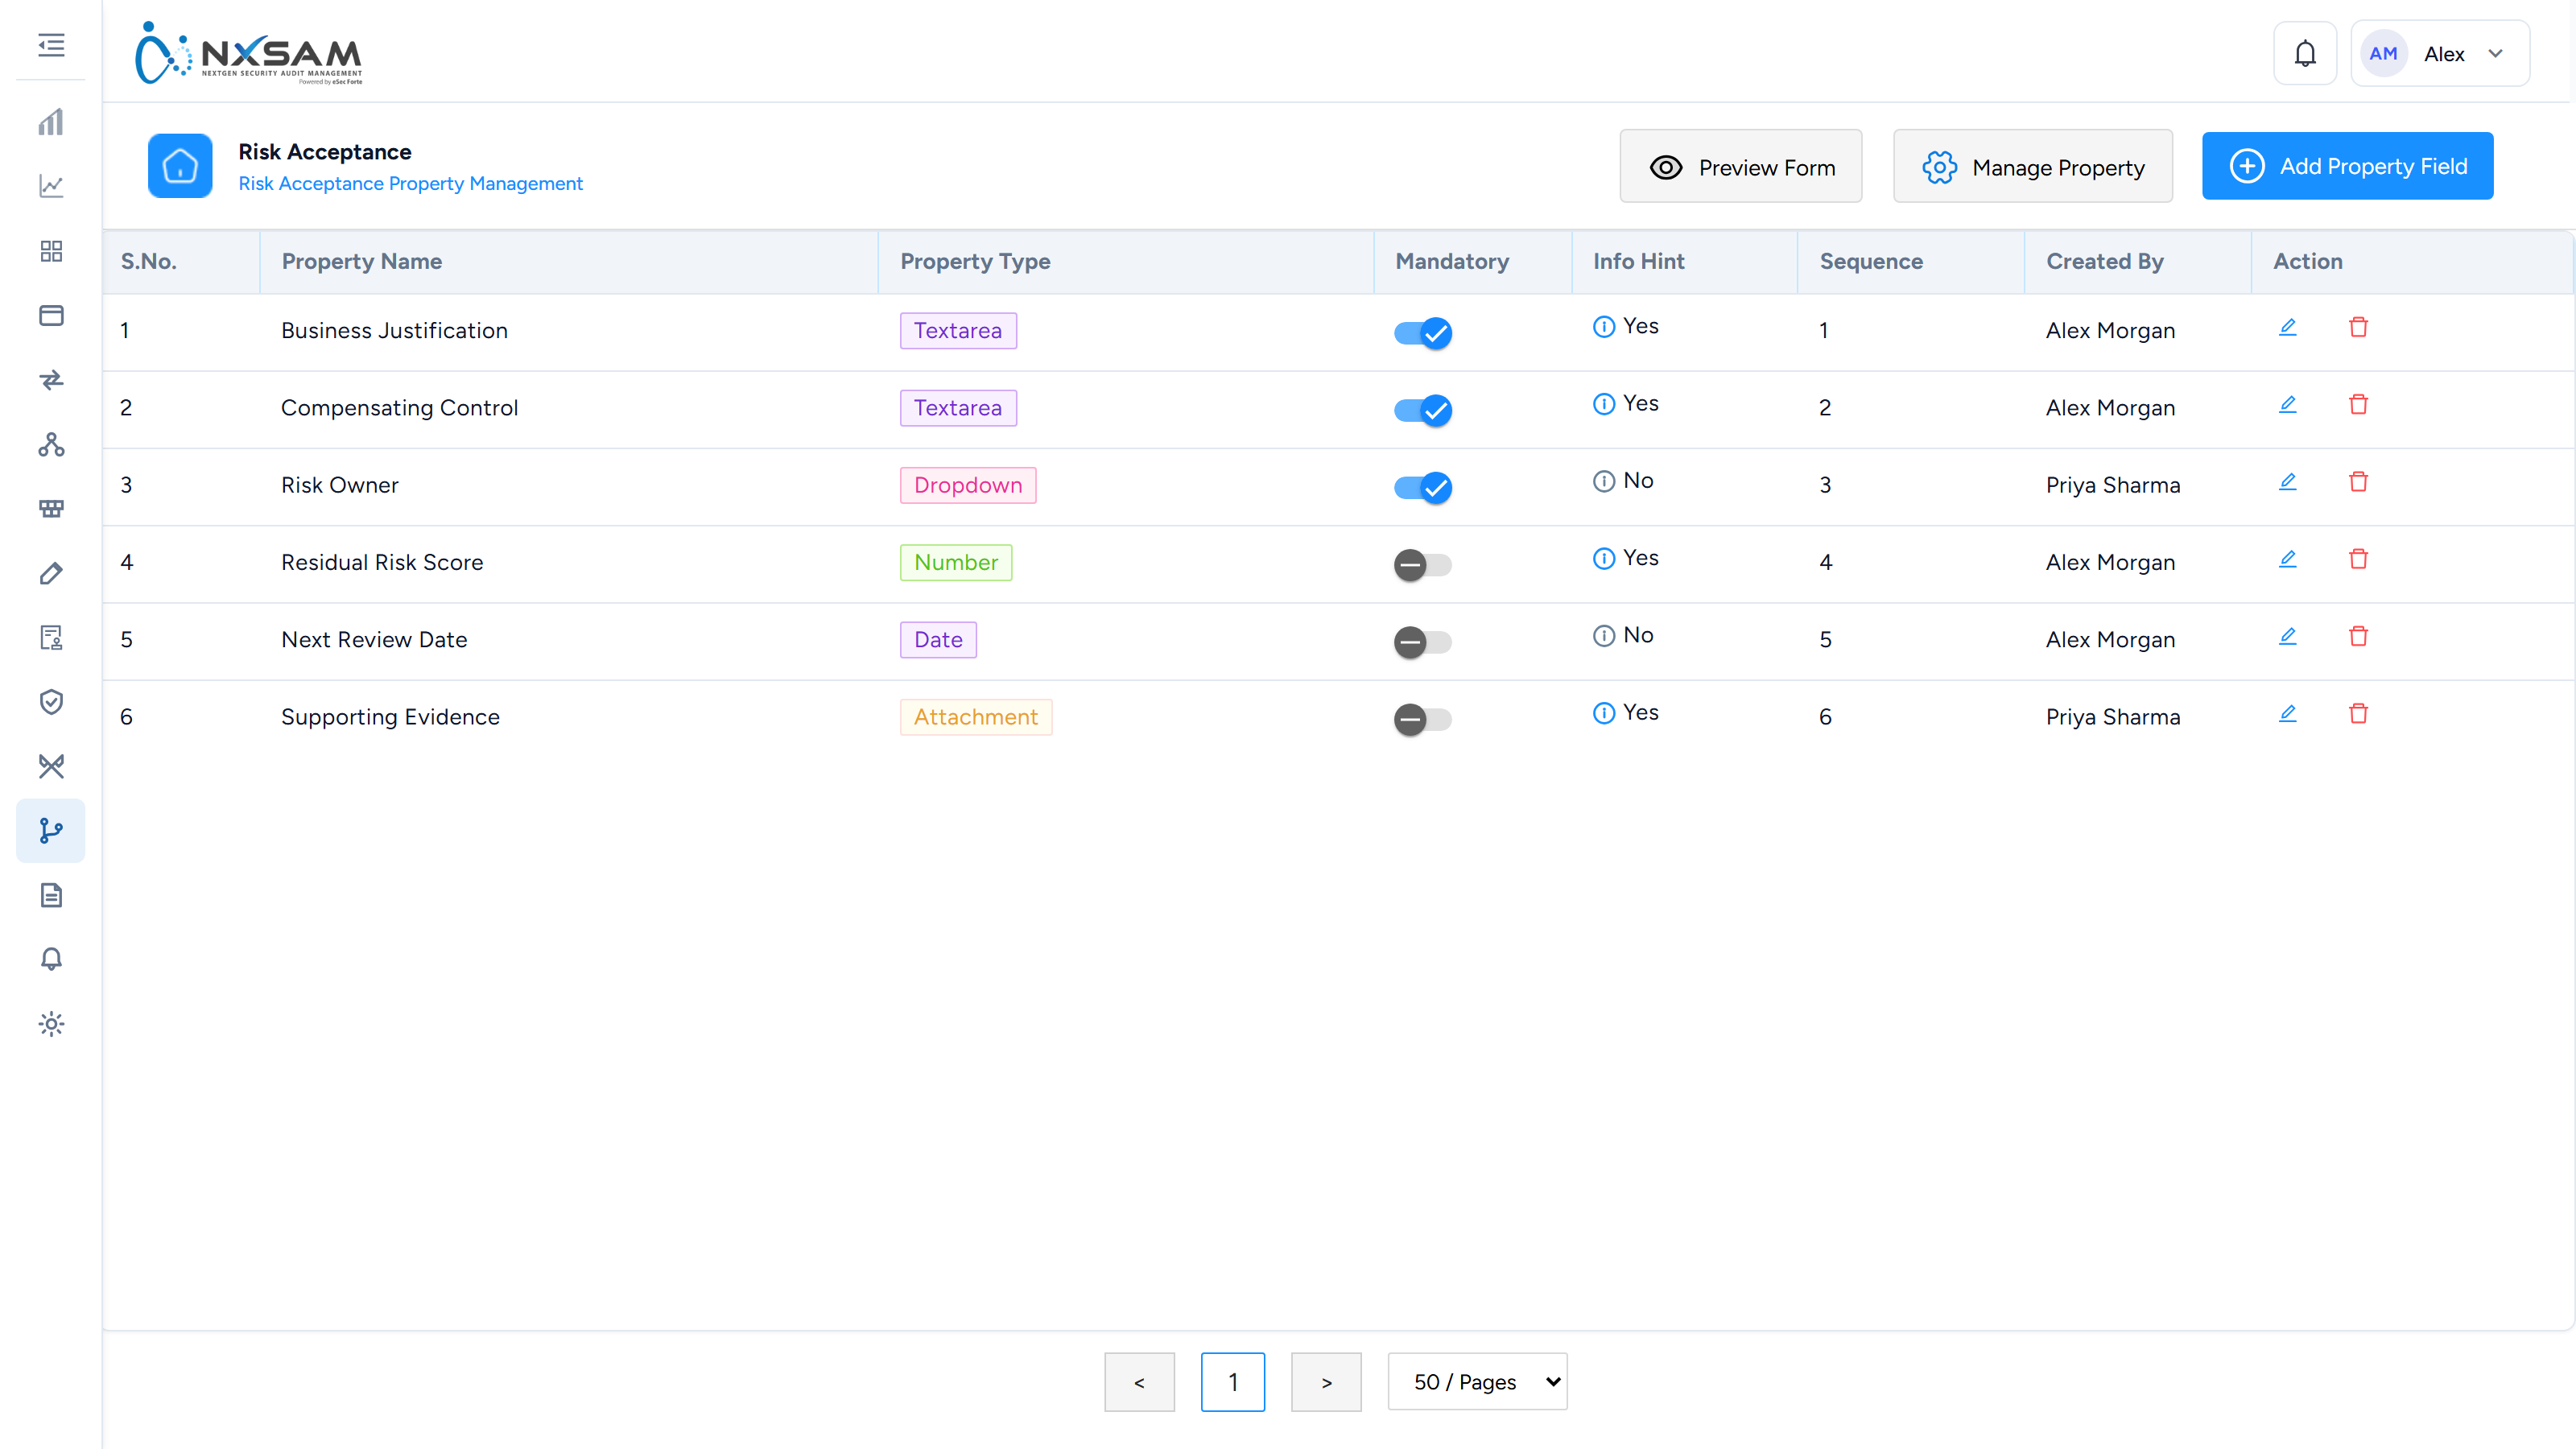
Validated Vulnerabilities
Findings covered by an accepted deviation, with the date that acceptance expires.
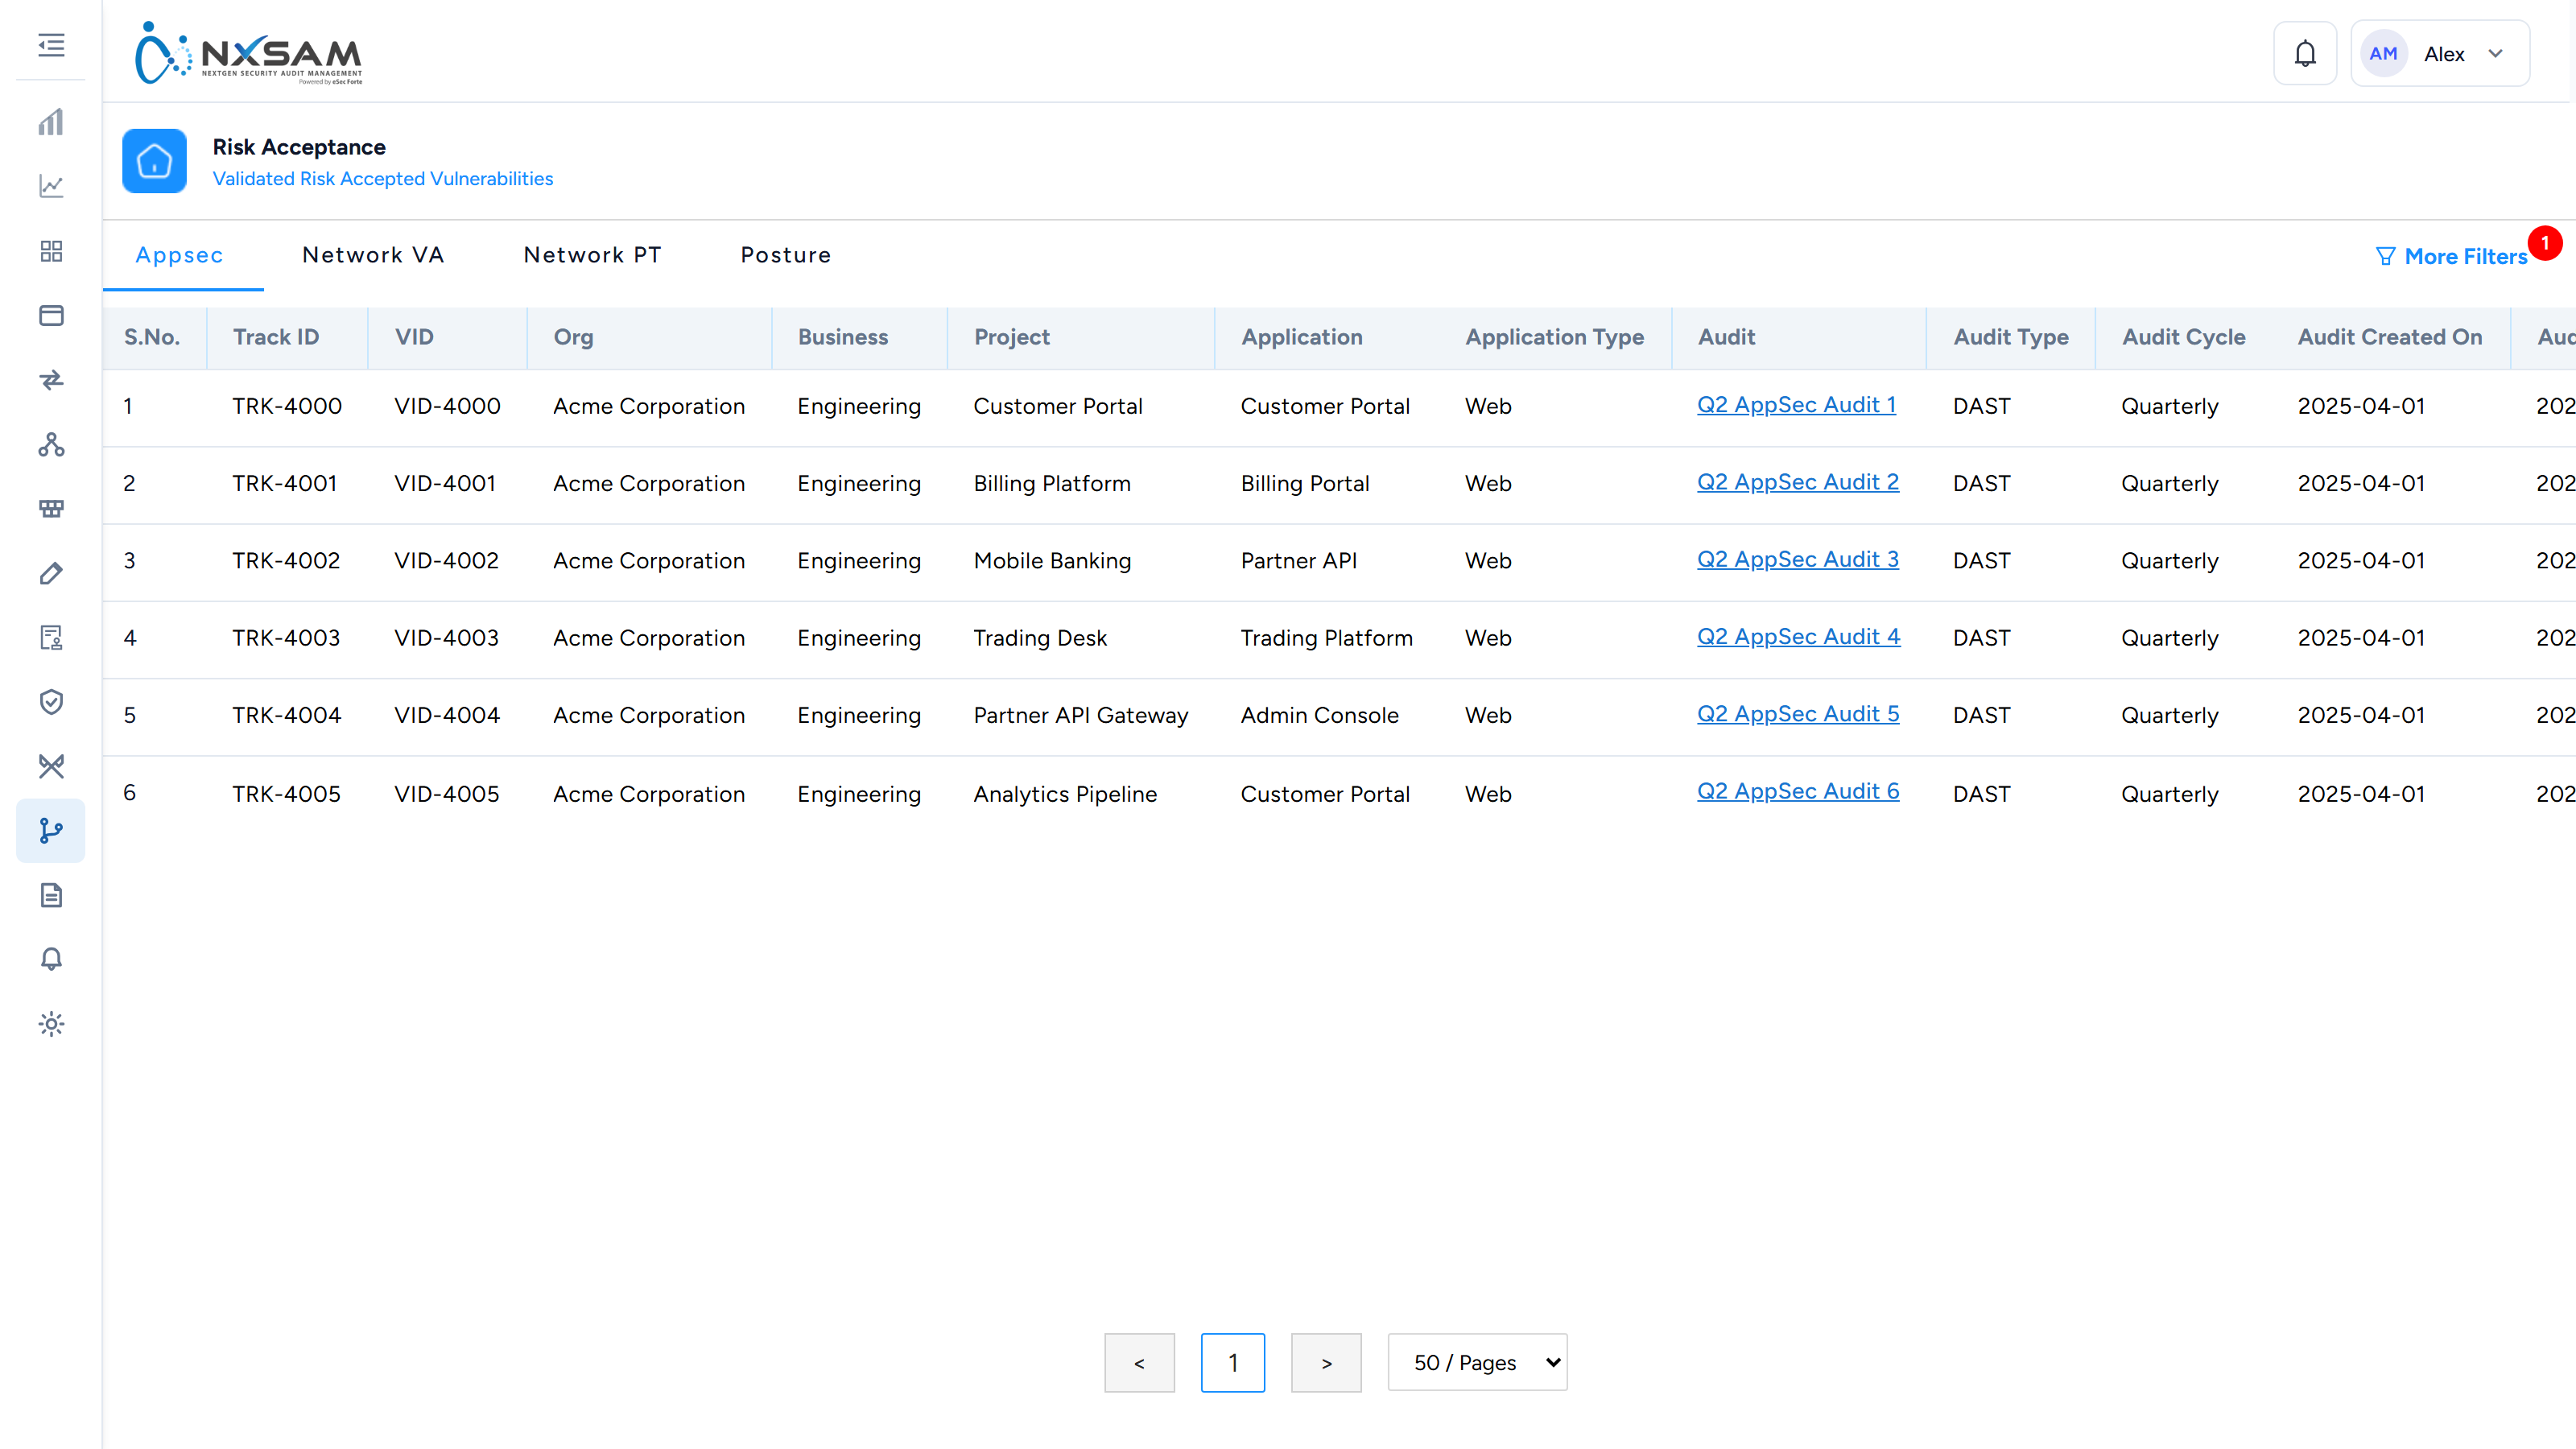
Reports
Reports
Reports turn what NxSAM holds into something you can send to someone who does not use NxSAM — a board, an auditor, a customer, a regulator.
The kinds of report
| Use it for | |
|---|---|
| Assessment reports | The findings of one audit, written up for the team that owns the application or infrastructure. |
| Overall vulnerabilities | Everything currently open across the estate, for management reporting. |
| Report templates | Reusable layouts so every report of a given kind looks the same. |
| Custom report templates | Your own structure, when the supplied layouts do not fit. |
| Report search | Finding a report generated earlier. |
How generating one works
- Choose the report and its scope — which audit, which assets, which period.
- Submit it. Generation happens in the background.
- The report appears in Reports Management when it is ready.
- Download it.
Reports are generated, not rendered on demand
A report is produced once and stored. It is a snapshot of the data at the moment it ran, which is what makes it valid to send to an auditor — it does not change after you have shared it.
The corollary is that a report does not update. If the data has moved on, generate a new one rather than expecting the old file to reflect it.
Why a report can differ from the screen
The single most common question about reports. Usually one of:
- Time. The report was generated earlier; the screen is live. SLA states in particular change as dates pass, with no data edit at all.
- Scope. The report covered one audit or one asset group; the screen is showing more, or less.
- Inclusion rules. Reports may exclude findings the screen includes — those awaiting approval, for instance.
Check the report's generation timestamp and scope before treating a difference as an error. Regenerating is the quickest way to confirm.
Templates
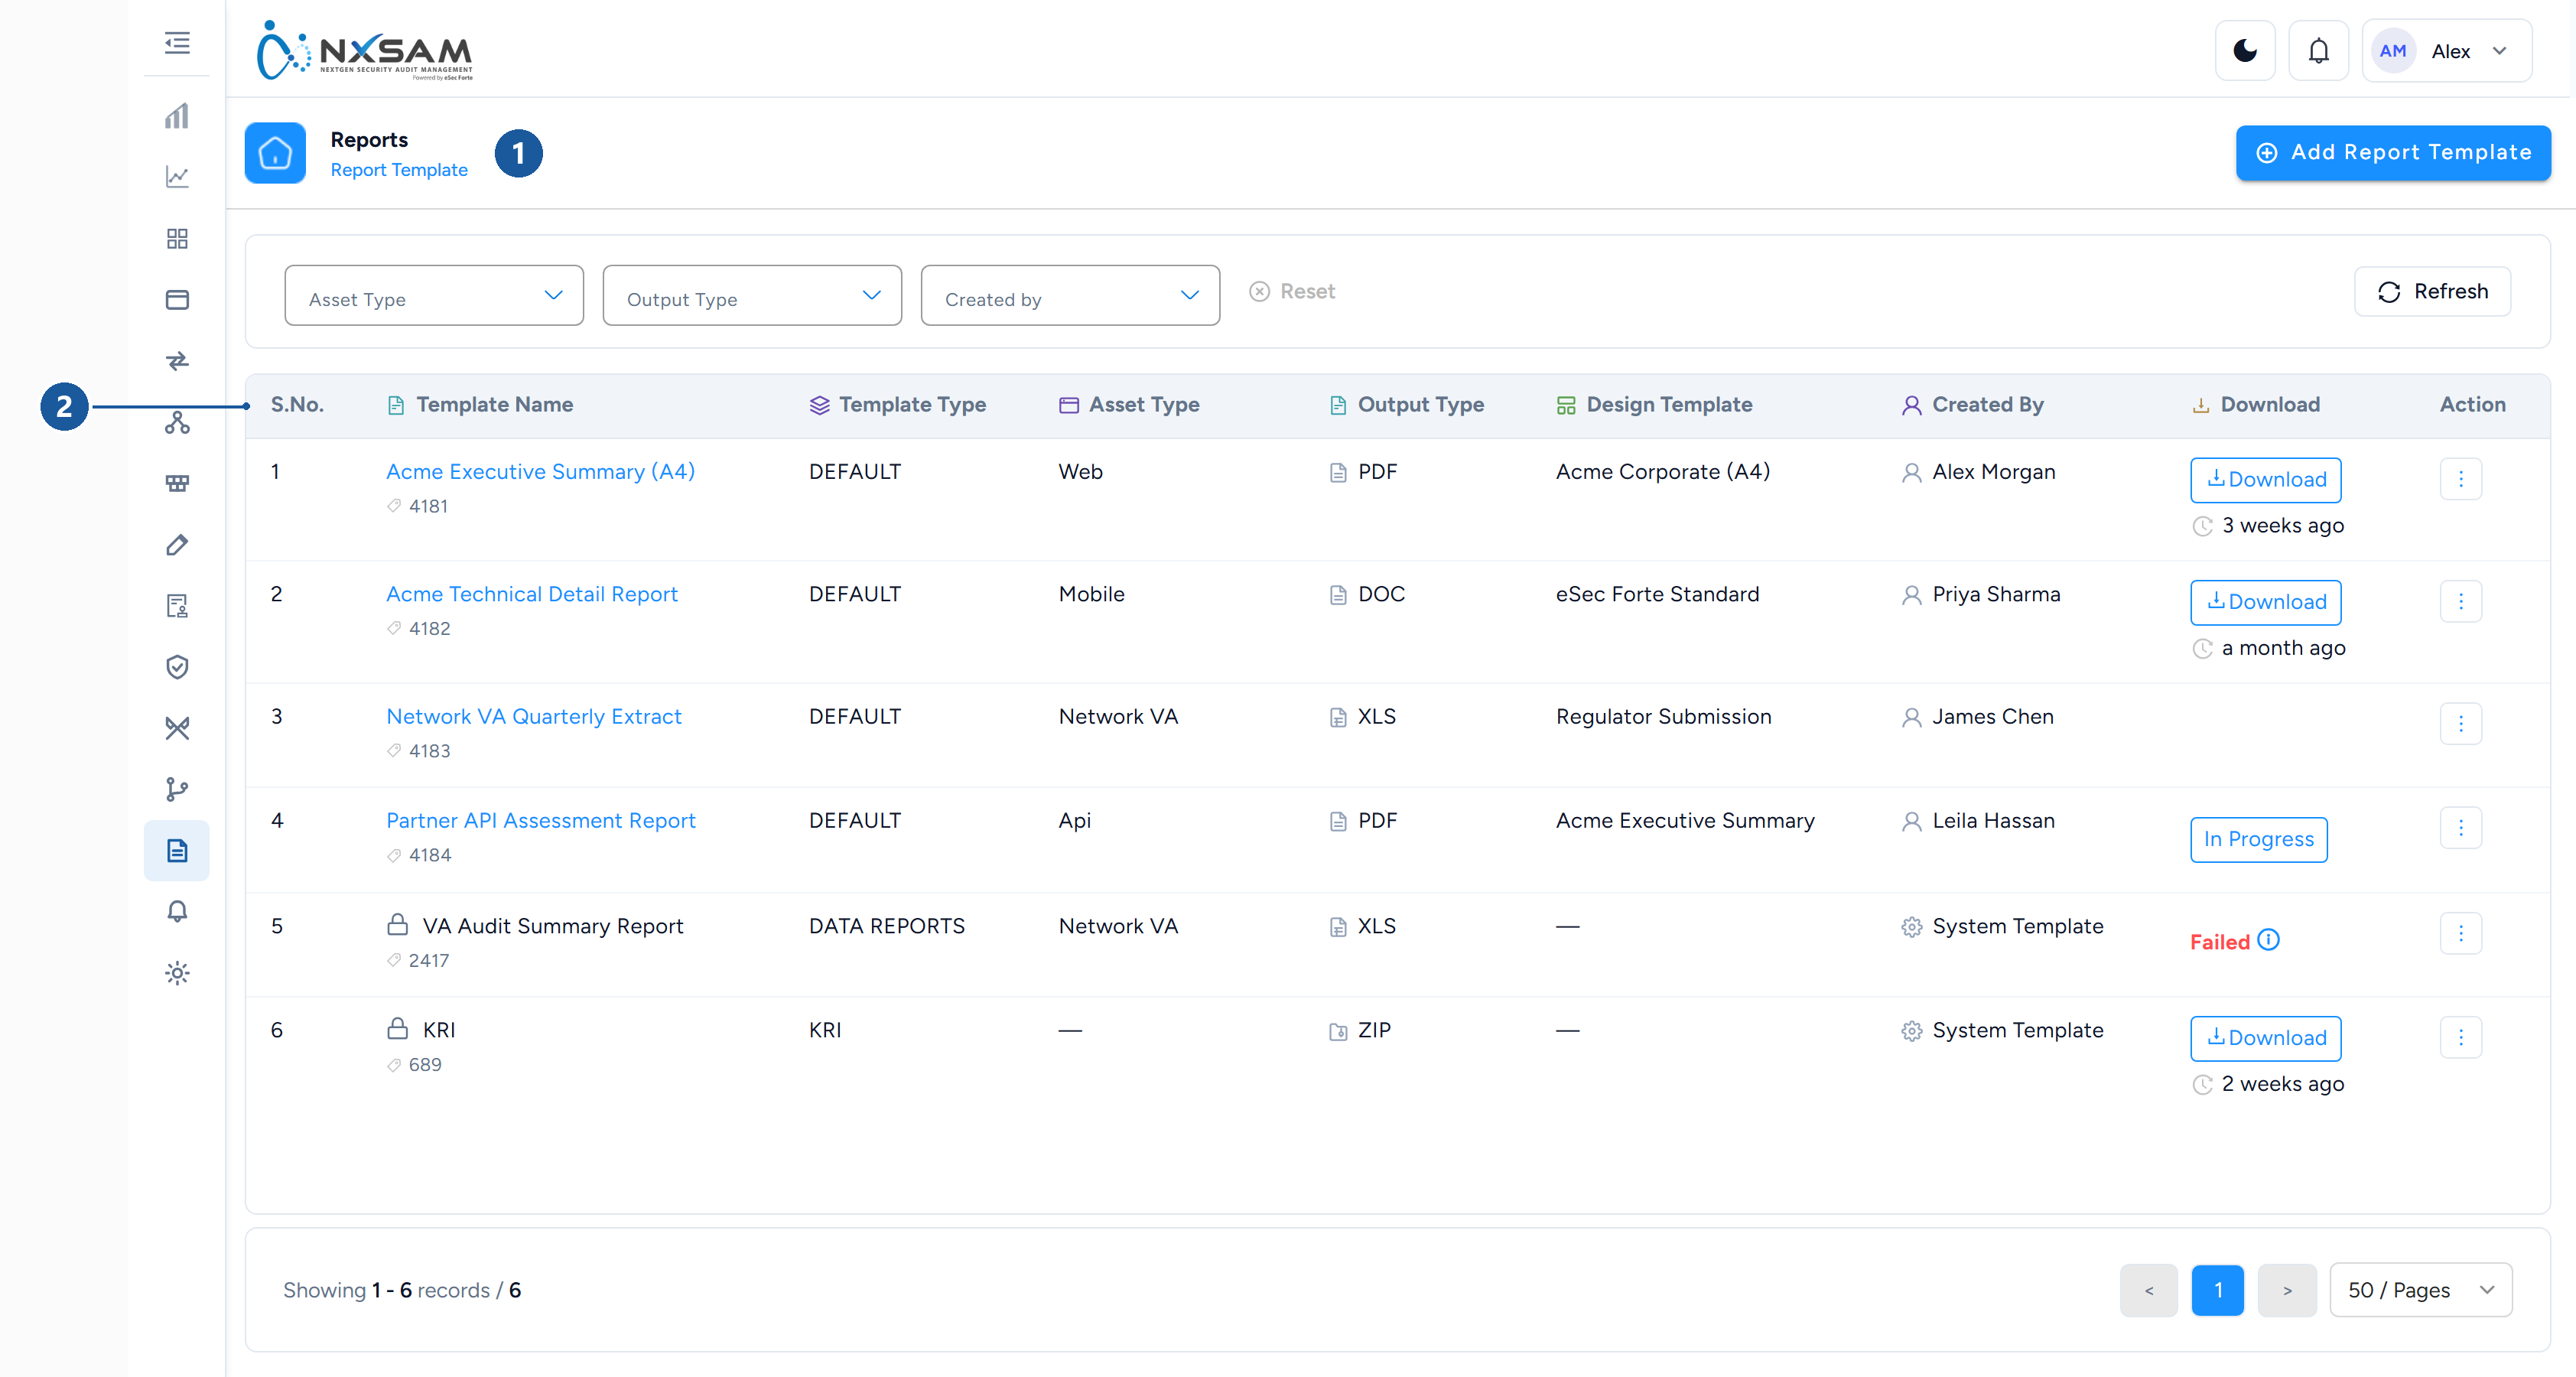
1 where you are · 2 the template list
Templates control structure and appearance so reports are consistent regardless of who produced them. A template fixes which sections appear, in what order, and how findings are grouped and presented.
Editing a template affects future reports. Reports already generated are files, and files do not change.
Scheduled and emailed reports
Where configured, reports can be produced on a schedule and emailed to a defined list. The practical benefit is that recipients who never sign in still receive the picture.
Two things to keep in mind:
- The recipient list is part of the schedule's configuration, so people who join or leave a team need it updated.
- A scheduled report reflects the data at the moment it ran, which is normally overnight. A recipient comparing it against the live screen later in the day will see differences, and those differences are expected.
Build a report template
A report template decides what a generated report contains and in what order. Templates are yours to define: the supplied ones are a starting point, not a limit, and most organisations end up with several — one for an internal technical audience, one for a customer or regulator, one for the board.
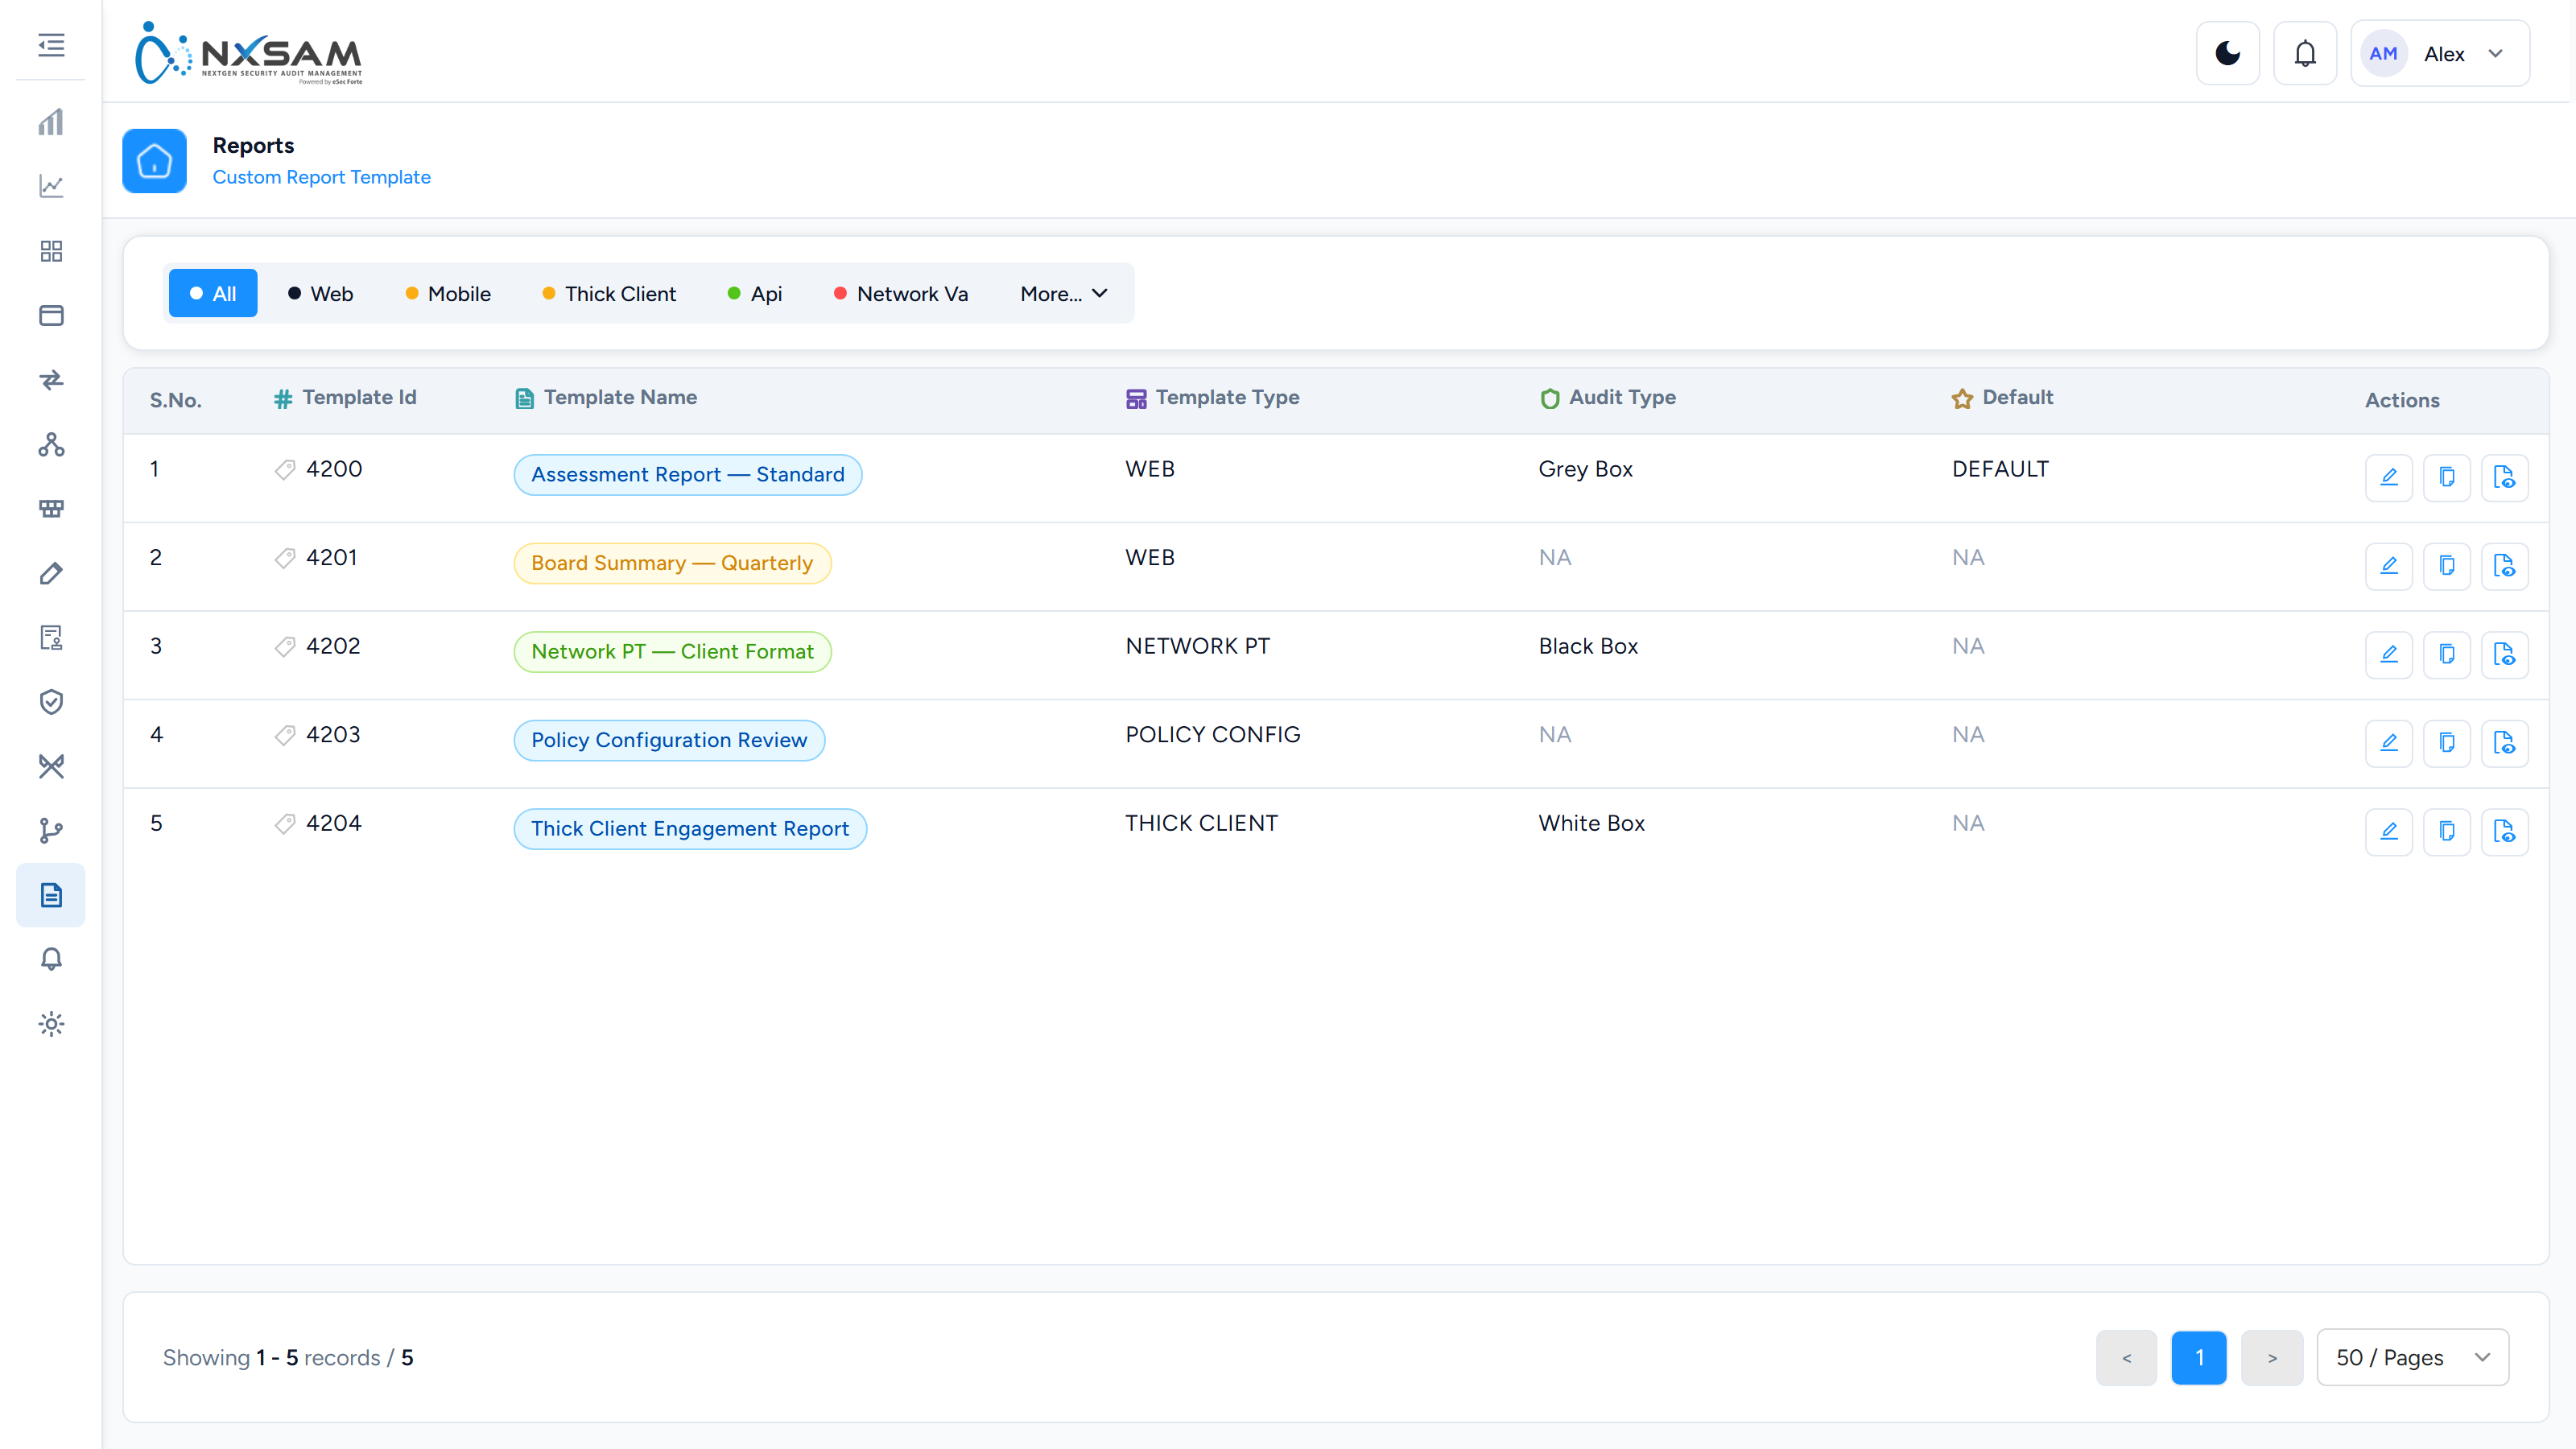
1. Create the template
Add Template asks for the frame the document sits in:
| Field | What it decides |
|---|---|
| Template Name | How it appears when someone generates a report |
| Report Type | Which kind of report this template can produce — it decides which content blocks are available later |
| Asset Type | Which assets it applies to |
| Report Format | The output the template targets |
| Design Template | The visual design the document is rendered with |
| Document Version, Author, Approved By | Printed on the cover, and the fields an auditor looks for first |
| Organization, Address, Contact Details, Email, Phone Number | The issuing party's details on the cover |
Nothing here is the content of the report — that comes next, and it is where the work is.
2. Add sections
Open the template's Sections. A section is a chapter of the document.
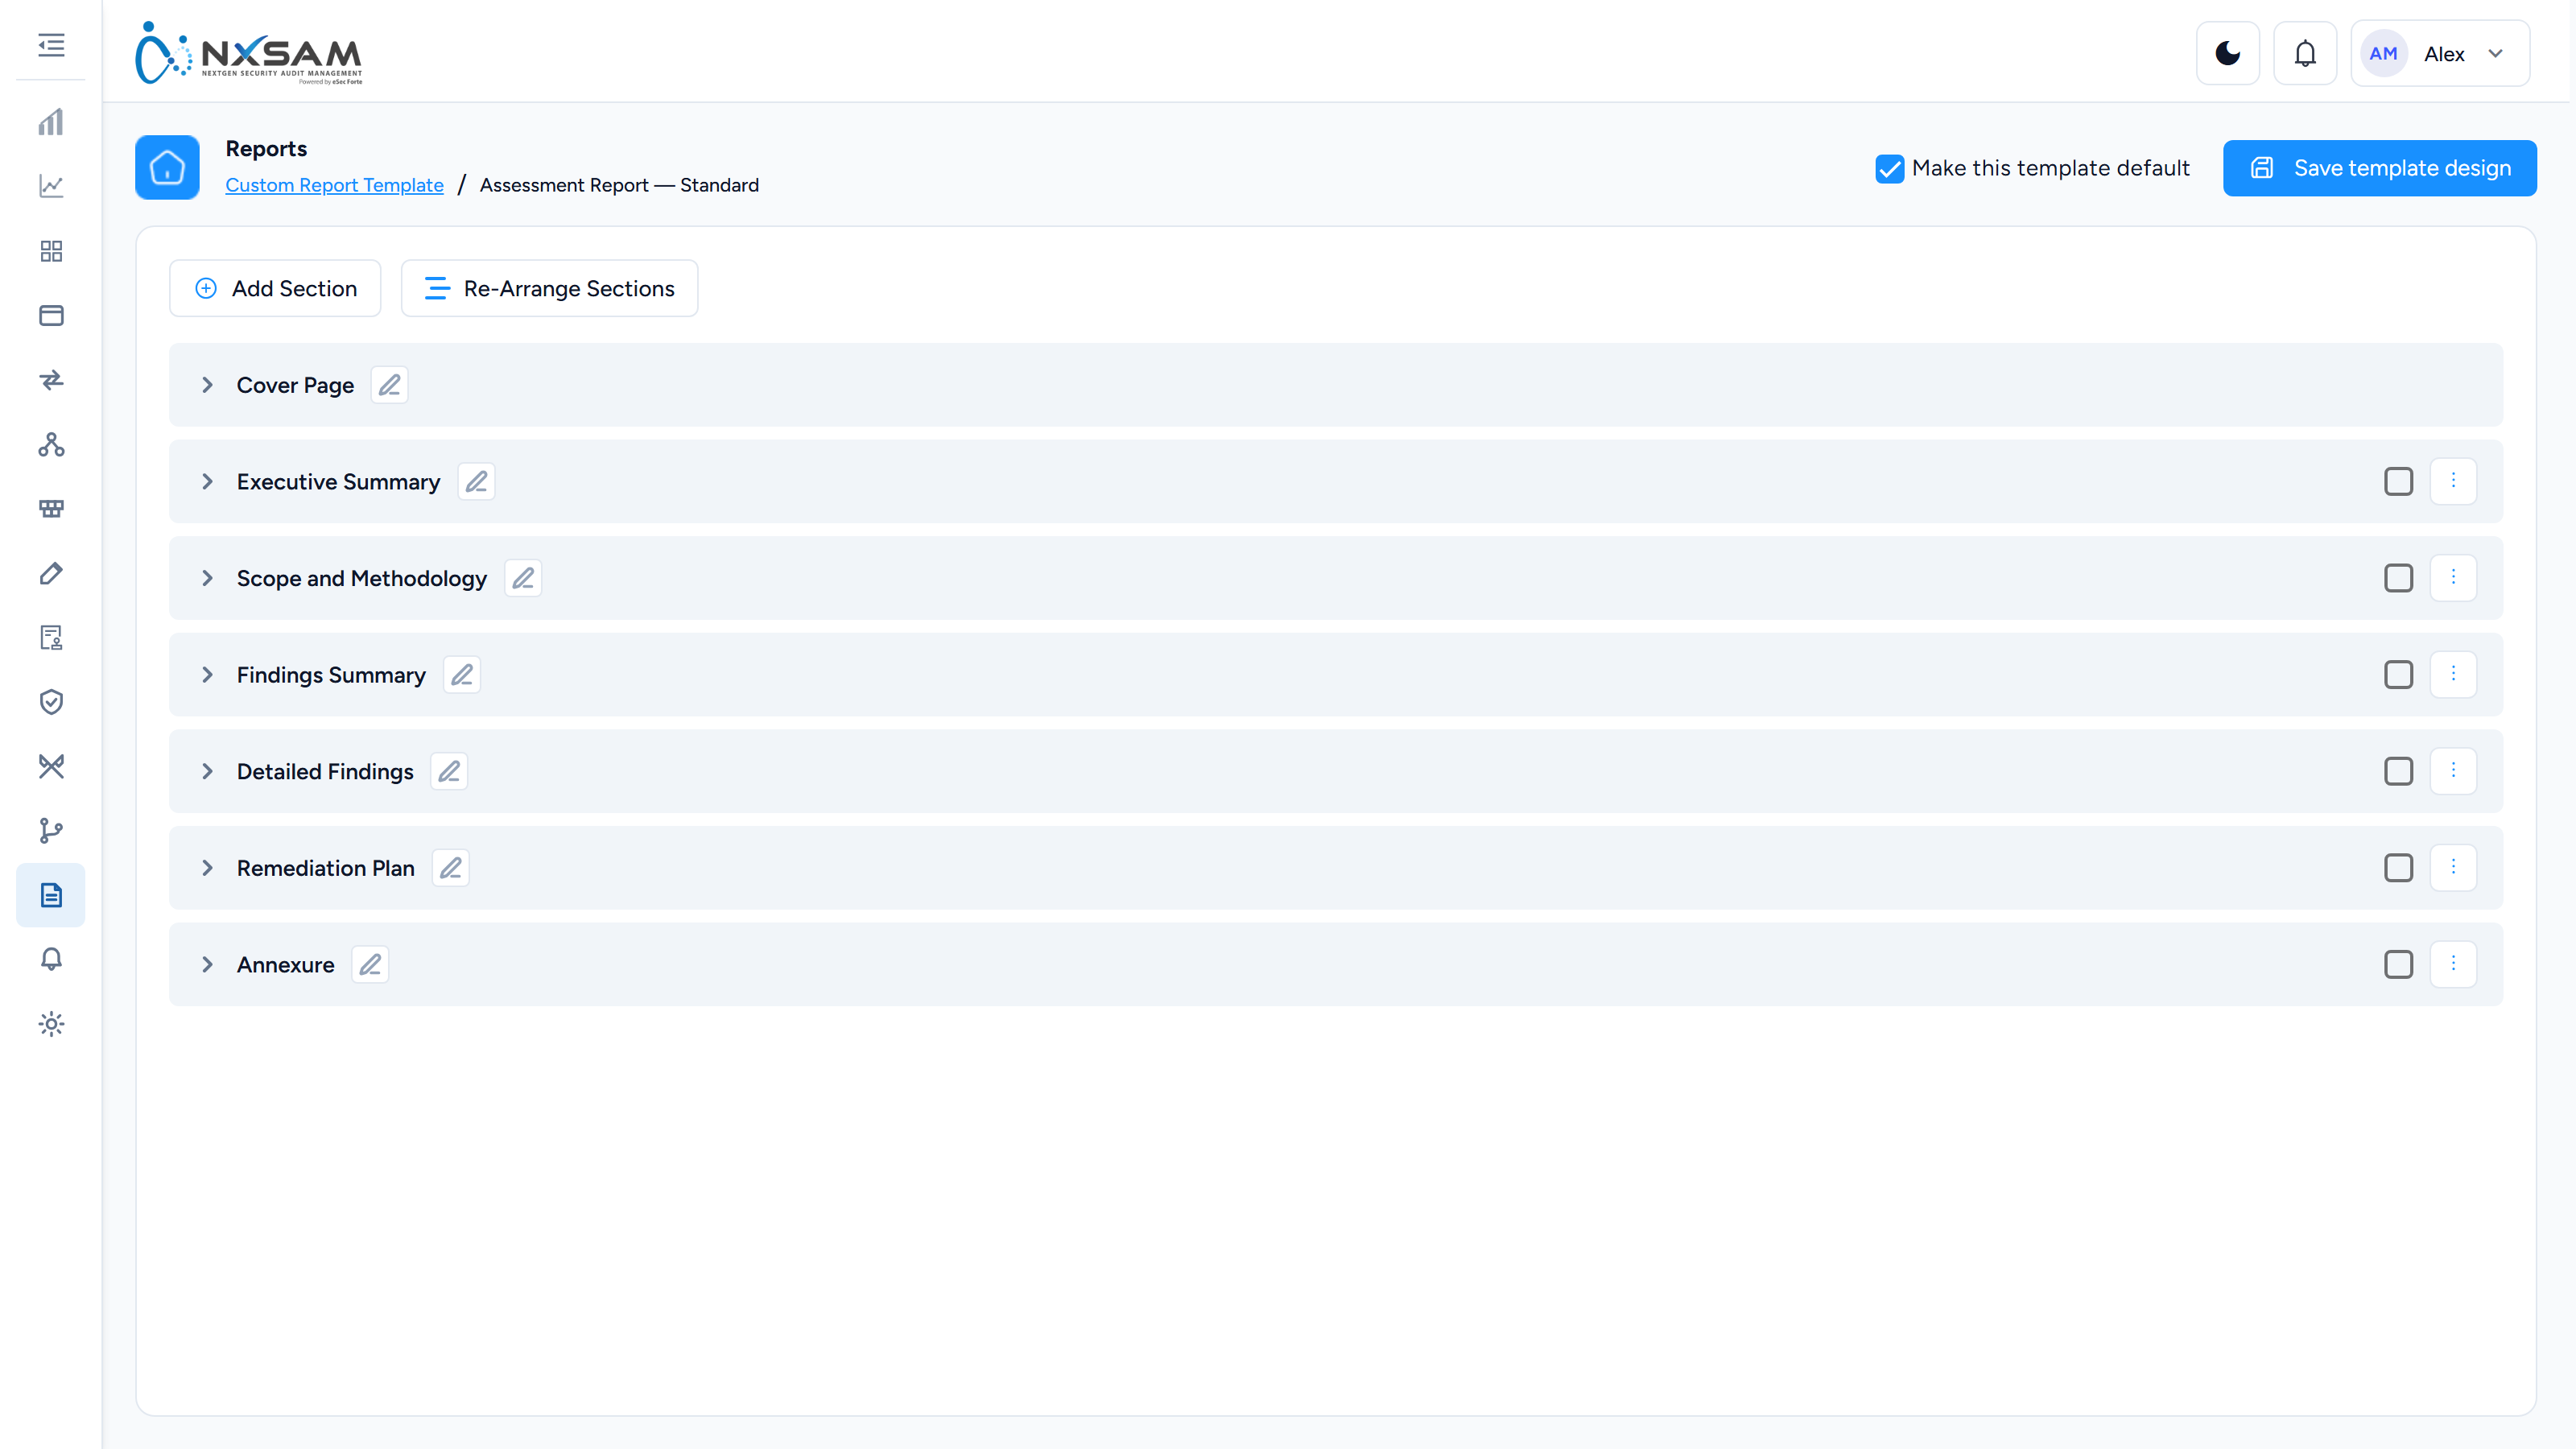
Each section carries three actions:
| Action | What it does |
|---|---|
| Edit Section Name | Rename it. Names are unique within a template and capped at 50 characters |
| Add Sub-Section | Adds a block of content inside the section |
| Re-Arrange Sub-Sections | Changes the order within the section |
Section Position decides where a new section lands. Order is part of the deliverable: a report whose executive summary follows the technical appendix is a different document to its reader, and no amount of correct content fixes that.
3. Fill the sections
A sub-section holds either content you write or content the platform generates.
Written content is edited directly — headings, paragraphs, tables, and an image you upload for a diagram, an architecture sketch or a signature block. This is where scope statements, methodology, disclaimers and conclusions live: the parts that are the same in every report and should not be retyped.
Generated content is a block the platform fills at generation time from the audit the report covers. The blocks available depend on the report type, and include:
| Block | What it renders |
|---|---|
| Assets in Scope | What was assessed — affected IP, URL or application, asset group, classification |
| Application / Audit Details | The audit's own particulars, owner and phase |
| Asset-Wise Vulnerability Statistics | Counts per asset |
| Findings by Severity / Status / Category | The three standard breakdowns |
| Closed Vulnerability List | What was fixed, for a re-test or closure report |
| CVE / CWE references | The identifiers a technical reader cross-references |
| Confirmatory rounds | Separate columns per re-test round, so a report can show a finding's history across up to six confirmatory audits |
The point of the split is that written content is stable and generated content is current: you write the methodology once, and every report produced from the template carries this month's findings under it.
4. Set the default
Default marks the template used when someone generates a report without choosing one. Changing which template is default changes what everyone who does not think about it produces — worth announcing rather than doing quietly.
Sharing a template
| Action | What it does | When |
|---|---|---|
| Share View | One template, one owner. Your later edits reach everyone using it | A standard the organisation should follow |
| Share Copy | An independent copy that will drift from yours | A starting point someone will adapt |
| Manage Config | Which properties the template includes | Tuning what a shared template shows |
The choice matters more than it looks. Share View keeps a house style consistent and means a correction reaches every user; Share Copy hands over ownership and accepts divergence.
Test a template before it is used in anger
Generate one report from a new template against a real audit and read it end to end. Section order, an empty generated block, or a placeholder left in written content are all obvious in the output and nearly invisible in the builder.
Generate a report
Steps
- Go to Reports and choose the kind you need:
- Assessment report — the findings of one audit
- Overall vulnerabilities — everything currently open, across the estate
- Set the scope — which audit, assets, or period.
- Choose a template if more than one is available.
- Submit.
Generation happens in the background. The report appears in Reports Management when it is ready, and you download it from there.
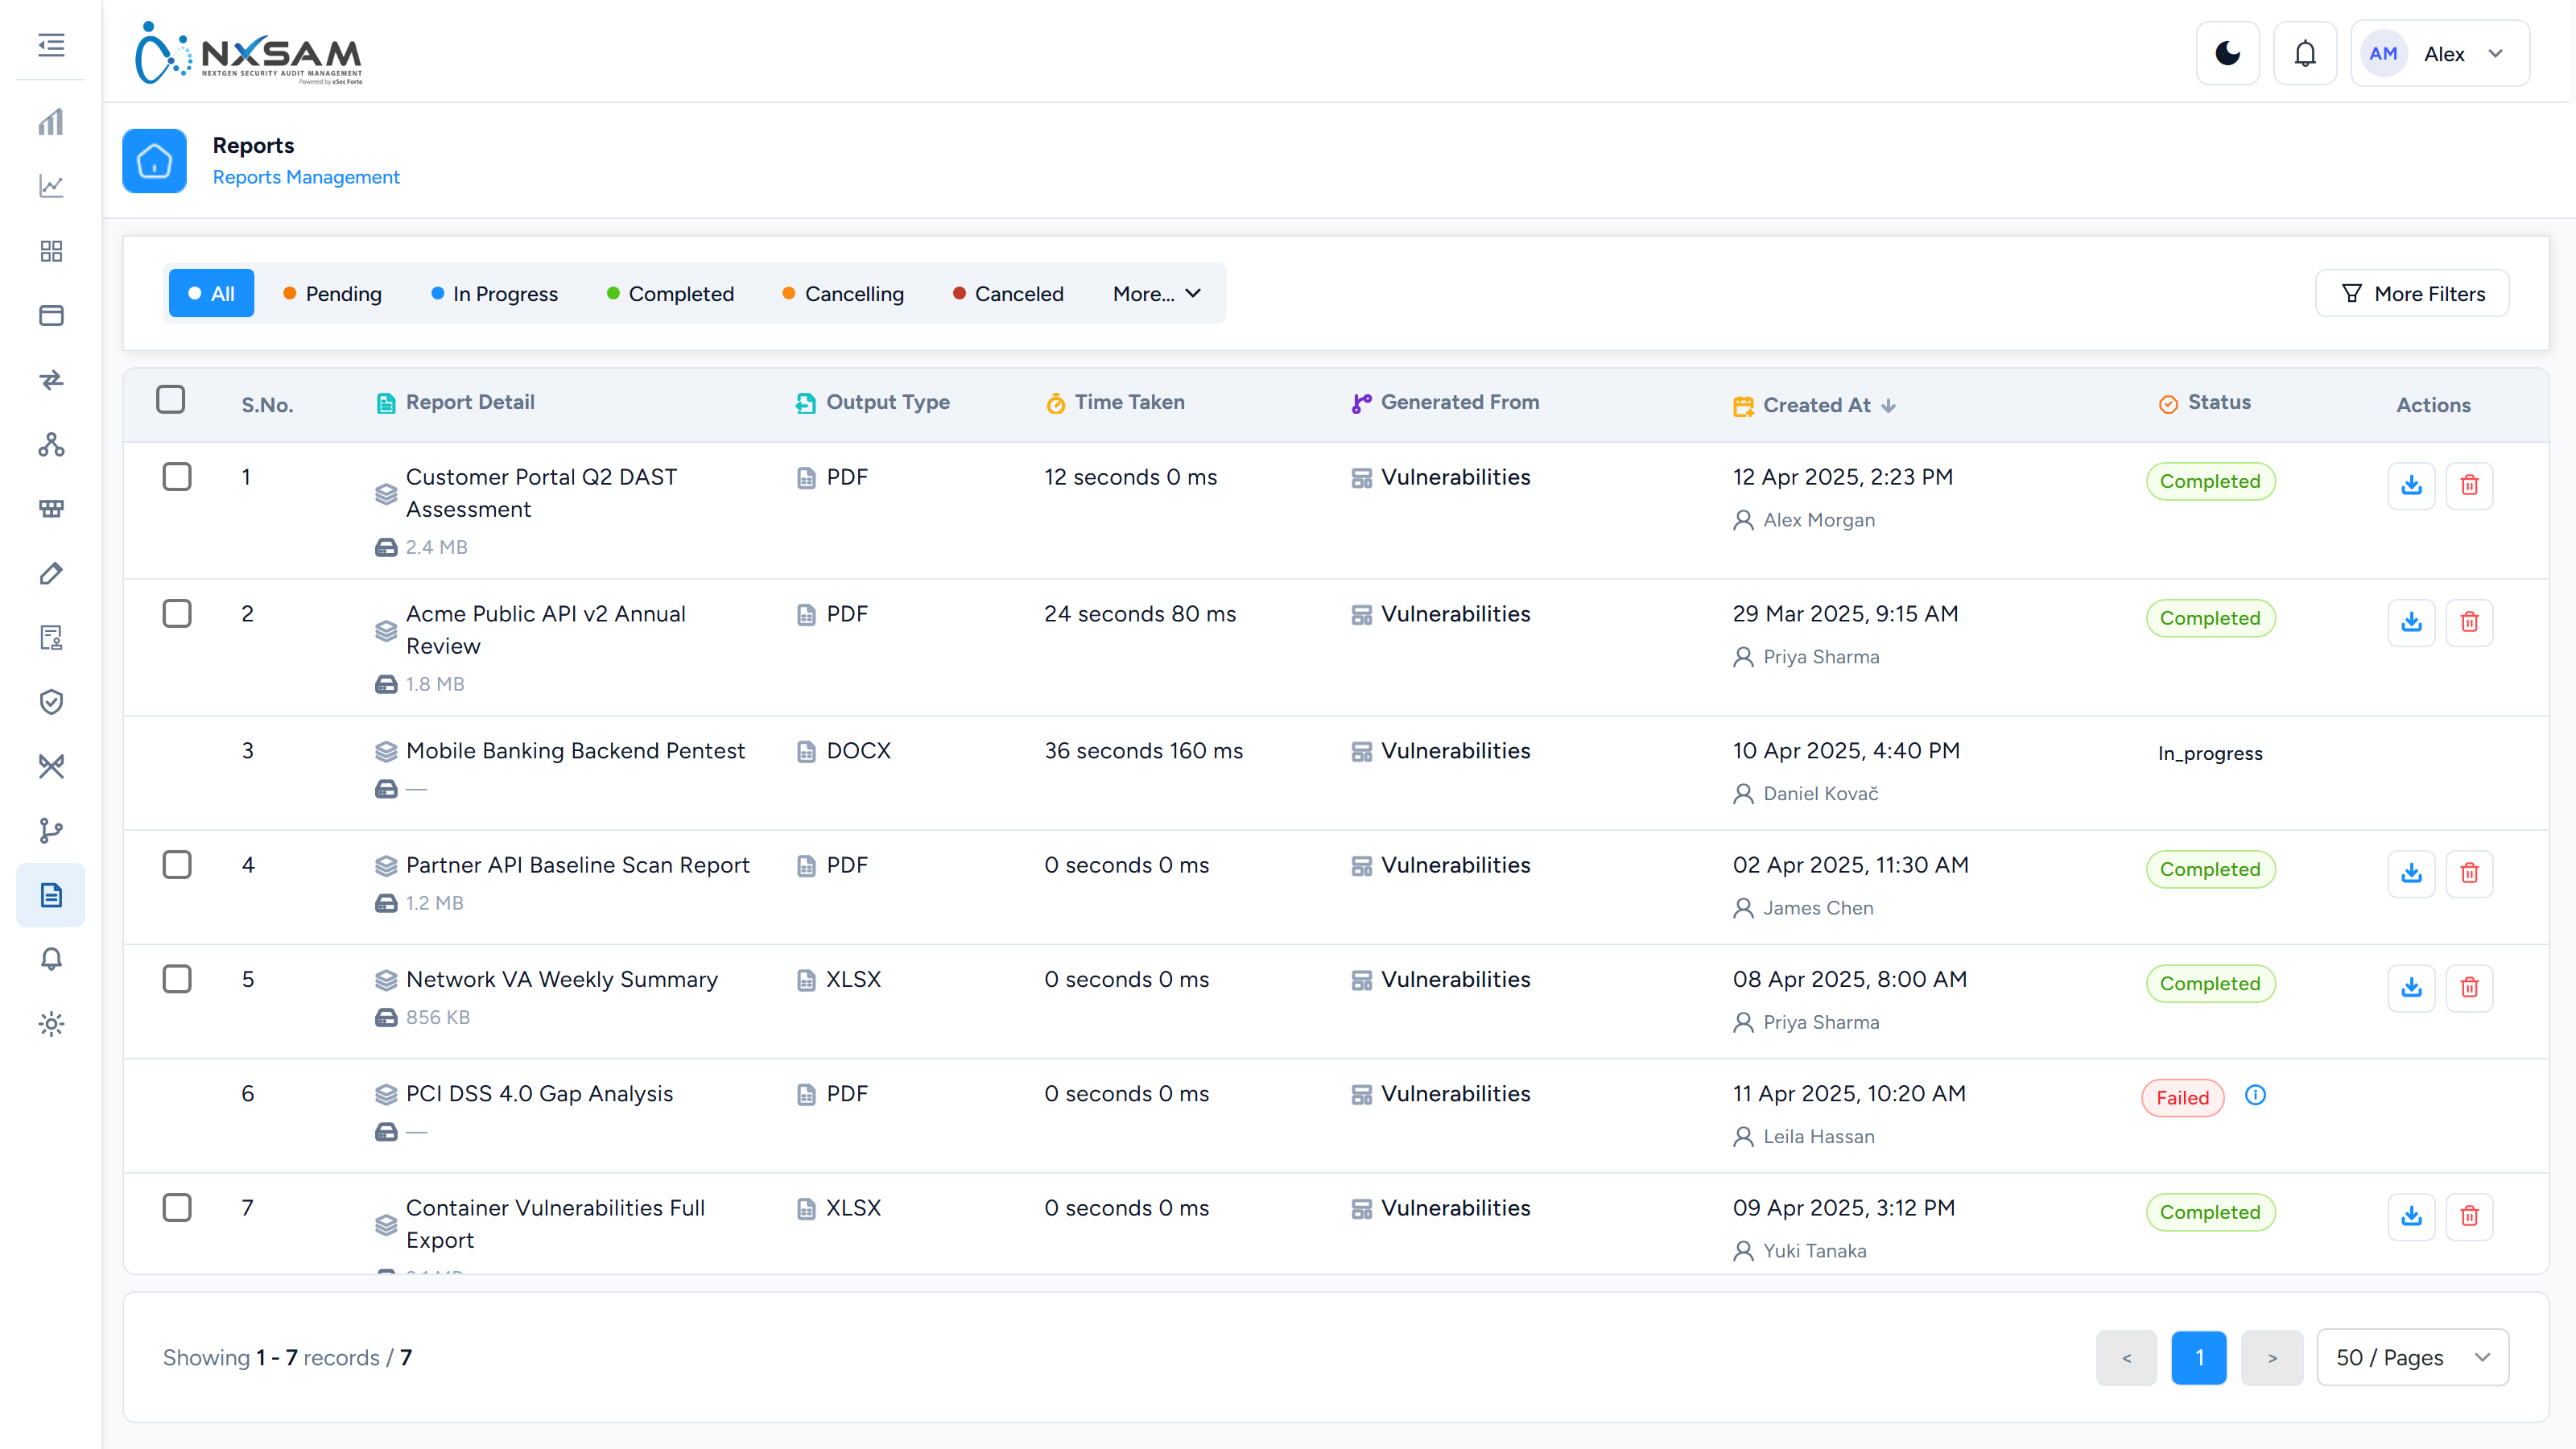
It is queued, not instant
A large report takes time. If it has not appeared, it is usually still being prepared rather than failed.
Choosing the right scope
The most common cause of a report being wrong is scope rather than data.
| You want | Scope to |
|---|---|
| What we found in this assessment | The specific audit |
| Everything open right now | The whole estate, no audit filter |
| One team's position | Their business unit or project |
| One application's history | The asset, across audits |
Which template you pick decides the sections and the cover, not the data — two templates over the same scope contain the same findings.
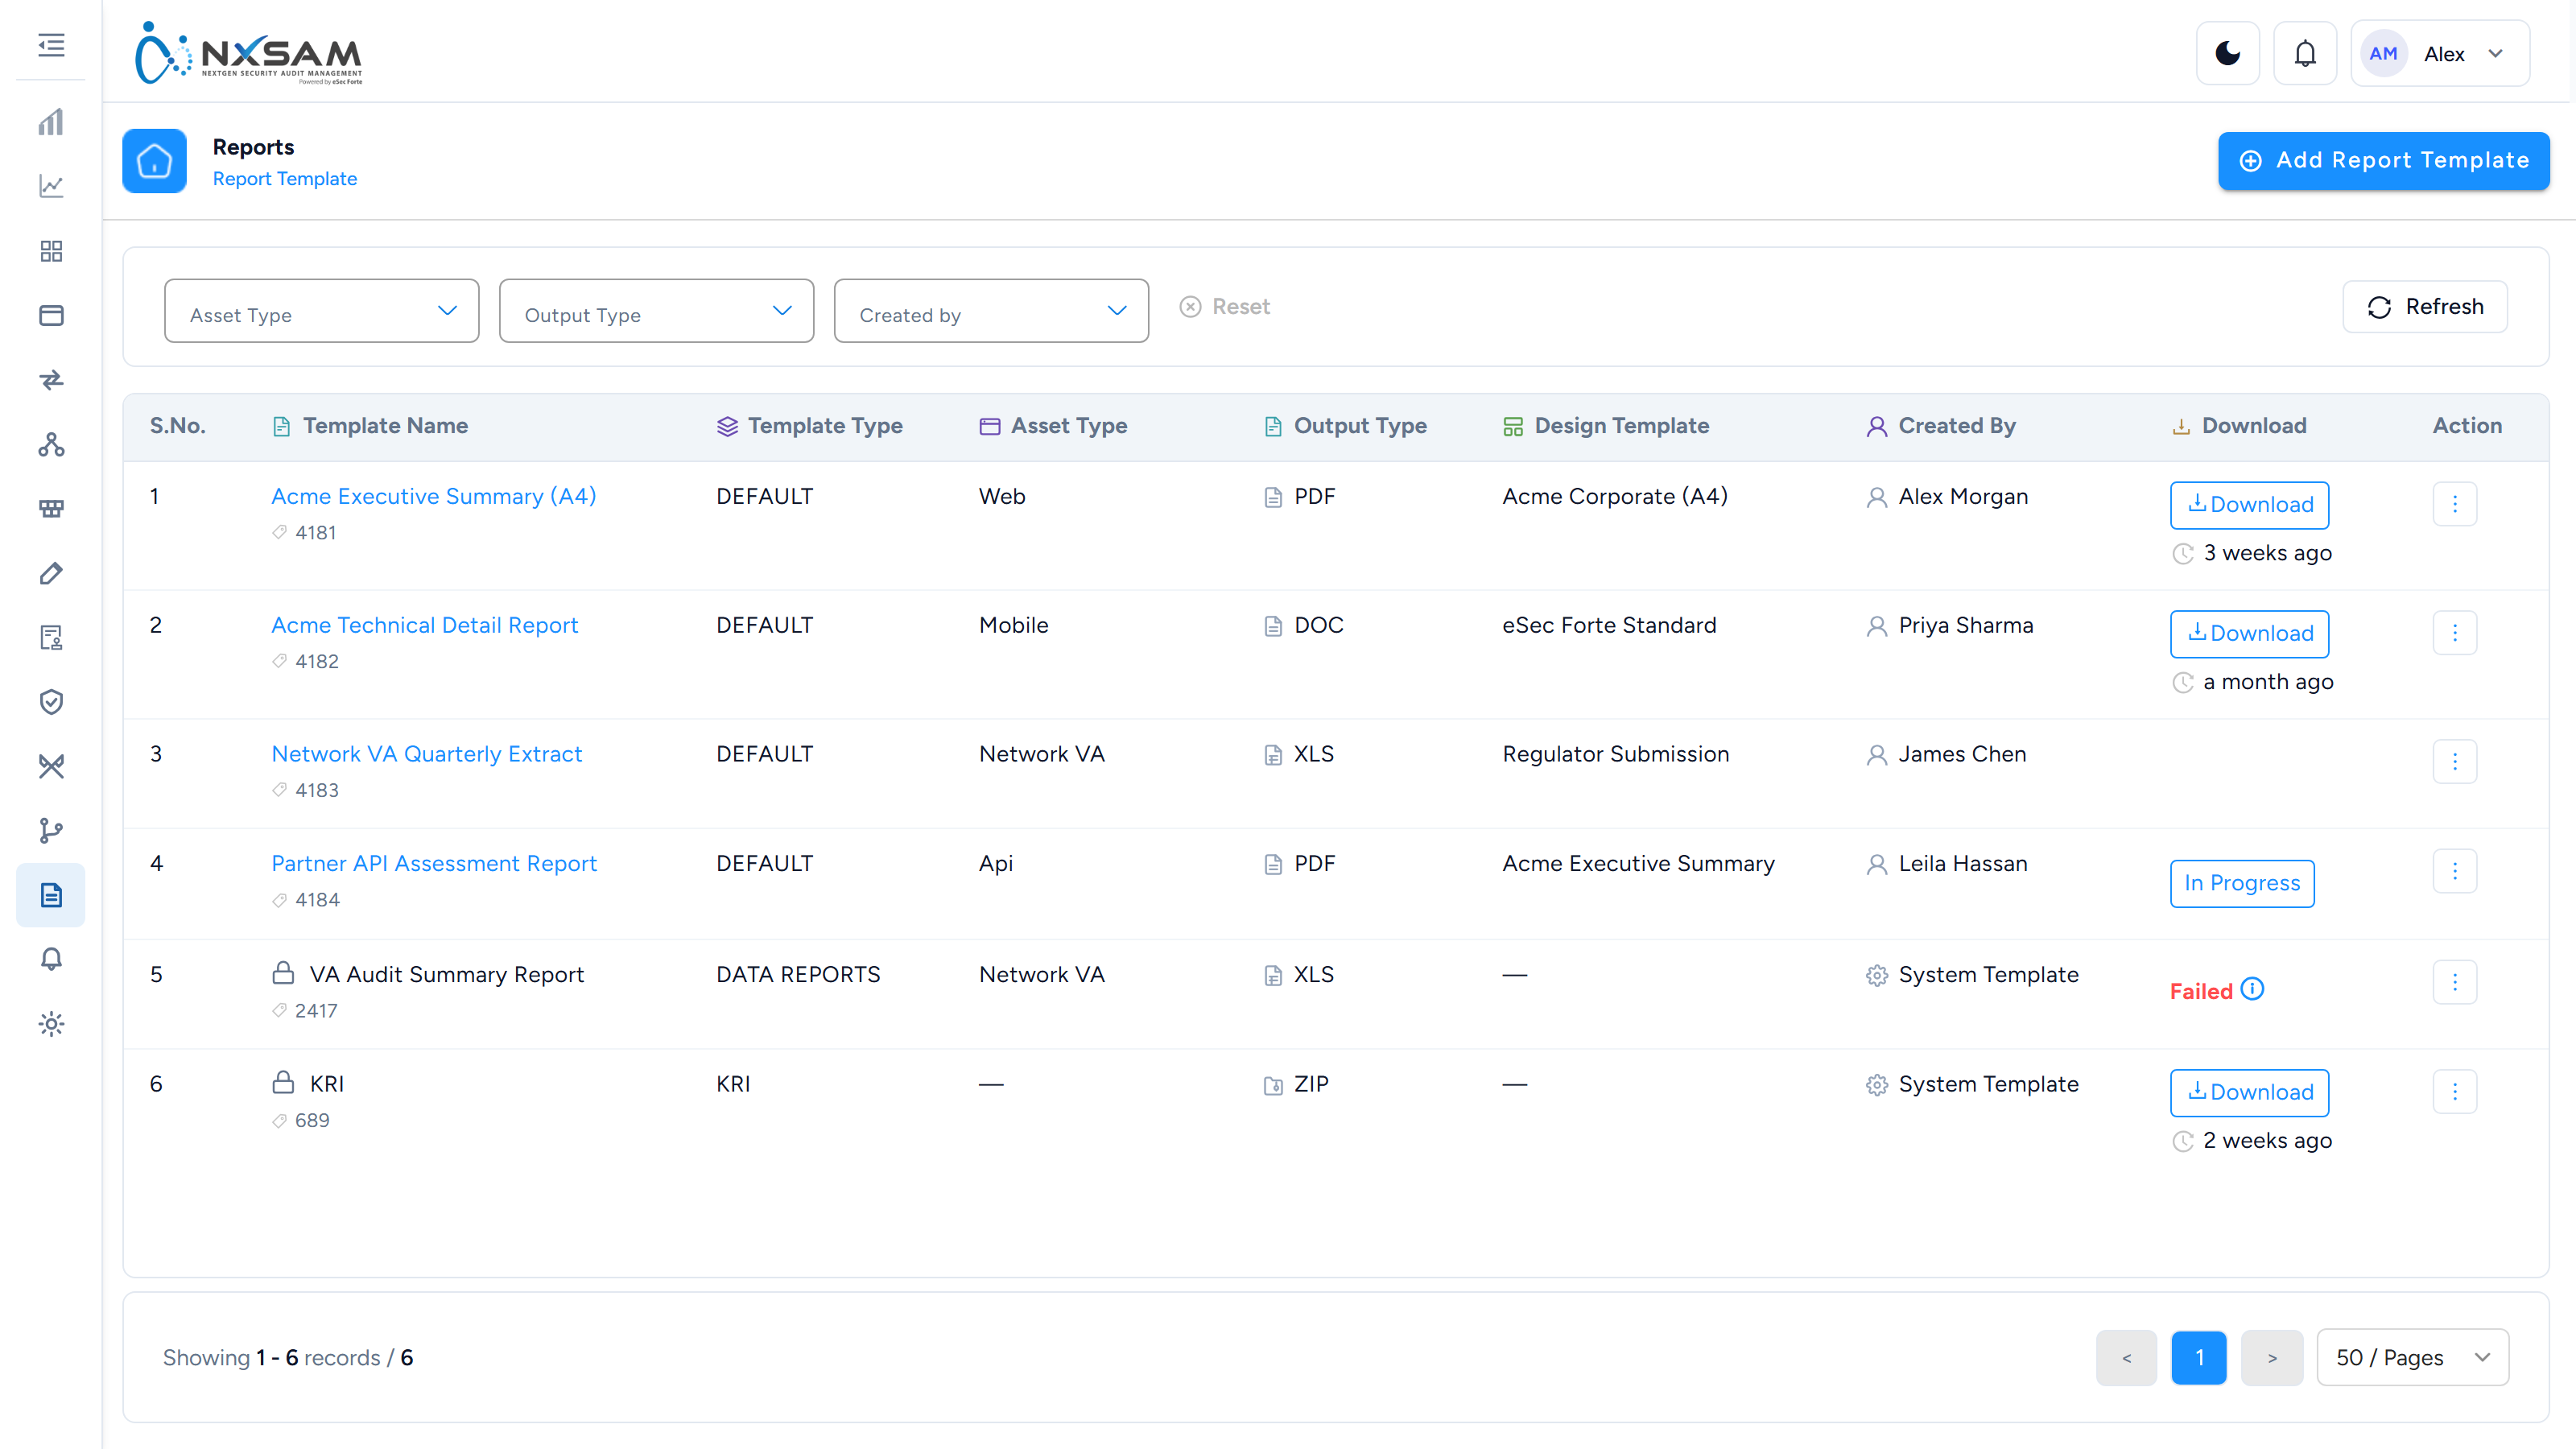
What the report contains
A report is a snapshot, produced once and stored. That is what makes it valid to send to an auditor — it does not change after you have shared it.
It also means the report will not update. If the data has moved on, generate a new one.
Why a report can differ from the screen
Almost always one of three things:
- Time. The report was generated earlier; the screen is live. SLA states change as dates pass, with no data edit at all.
- Scope. The report covered a narrower or wider set than the screen is showing.
- Inclusion rules. Reports may exclude findings the screen includes — those awaiting approval, for instance.
Check the generation timestamp and scope before treating a difference as an error.
Sharing
Reports download as files. Consider before sending:
- Sensitivity. A vulnerability report is a map of your weaknesses. Treat it accordingly.
- Age. Include the generation date when you share, so the recipient knows what it reflects.
- Audience. An assessment report suits the team that owns the system; an overall report suits management.
How a report is produced
Report tickets divide almost evenly between "it never arrived" and "the numbers are wrong", and the two have completely different causes.
It is a queued job, not a download
Requesting a report publishes a message. A separate rendering service consumes it, builds the document, and stores the file. Only then does it appear in Reports Management.
request → queued → renderer consumes → document built → stored → downloadable
Nothing about that is instant, and a large report legitimately takes minutes. The request returning successfully means the job was accepted, not that the report exists.
"The report never arrived"
Check in this order:
- Is the job queued or failed? Process Manager distinguishes the two immediately.
PENDINGmeans nothing consumed it;FAILEDmeans the renderer ran and errored. - Are other queued things also stalled? Reports, imports and outbound email share the same broker. If all three are stuck, the report is a symptom, not the problem.
- Was it scheduled rather than requested? A scheduled report runs on its own timetable — usually overnight — and did not run because it was not yet due.
- Was it emailed to a list you are not on? Scheduled reports go to a recipient list configured on the schedule, which is maintained separately from user accounts. People who join or leave a team do not get added or removed automatically.
A report that failed for one scope and succeeds for a narrower one is usually a size problem: a report covering the entire estate over a long period can exceed what the renderer will complete.
"The numbers are wrong"
Nearly always one of four things, and only the last is a defect.
The report is older than the screen. A report is a snapshot at the moment it ran. SLA states in particular change with the passage of time alone — a finding that was approaching expiry when the report ran is overdue today, with no data edit involved. Check the generation timestamp first; it resolves this immediately.
The scope differs. The report covered one audit, one asset group or one period. The screen is showing something wider or narrower. This is the most common cause of a disagreement in absolute counts.
Inclusion rules differ. Reports may exclude findings awaiting approval, or audits not marked as considered — the same rules that make dashboards disagree with module screens. See the two-status-fields workflow.
The template selects different fields. A custom template that groups by a different property will legitimately produce different subtotals from the same data.
Regenerating is the fastest diagnostic
If a regenerated report matches the screen, the original was simply old, and nothing is wrong. That single step resolves a large share of these tickets before any investigation.
Templates apply going forward
Editing a template changes future reports. Documents already produced are files on disk and do not change retrospectively — which is the point, since a report already sent to an auditor must not silently alter afterwards.
If someone needs the old report in the new format, it has to be regenerated, and it will then also pick up any data changes since the original run.
What to collect before escalating
- The report type and the template used
- The generation timestamp and the scope it was run for
- The queue status, if it never arrived
- Whether a regeneration reproduces the discrepancy
The last one matters most: a discrepancy that disappears on regeneration was a timing artefact, and one that survives it is worth investigating.
Reports: every screen, column and action
Complements How a report is produced. This page covers the screens — the template library, the search views and the very wide export tables behind them.
Reports Management
| Column | What it holds |
|---|---|
| Report Detail | What was generated |
| Output Type | PDF, XLSX, DOCX, CSV |
| Time Taken | How long generation took |
| Generated From | Which template or screen produced it |
| Created At | When |
| Status | Queued, generating, complete or failed |
Time Taken is the column to look at when reports start failing. A report that normally takes two minutes and now takes twenty is heading for a timeout, and the trend is visible here before anyone reports a failure.
Assessment reports
Application Name, Report Details, Audit Name, Size (MB), Created By,
Created On, Updated On.
Size (MB) matters because assessment reports are emailed. A report past your mail gateway's attachment limit will generate successfully and never arrive, and this is the only place the size is visible before someone reports it missing.
Report templates
| Column | What it holds |
|---|---|
| Template Id / Template Name | Identity |
| Template Type | The kind of report |
| Asset Type | Which assets it applies to |
| Output Type | The format it produces |
| Design Template | The layout it renders through |
| Created By | Who defined it |
| Download | Retrieves the template itself |
Row actions — seven
| Action | What it does |
|---|---|
| View Template | The template as defined |
| Edit Template | Change it |
| Run Template | Generate a report from it now |
| Manage Config | Which properties the template includes |
| Share View Template | Grants read access to another user |
| Share Copy Template | Gives another user their own copy |
| Delete Template | Removes it |
Share View and Share Copy are different commitments
Share View leaves one template with one owner — your later edits reach everyone using it. Share Copy creates an independent template that will drift from yours and never receive your corrections.
Copy is right when another team needs to diverge. View is right when consistency matters, which for a report going to a regulator it usually does.
Manage Config carries Property Name, Select Property, Check Linked Assets.
Check Linked Assets decides whether the report follows relationships — pulling in the
hosts an application runs on, for instance — which changes both the content and how long
generation takes.
Run Template opens a host selection of Host IP, Host Name, Application Name,
Application Code, so a template can be run against a subset rather than everything it is
scoped to.
Custom report templates
Template Id, Template Name, Template Type, Audit Type, Default.
Section editing offers Add Sub-Section, Edit Section Name and Re-Arrange Sub-Sections. Order is part of the deliverable: a report whose executive summary appears after the technical appendix is a different document to its reader.
Default marks the template used when none is chosen. Changing which template is default changes what everyone generating a report without thinking about it produces.
Build a report template walks the whole sequence — the cover fields, sections and their order, the difference between written and generated content, and what Share View versus Share Copy commits you to.
Report search
The widest table in the product. Every attribute a finding carries, so a report can be built by filtering rather than by writing a template:
Vuln #, Issue Type, Issue #, Org, BU, Project, Application,
Bifurcation Type, App code, Application Type, Application Facing, Audit,
Audit Type, Audit Category, Audit Considered, and the finding's own fields.
Row actions: Vulnerability History, View SLA History, View Advisories.
Audit Considered as a filterable column is what makes this screen useful for reconciliation. Filtering to considered audits reproduces the dashboard's numbers; including everything reproduces the module screens. Comparing the two answers most "why do these disagree" questions directly.
Findings across modules in one report
Because a report can span modules, the search and export tables carry each module's own identifiers alongside the shared ones:
| Column | Applies to |
|---|---|
| VID | The finding's own identifier |
| CVE | Network and container findings carrying an advisory |
| Title | The finding name as its source reported it |
| Technology | The stack the asset is built on |
| Network Types | The network classification of a host |
| Policy Details / Posture Status | Policy Compliance rows — which benchmark, and pass, fail or error |
| Opened on Date | When the finding was first opened |
A single export therefore mixes rows where some columns are empty by nature — a Policy Compliance row has no CVE, a container row has no policy. Empty cells in this table are a consequence of combining modules, not missing data.
SLA history
SLA Expiry Date, Audit ID, Audit Name, Updated By, Created At.
An SLA expiry can change — because the severity changed, because the SLA configuration changed, or because someone adjusted it. This is the record of that, and it is what settles a dispute about whether a finding was overdue at a particular moment.
The overall vulnerability report
Ticket ID, Key, Org, BU, Project, Audit Details, Vuln Details,
Application Details, Asset Property, Host Details, Source Details,
Port & Protocol, Group Details, Control ID, Plugin ID.
Actions: History, View Advisories. The page offers Overall report and Old overall report — the current format and the previous one, kept because customers build their own tooling on the export and cannot always switch formats on your schedule.
The detail tables behind it
Vulnerability detail — Ticket ID, Risk Acceptance Expiry Date, Risk Acceptance Comment,
First Reported On, Last Observed Date, Duration(In Days), Score, SLA Expiry Date,
Is Overdue, Vulnerability Status, Vulnerability Sub Status.
Duration (In Days) is the age of the finding, and read against First Reported On it
is the number that appears in board reporting. It counts from first report, not from the
current audit — so a finding carried through four audits shows its true age.
Audit detail — Audit Cycle, Audit Scope Length, Initial/Confirmatory,
Audit Assigned On, Assigned Auditor Name, Audit Completed On.
Application detail — Org, BU, Project.
Applications with no findings
Two tables cover the assets a report found nothing on:
No-vuln application detail — App Code, Asset Name, Internet Facing, Priority,
Host Accessibility, Asset Type, OS.
No-vuln audit detail — Audit Cycle, Audit Created On, Audit Assigned On,
Assigned Auditor Name, Audit Completed On.
A clean asset is evidence, and it needs the audit detail to be believable
"No findings" means nothing on its own — it could mean assessed and clean, or never assessed. The paired audit detail is what distinguishes them: an asset with a completed audit and no findings is evidence, and one with no audit is a coverage gap.
This is why the report carries both tables rather than simply omitting clean assets.
Vulnerability history
Audit ID, Audit Name, Risk, Vulnerability Status, Sub Status, Discovered Date,
Created On, Status Changed By — the same shape as the module histories, so a finding
traced from a report reads identically to one traced from its module.
Reports: find the right screen
Every screen in this module, what each one is for, and where it lives. Use it to find the right screen quickly, and to confirm you are on the one a colleague means — several screens in this product have similar names and different jobs.
Screenshots come from a demonstration data set, so the figures are illustrative. Click any screenshot to open it at full resolution.
Assessment Reports
Generated assessment documents, grouped by asset type, with the storage each consumes.
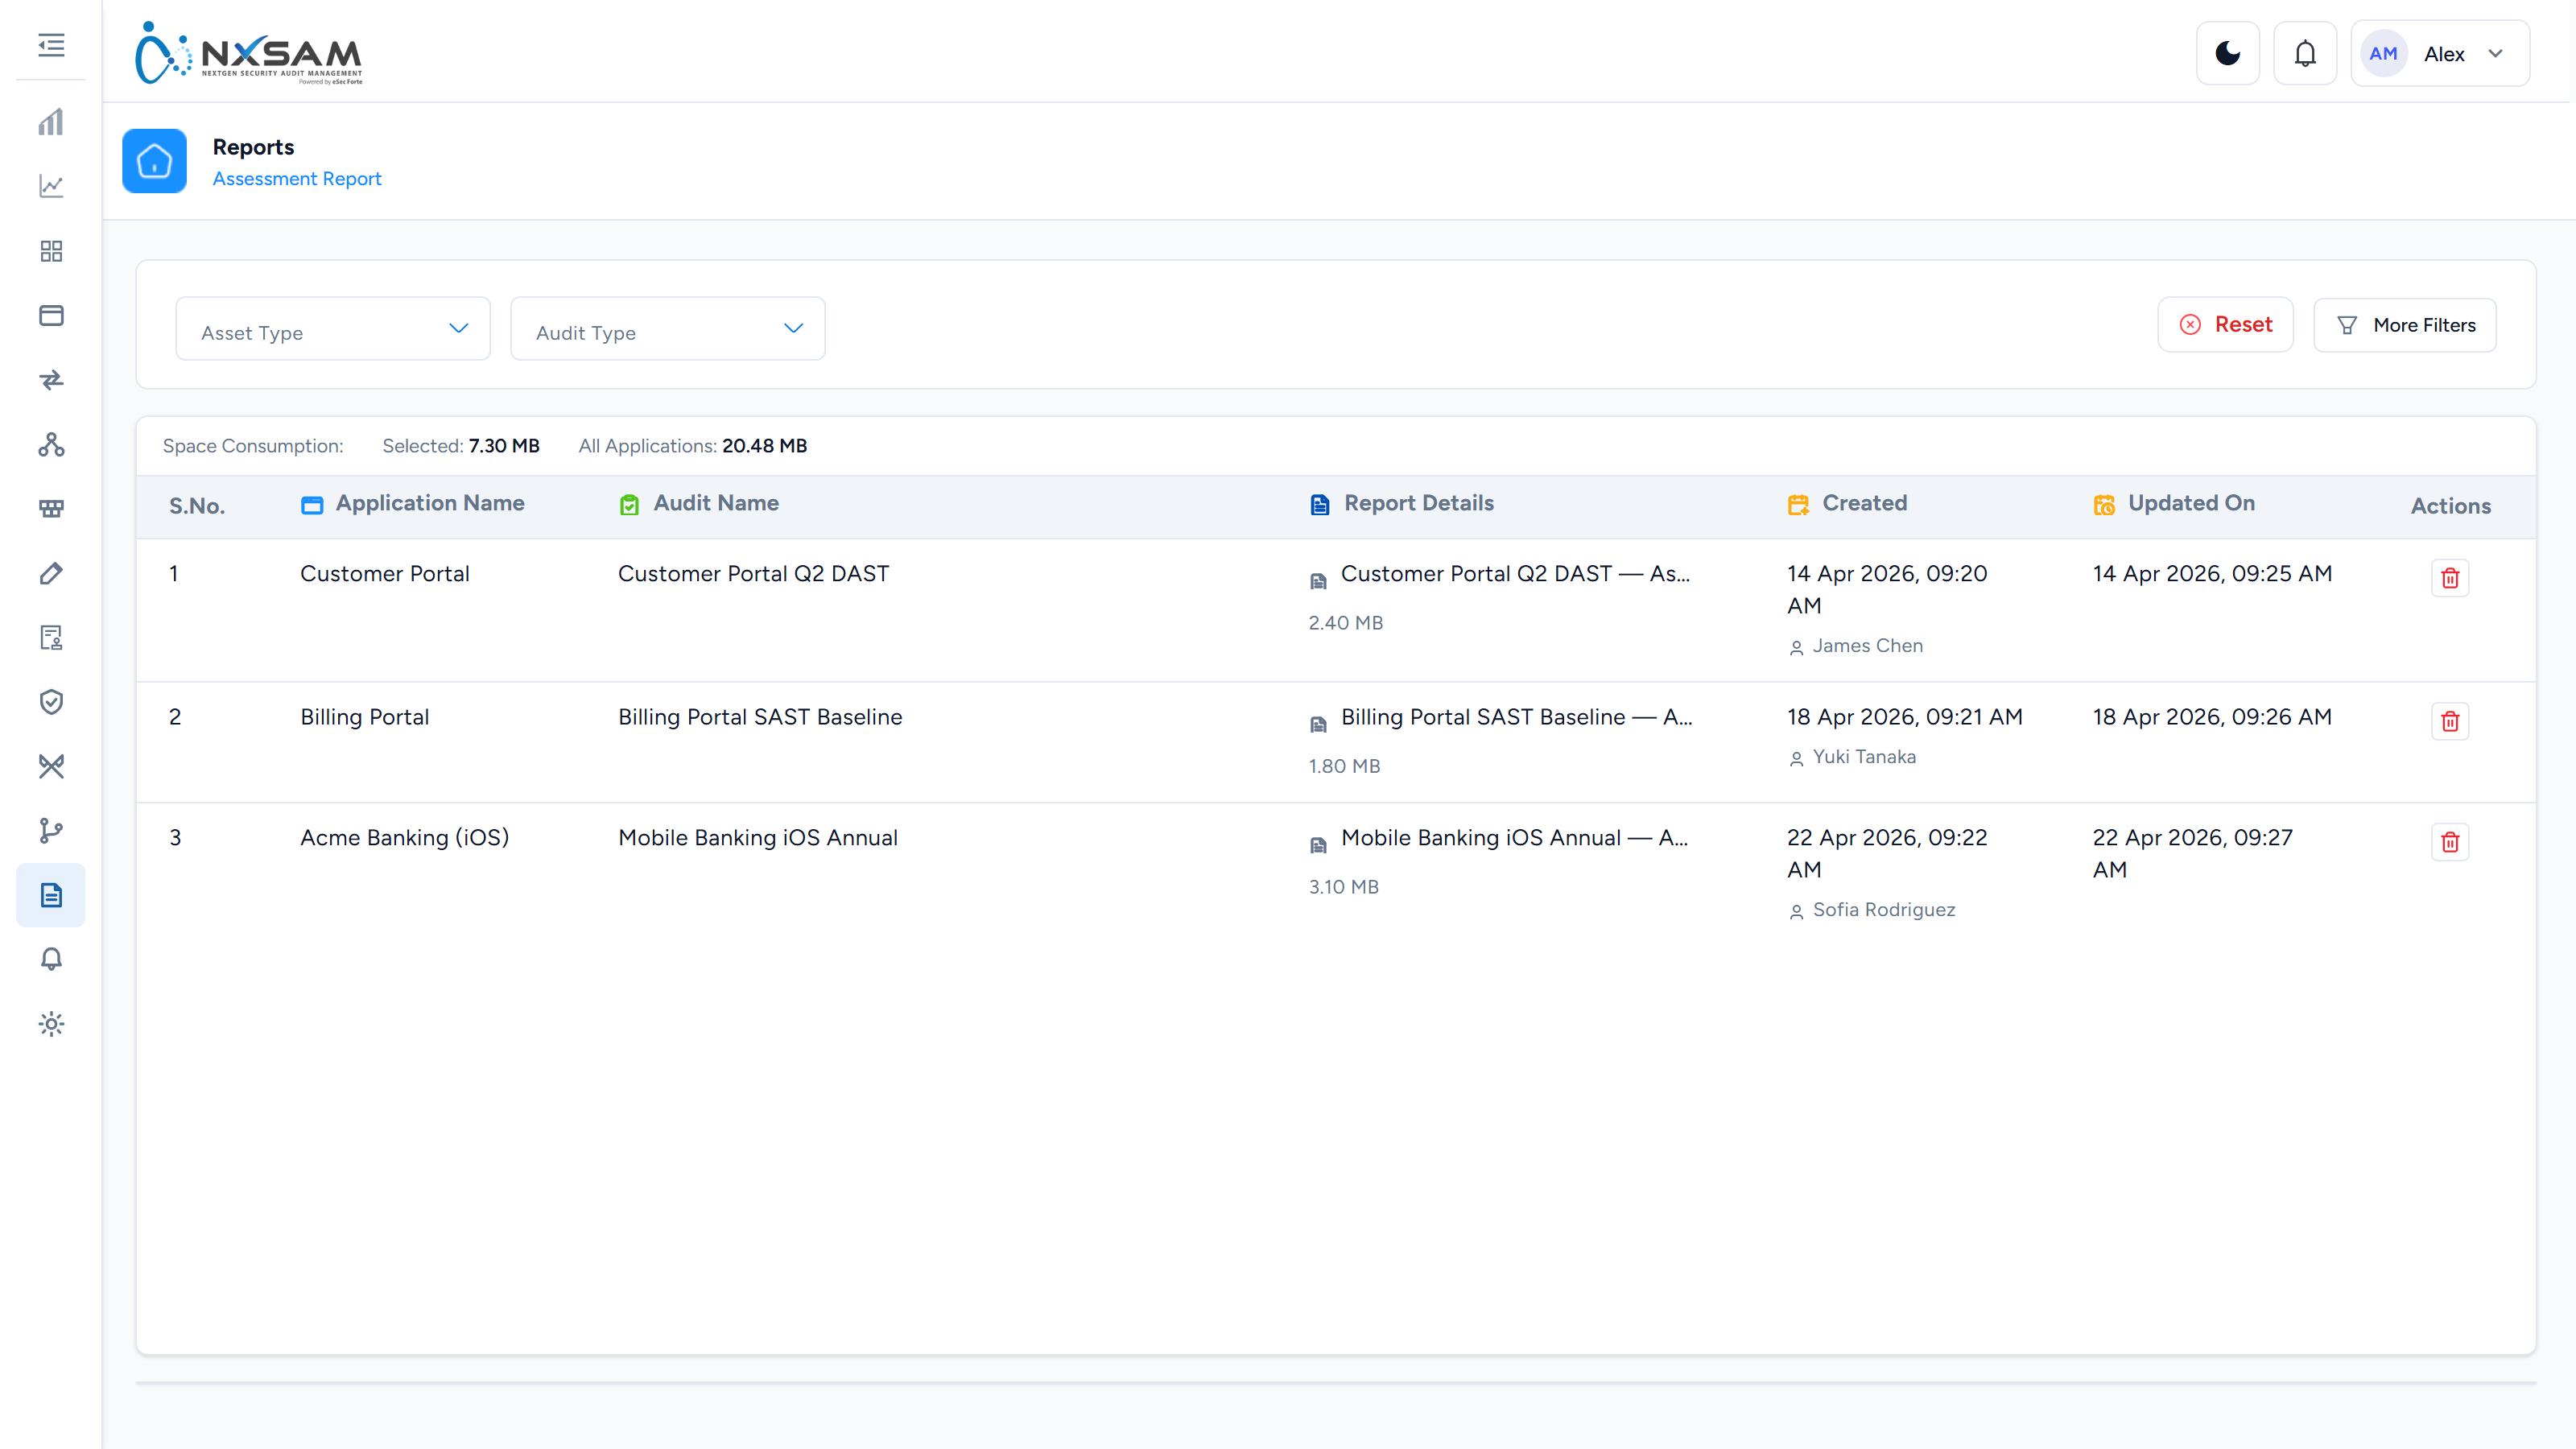
Overall Vulnerabilities Report
One row per finding across every module, with the asset context an auditor asks for. The widest grid in the product — scope it before generating.
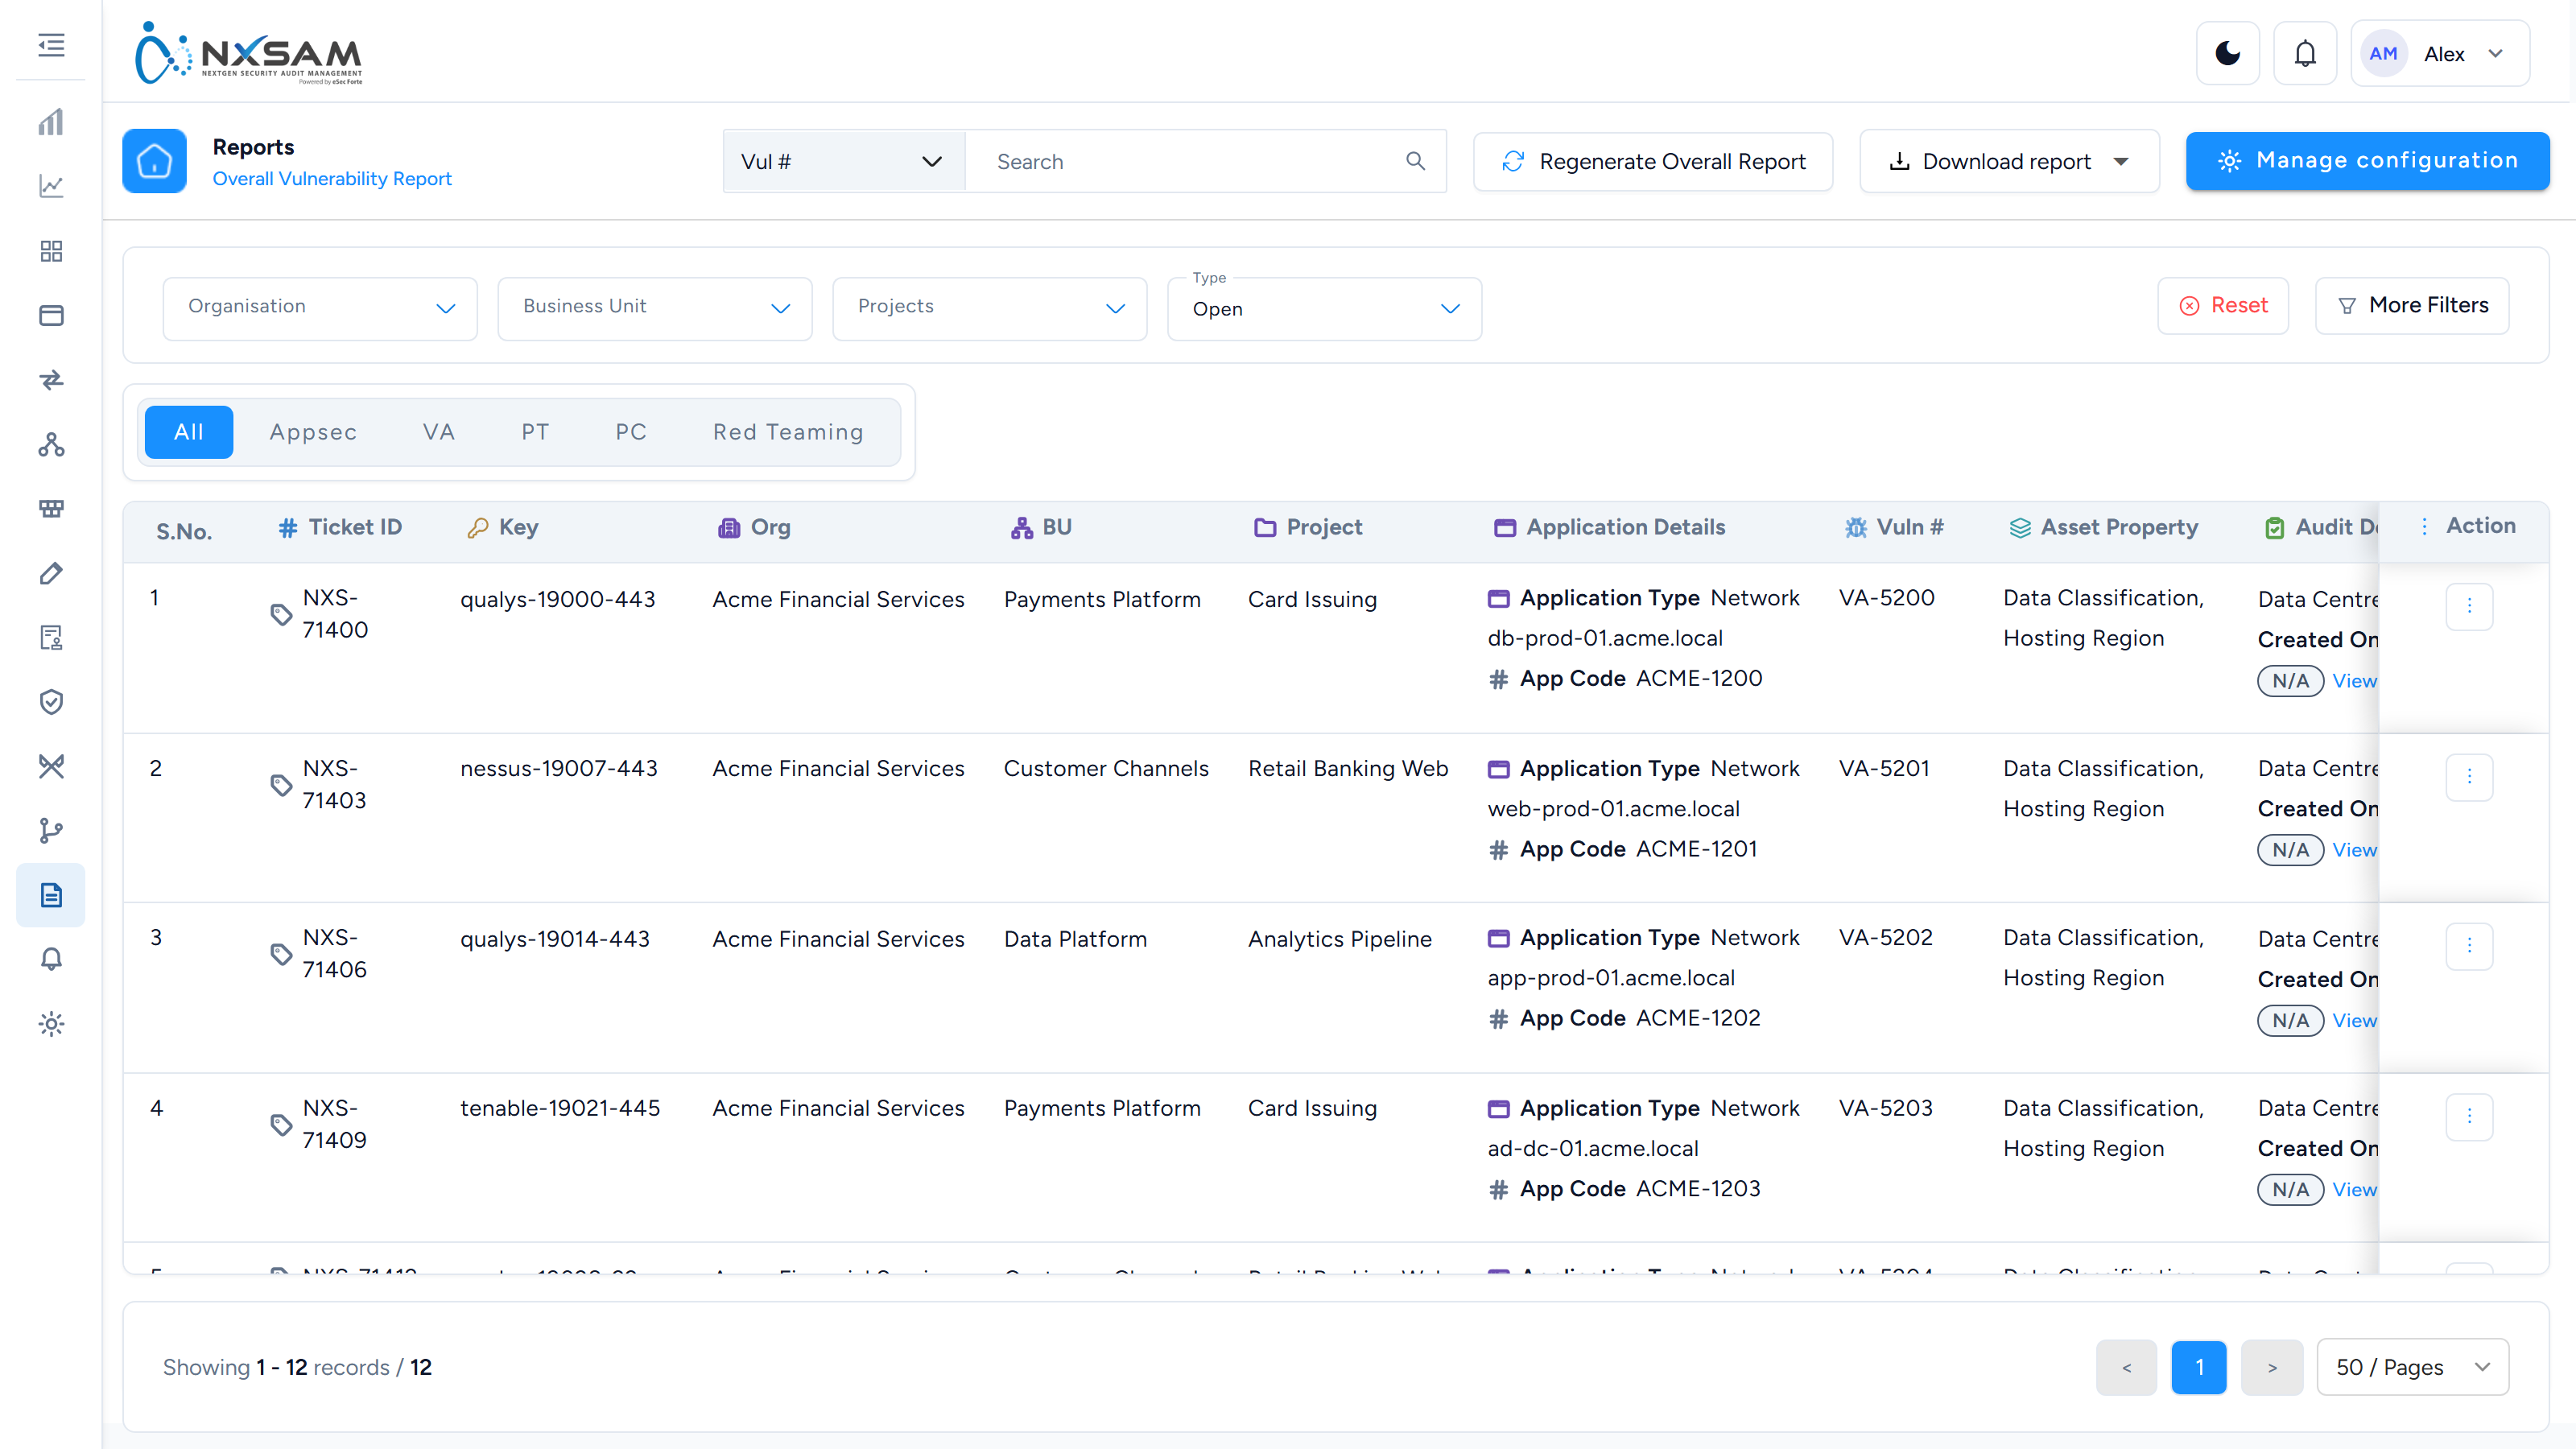
Reports: support reference
Internal. The customer-facing explanation is in How a report is produced and the screen reference.
Report tickets divide almost evenly between "it never arrived" and "the numbers are wrong", and the two need completely different investigations.
Generation is asynchronous
Requesting a report queues it. The Download column on a template shows the queue state rather than a link, and only a completed job offers the file.
| State | Means |
|---|---|
| Completed | The file exists and can be downloaded |
| In Progress | Still generating — the request was accepted |
| Failed | Carries an error; the request was accepted and did not finish |
"Nothing happened when I clicked Generate" is nearly always a job that is still running or that failed with a message nobody opened.
Time Taken is an early warning
Reports Management records how long each generation took. A report that normally takes two minutes and now takes twenty is heading for a timeout, and the trend is visible here before anyone reports a failure.
When a report begins failing, compare its recent durations before investigating anything else — a scope that has grown is the most common cause, and the fix is narrowing the report rather than retrying it.
"It generated but never arrived"
Assessment reports are emailed, and Size (MB) is on the list for a reason. A report larger than the customer's mail gateway limit generates successfully and is silently dropped in transit.
Check, in order:
- The size of the generated file.
- The email log — whether the message was queued, sent or failed.
- The recipient list on the schedule, if it was a scheduled report.
A message that was queued and never sent is a mail-server problem, not a reporting one.
"The numbers are wrong"
Almost always one of the platform counting rules rather than a reporting defect:
- Only considered audits contribute to aggregated figures.
- Nothing is counted until its finding is approved.
- Only two statuses close a finding; Risk accepted still counts as open.
- An audit counts on the date it reached a final state.
Audit Considered is a filterable column on Report Search. Filtering to considered audits reproduces the dashboard's numbers; including everything reproduces the module screens. Comparing the two answers most disagreements directly, without anyone rebuilding a report.
Share View against Share Copy
Two different commitments, and they cannot be swapped afterwards:
- Share View — one template, one owner. Your later edits reach everyone using it.
- Share Copy — an independent template that will drift and never receive your corrections.
A customer reporting that "the corrected template is still wrong for my colleague" has a copy, not a view. The only remedy is a fresh share.
Templates and defaults
Default marks the template used when none is chosen, so changing it changes what everyone who does not think about templates produces. Worth confirming before assuming a report format changed on its own.
Manage Config decides whether the report follows relationships — pulling in the hosts an application runs on, for example. It changes both content and generation time, and is a common cause of a report that suddenly takes much longer.
The two overall report formats
The page offers Overall report and Old overall report. The older format is kept because customers build their own tooling on the export and cannot always change formats on our schedule. A customer whose parser broke has usually been moved to the new format; pointing them at the old one is a valid answer.
Clean assets are evidence
Reports carry two no-finding tables: applications with no vulnerabilities, and the audit detail for those applications. The pair is deliberate — an asset with a completed audit and no findings is evidence, and an asset with no audit is a coverage gap. They look identical if only one table is read.
What to collect before escalating
- The report queue entry — state, duration, and the error text if it failed.
- The generated file size, for delivery complaints.
- Which template was used, and whether it was shared as a view or a copy.
- For number disputes: the same figure from Report Search with Audit Considered filtered both ways.
Integrations
Integrations
NxSAM does not scan anything itself. It connects to the tools that do, collects what they find, and gives you one place to track all of it. This page explains what that connection involves and what to expect once it is running.
What an integration does
Once configured, an integration:
- Connects to the tool using credentials you supply.
- Collects findings from the scans that tool has run.
- Matches each finding against what NxSAM already knows, so an issue found again is the same issue rather than a new one.
- Files it against the right asset, in the right module.
From then on the finding behaves like any other in NxSAM: it has a severity, an SLA, an owner, and a lifecycle.
Which tools connect where
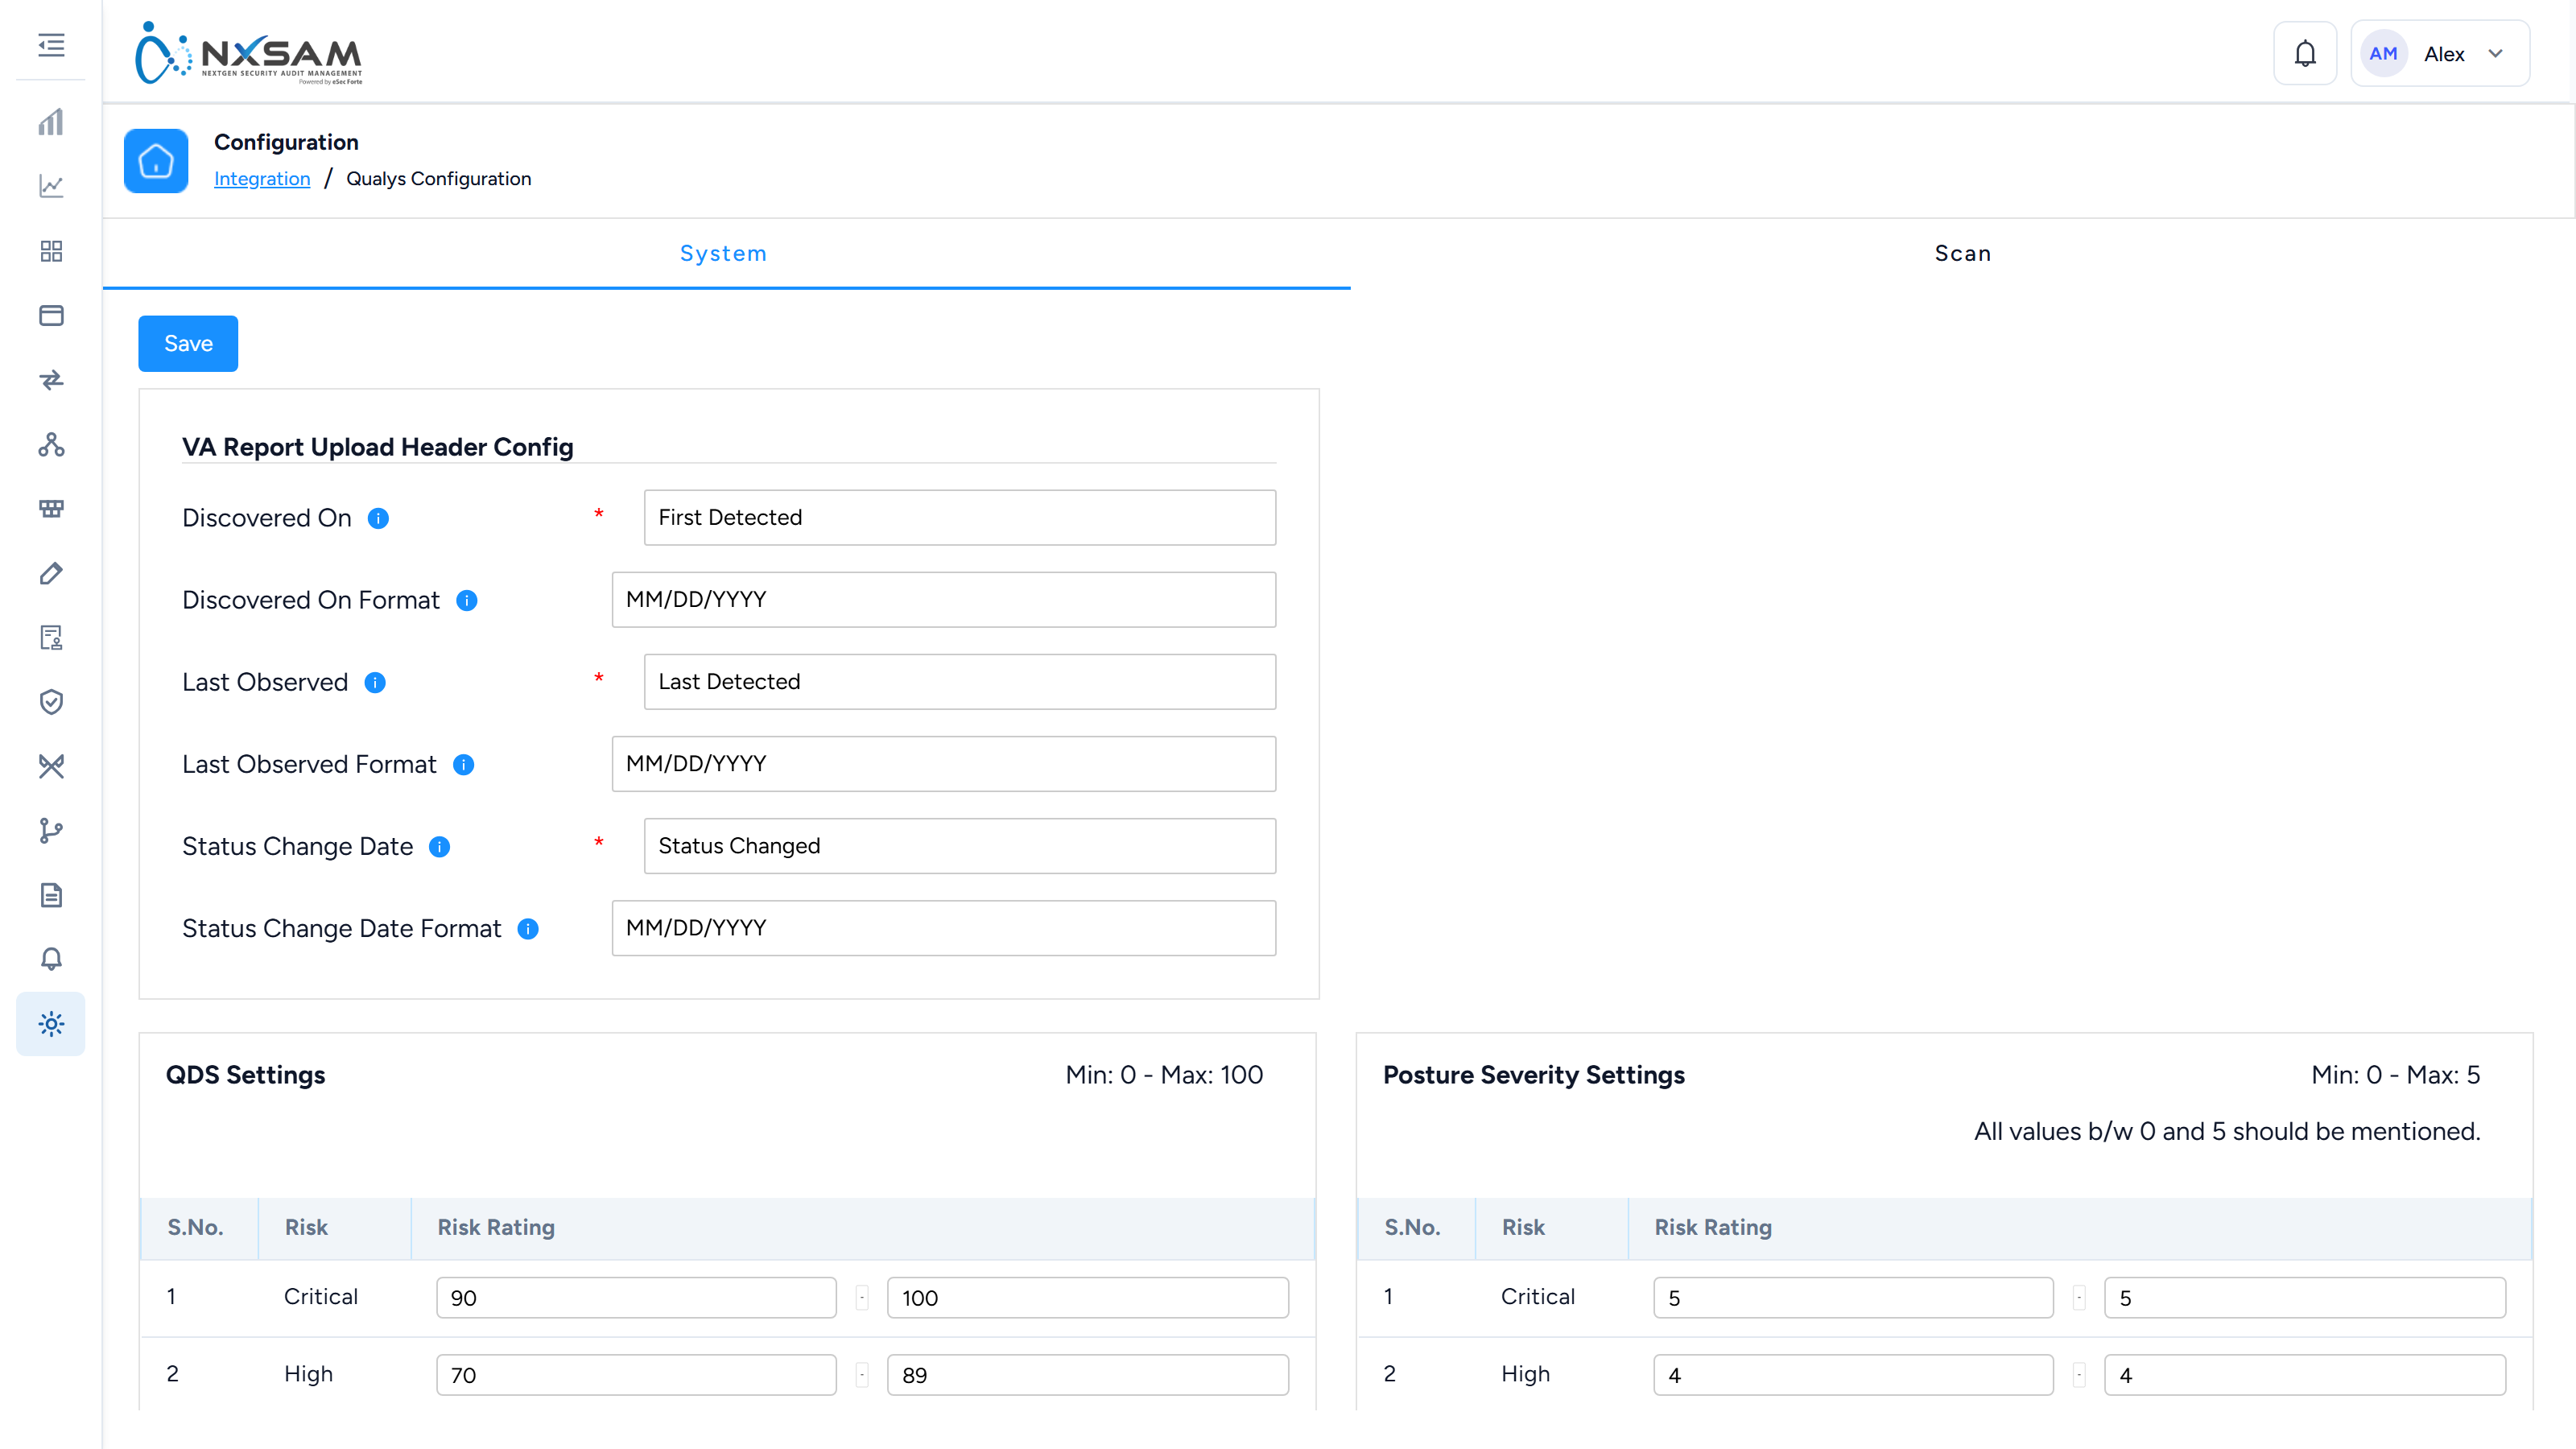
| Area | Tools |
|---|---|
| Network vulnerability assessment | Qualys · Tenable.io · Tenable.sc · Nessus · Nexpose · Cortex XDR |
| Application security | Checkmarx · Checkmarx SCA · Burp Suite · Netsparker · Acunetix · Fortify · AppScan · Snyk Code · Gitleaks · Dependency Track · JFrog Xray |
| Container security | Prisma Cloud · Twistlock |
| Cloud posture | Prisma Cloud CSPM · Cortex CSPM · SentinelOne CSPM |
Findings from a network scanner appear under Network Security; findings from an application scanner appear under Application Security, and so on. The module a finding lands in is determined by the tool it came from, not by a choice you make at import time.
What you need before you start
Three things, in this order:
- Somewhere to reach. The tool's API endpoint, reachable from the NxSAM server. If NxSAM sits behind a proxy, that is configured per integration.
- An account. A service account with API access — not a personal login. Personal accounts break when the person leaves or changes their password.
- Scope. The account must be able to see the assets you expect to import. This is the step most often missed, and it fails quietly.
Valid credentials are not the same as useful access
An account with correct credentials but no visibility of your target scope connects successfully and imports nothing. The screen shows a working connection and an empty result, which looks identical to "there is nothing to report".
If an integration connects but never brings anything in, check what the service account can see in the source tool before changing anything in NxSAM.
Setting one up
Every integration follows the same pattern:
- Go to Configurations → Integration and choose the tool.
- Enter the connection details — endpoint, port, credentials.
- Select which client the imported data belongs to.
- Save, then run a sync.
The exact fields differ per tool, but they are always some combination of where, who, and for whom.
After the first sync
Expect these, and do not treat them as faults:
- The first sync imports history. Your first import can bring in a large number of findings at once, including old ones. Subsequent syncs are much smaller.
- Ages reflect discovery, not import. A finding your scanner first saw six months ago arrives already six months old, and may already be past its SLA. This is correct — the weakness has genuinely existed that long.
- Not every finding becomes an open item. Some tools are configured to mark certain findings as false positives automatically. Your support team can explain the rules configured for your deployment.
When something looks wrong
| What you see | Usually means |
|---|---|
| Connection works, nothing imported | The service account cannot see the target scope |
| Far fewer findings than the tool reports | Automatic classification rules are filtering them |
| Counts jumped sharply after a sync | How findings are matched has changed — raise with support |
| Findings you closed have come back | The scanner still sees them; closure needs re-validation |
For the rules behind these, your support team has the detailed reference.
Connect a scanner, end to end
Connecting a tool is four decisions and one test. Getting the decisions right first saves the reconciliation afterwards.
Before you start
| You need | From whom |
|---|---|
| The endpoint URL for your region | The tool's administrator |
| An account with API access enabled | The tool's administrator |
| Confirmation of what that account can see | The tool's administrator |
| Network reachability, including any allow-list | Your network team |
Ask what the API account can see, not what your account can see
This is the failure that wastes the most time. The connection succeeds, the account signs in, and it can see none of the scans — because scope in the scanning tool is granted per account and yours is not the one NxSAM uses.
1. Choose the right integration
Several vendors appear more than once, and the entries are not interchangeable:
- Checkmarx, Checkmarx SCA and Checkmarx Standalone SCA are three integrations. SCA covers third-party libraries rather than your code.
- Prisma Cloud appears twice — once for container security, once for cloud posture — with separate credentials.
Connecting the wrong one produces an integration that works and populates nothing.
2. Enter the connection
Configurations → Integration, then the tool.
Supply the URL, port, credentials and the client the imported data belongs to.
3. Map the columns
Report-based and several API integrations map the tool's columns onto NxSAM's fields. Two groups matter.
Dates — each date names both the column and the format it is written in:
- Discovered On, with its format
- Last Observed, with its format
- Status Change Date, with its format
A wrong date format is worse than a missing one
03/04/2026 is a valid date in two formats five weeks apart. A missing date is rejected
and reported. A misread one is imported and silently wrong, and it shifts every SLA
calculation built on it.
Check the format against a current export from the tool, not against its documentation — vendors change export defaults between versions.
Identity — which column decides that an incoming finding is one NxSAM has seen before.
Changing identity later splits your history
Change it after data exists and the next import will not match the previous data: existing findings stop being observed while fresh copies arrive with no history, and counts appear to double.
It is not undone by changing the setting back. Decide it before the first sync.
4. Test the connection
Use Test Connection before saving. Several integrations will not save an enabled connection that has not been tested — deliberately, because a typo in the URL otherwise surfaces days later as an empty sync.
5. After the first sync
The first collection takes substantially longer than later ones; it has history to fetch. Then check three things:
- Did unexpected assets appear? Some integrations create assets for scan targets NxSAM did not know about.
- Did audits appear that nobody created? Several integrations create an audit per scan. That is normal — the control is the integration's scope, not deleting audits.
- Do the counts roughly match the tool? Small differences are deduplication; large ones are scope.
6. Confirm coverage, not just import
A clean import says nothing about what was missed. For Tenable, the IO tab compares the two asset lists directly:
- Tenable IO Only — hosts being scanned that NxSAM has no asset for, so their findings have nowhere to land.
- NxSAM Only — assets you believe are being assessed and are not. This is a coverage gap, and it is the number worth acting on.
When something looks wrong
| Symptom | Usual cause |
|---|---|
| Authenticates, imports nothing | API account scope |
| Fails like a wrong password | Wrong regional endpoint |
| Dates are weeks out | Date format mapping |
| Counts doubled after an import | Identity configuration changed |
| Fewer findings than the tool shows | Import classification rules (Checkmarx-style) |
| Module still empty after connecting | The other integration of the same vendor |
How an import actually runs
This is the path a finding takes between a scanner and a screen, and the places it can stop. Most "the import did not work" tickets are the import working correctly at a stage the reporter cannot see.
Nothing happens synchronously
Submitting an import does not process it. It writes a queue entry and returns. A worker picks the entry up afterwards and does the work.
That is why the upload succeeds instantly and the data appears minutes later, and why "the upload worked but nothing changed" is the normal appearance of a queued job, not evidence of a failure.
upload → staged → queued → worker consumes → matched → filed → visible
The five stages, and what failure looks like at each
| Stage | What happens | If it stops here |
|---|---|---|
| Upload | The file is accepted and stored | An immediate error on screen — the only stage that reports failure to the person who triggered it |
| Staging | Rows are parsed into staging | Rows are set aside as failed with a per-row reason; the job still reports as processed |
| Queue | A message is published to RabbitMQ | Status stays PENDING indefinitely — the queue took it, nothing is consuming |
| Worker | A consumer processes the message | Status goes to FAILED, or sticks at IN PROGRESS if the worker died mid-message |
| Merge | Rows are matched and written to live tables | Data is present but attached to the wrong asset, or duplicated |
Queue status is one of PENDING, IN PROGRESS, COMPLETED, FAILED. The tool-sync
queues additionally use a partially completed state, which means exactly what it
says: some hosts or assets in the batch succeeded and others did not, and the job will
not be retried automatically.
COMPLETED does not mean every row was imported
A job completes when the worker finishes processing the message. Rows rejected during staging had already been set aside as failed before the worker ran. A completed import with fewer findings than the source file is the expected outcome of a partly invalid file — not a contradiction.
Check the failed-row count before concluding the import lost data.
Where to look, in order
- Process Manager — is the job
PENDING,IN PROGRESS,FAILEDorCOMPLETED? This answers "is it stuck or is it working" in one look, and it is the first thing to check on any import ticket. - The import queue log — per-job history, including how long it took. A job that normally takes two minutes and has been running for forty has not hung by design.
- Failed rows — the per-row rejection reasons. Almost always a column mapping problem or a date format the parser did not accept.
- The module screen — with the audit filter cleared. Findings do arrive but land against a different audit than expected more often than they go missing.
Nothing is moving at all
If every job across every module is PENDING, the problem is not the import. Either the
message broker is not reachable or no workers are running, and the same symptom will show
on scheduled reports and outbound email, because they use the same queues.
Confirm by checking whether a report queued now also stays pending. If it does, this is an infrastructure question, not a data one.
Matching: why a re-import does not double everything
Each finding is matched against what NxSAM already holds before it is written. A finding seen before updates the existing record and keeps its history, its SLA clock and its ownership; only genuinely new findings are created.
Two consequences worth knowing:
- Re-importing the same file is safe. It will not duplicate findings. It will,
however, update
last seendates, which shifts what "recently detected" shows. - If matching changes, history splits. Change the fields that identify a vulnerability and the next import will not recognise existing findings as the same ones. They will be created fresh — the old ones stay open with no new sightings, the new ones arrive with no history. This is the single most disruptive configuration change available in the product, and it is not reversible by changing the setting back.
Timing and the "missing" findings
The asset must exist before the finding can attach to it. An import that references an asset NxSAM does not have will either create it or reject the row, depending on the module. Where assets come from a synchronised source, an import that runs before the asset sync completes can reject rows that would have succeeded twenty minutes later.
If an import failed once and succeeded on retry with no change made in between, this is almost always the reason.
Setting up each integration
What each connection needs, what it contributes, and the thing about it that most often goes wrong. Nineteen integrations share four patterns — read the pattern first, then the tool.
The four patterns
| Pattern | Tools | What NxSAM does |
|---|---|---|
| API pull | Qualys, Tenable, Nexpose, Prisma, Cortex XDR, CSPM | Connects on a schedule and collects completed scans |
| API pull with project mapping | Checkmarx, Fortify, AppScan, Snyk, Gitleaks, JFrog, Dependency Track | As above, plus a decision about which project maps to which asset |
| Report upload | Burp Suite, Netsparker, Acunetix | You export from the tool; NxSAM parses the file |
| Posture pull | Prisma CSPM, SentinelOne CSPM, Twistlock | Cloud or container posture rather than vulnerabilities |
The pattern decides where a failure can occur. An API pull can fail on credentials, authorisation or reachability. A report upload cannot — it fails on parsing instead.
What every API integration needs
- An endpoint URL. Region-specific for several vendors. A wrong region fails authentication in a way that looks exactly like a wrong password.
- An account with API access enabled. Separate from console access in most tools. A security team will often issue a console login and assume it works.
- Scope granted to that account. This is the one that bites: the connection succeeds, the account signs in, and it can see none of the scans. Ask the tool's administrator what the API account can see, not what your own account can see.
- Network reachability, including any IP allow-list on the vendor side.
Column mapping: what it is and why it matters
Report-based and several API integrations map the tool's columns onto NxSAM's fields. Two groups of settings do this.
Date fields. For Qualys and Tenable, the mapping names the column in the uploaded report that holds each date, and the format that column is written in:
- Discovered On, with its Discovered On Format
- Last Observed, with its Last Observed Format
- Status Change Date, with its Status Change Date Format
Tenable repeats the same three pairs for Policy Compliance, and adds a Key Header naming the column that identifies a vulnerability — the one used for matching when Enable Key for VA Vulnerability is on.
A wrong date format is worse than a missing one
03/04/2026 is a valid date in two formats five weeks apart. A missing date is
rejected and reported; a misread one is imported and silently wrong, and it shifts
every SLA calculation built on it.
Check the format against a current export, not against the documentation — vendors change export defaults between versions.
The vulnerability key. This names the column NxSAM matches on to decide whether a finding is one it has seen before. Changing it after data exists splits history: existing findings are no longer recognised, so they stay open with no new sightings while fresh copies arrive with no history. It is not reversible by changing the setting back.
Checkmarx: the approval rules
Checkmarx integrations carry an extra step no other tool has. Checkmarx records a triage state per result, and the integration translates that into NxSAM's own states through three configurable rules:
| Rule | Decides |
|---|---|
| Approval state | Which Checkmarx value means the finding is confirmed |
| Non-approval state | Which value means it is not yet confirmed |
| False positive state | Which value means it was dismissed |
Each rule is a comparison against a named column of the uploaded report.
This is why the same Checkmarx scan can produce very different NxSAM results at two customers: the rules encode how that organisation uses Checkmarx triage. If findings arrive already approved when they should be pending, or false positives arrive as open findings, these three rules are the cause — not the import.
Per-tool notes
Network vulnerability assessment
- Qualys — the widest column mapping. Also supports QDS-to-severity mapping, so severity can follow the Qualys Detection Score rather than CVSS.
- Tenable — one integration covers Tenable.io, Tenable.sc and Nessus, on three tabs: System, SC and IO. It carries two header sets, one for VA and one for Policy Compliance.
- Nexpose — API pull; findings land in Network VA alongside the others.
- Cortex XDR — a newer source, using endpoint host insight data as VA findings. Ships unconfigured; the screen shows a prompt until credentials are entered.
Application security
- Checkmarx / Checkmarx SCA / Checkmarx Standalone SCA — three separate integrations. SCA covers third-party libraries, not your code, and standalone SCA runs independently of the main platform. Connecting the wrong one is a common first-time error.
- Fortify, AppScan, Snyk Code — static analysis. Project-to-application mapping is the setup step that matters.
- Burp Suite, Netsparker, Acunetix — dynamic. Report upload rather than API pull, so the failure mode is parsing rather than authentication.
- Gitleaks — secrets in source control. Findings are credentials, so treat the finding detail itself as sensitive.
- JFrog Xray, Dependency Track — composition analysis. Dependency Track works from an SBOM rather than from a scan, so it reports on what you declare rather than what it finds.
Container and cloud
- Prisma Cloud — appears twice, as container security and as CSPM. They are separate integrations with separate credentials despite the shared vendor.
- Twistlock — the earlier name for the Prisma container product; present for deployments still running it.
- Cortex CSPM — Palo Alto's posture platform, feeding the CSPM screens (Assets, Issues, Cases, Rules, Policies) rather than the Prisma ones. The connection takes the tenant's FQDN, an API Key ID and the API Key, with an optional proxy; Test Connection checks them before saving. It then has two sync actions, and the order matters: Master Sync first, which brings the rules and policies, then Sync, which brings assets, issues and cases against them. A sync run before the master sync has nothing to attach issues to.
- SentinelOne CSPM — an alternative posture source, also feeding the CSPM screens. One Data Sync action brings everything.
Prisma CSPM and Cortex/SentinelOne CSPM are different screens
Prisma feeds the four Prisma CSPM screens; Cortex and SentinelOne feed the five CSPM screens. Connecting one does not populate the other, and an empty CSPM module after a successful Prisma sync is expected rather than a fault.
Three integration screens log a template error on load
Checkmarx, Checkmarx SCA and Fortify each report an unknown-property binding in the browser console. The tabs work and the integration functions. It is a known product defect, not a sign of a broken connection.
After the first sync
Expect the first collection to take substantially longer than later ones — it has history to fetch. Check three things once it completes:
- Did assets get created that you did not expect? Some integrations create assets for scan targets NxSAM does not know about.
- Did audits appear that nobody created? Several integrations create an audit per scan. That is normal; scoping what the integration collects is the control.
- Do the counts roughly match the tool? Small differences are deduplication. Large ones are scope — the API account seeing more or less than you assumed.
Reconciling the asset list with Tenable
The Tenable IO tab compares its asset list against NxSAM's and reports the overlap, which answers question 3 directly rather than by inference. Generate produces a summary; Refresh re-reads the latest one.
| Column | What it means |
|---|---|
| Common IPs (Both) | Hosts both systems know about — the healthy case |
| Tenable IO Only | Hosts Tenable scans that NxSAM has no asset for |
| Scanned by Tenable | Of the common hosts, how many Tenable has actually scanned |
| NxSAM Only | Assets in NxSAM that Tenable is not scanning |
| Status, Initiated at | The comparison job itself |
The two "only" columns are the ones to act on, and they mean opposite things:
- Tenable IO Only is data you collect but do not manage — findings on those hosts have nowhere to land.
- NxSAM Only is a coverage gap: assets you believe are being assessed and are not. A clean NxSAM with a large NxSAM-Only count is not a healthy estate, it is an unscanned one.
Run this before trusting a first sync
A sync that imports cleanly still tells you nothing about what it missed. This comparison is the only place in the product that shows the difference between the two inventories, and it is quicker than reconciling two exported spreadsheets.
Integrations: every screen, column and action
Complements Setting up each integration. This page covers the screens themselves — the mapping tables, the sync queues and the vulnerability catalogues behind them.
Project mapping — the screen most tickets are about
Every code-scanning integration shows the same table: the tool's projects on the left, your NxSAM assets on the right, and whether they are joined.
| Column | What it holds |
|---|---|
| Project Details / Original Project Details / ProjectVersion Details | The project as the tool names it |
| Asset Details / Mapped Asset Details / SSC Project | The NxSAM asset it feeds |
| Account | Which tool account it came from, where the integration serves several |
| Mapping Status | Whether a mapping exists |
| Sync Status | Whether the last sync succeeded |
| Last Sync Time | When it last ran |
Unmapped means collected and discarded
A project with no mapping is visible to the integration and has nowhere to file its findings. The sync reports success, and nothing appears in the module.
"The scan ran but there are no findings in NxSAM" is this, far more often than it is a credential or a parsing problem. Check Mapping Status before anything else.
Mapping Status and Sync Status are independent. A mapped project can fail to sync, and an unmapped project can sync successfully and file nothing. Reading only one of the two gives the wrong diagnosis.
Checkmarx additionally distinguishes Original Project Details from Project Details — the project as first discovered against its current name — so a renamed project stays recognisable rather than appearing as a new one.
Container and cloud sync queues
Prisma reports Sync Type, Image Type, Status, Initiated at, Completed at.
Image Type separates deployed images from those merely present in the registry. Syncing everything in a registry produces findings on images nobody runs, which is the usual cause of a container backlog that nobody can prioritise.
Cortex XDR endpoints
| Column | What it holds |
|---|---|
| Endpoint Name | The host as the agent reports it |
| IP Address(es) | Every address it has — plural because endpoints move |
| Status | Whether the agent is connected |
| Platform | Operating system |
| Group | The agent's grouping |
| Alias | An alternative name |
| First Seen / Last Seen | The window over which the agent has reported |
IP Address(es) and Alias together are why endpoint matching is harder than host matching. A laptop has several addresses over time and may be known by a different name in your CMDB. An endpoint that will not match an existing asset usually needs the alias, not the address.
Connection tables
Each tool integration lists its configured connections:
| Column | What it holds |
|---|---|
| ID | The connection |
| Clients / Organization | Which of your organisations it serves |
| URL / Base URL and Port | Where the tool is |
| Last Sync / Latest Config Sync | When data and configuration were last pulled |
Last Sync and Latest Config Sync are different clocks. Configuration sync pulls the tool's projects, policies and scanner definitions; data sync pulls findings. A connection with recent findings and stale configuration will not know about projects created since, which is a common cause of a new project never appearing for mapping.
Clients matters because one scanner installation often serves several organisations. A connection scoped to the wrong client files findings against the wrong tenant.
Severity mapping
Qualys and Tenable both expose a Risk to Risk Rating table: the tool's own risk value
on the left, the NxSAM severity it becomes on the right. Qualys additionally maps by
Scanner, Org and BU, with Configured showing whether a mapping has been set.
Changing this re-classifies existing findings, because severity is derived rather than stored — the same trap as the CVSS configuration.
Qualys also carries Asset Property Name / Asset Property Value, which copies a scanner
attribute onto the NxSAM asset during sync, so scanner-side grouping survives the import.
Policy mapping
Policy ID, Policies, Created On, Modified On, Audit Files, Configuration —
maps a Policy Compliance benchmark to the tool policy that implements it. Audit Files
are the source reports; Modified On is what tells you a mapping changed between two
runs that produced different numbers.
Audit Files opens a dialog listing each file behind the mapping: Title, Type,
Template, File Name, Created On, Modified On. It exists so that "which benchmark
file did this policy actually run" can be answered from the mapping rather than from the
scanner — two mappings with the same policy name and different audit files are different
benchmarks, and produce different numbers legitimately.
On the Tenable configuration, postures that came from a Tenable scan rather than from an uploaded report are marked Scanned by Tenable, which is how to tell the two sources apart when both feed the same audit.
Nexpose configuration reference
Character, Description, Example — the escaping and wildcard syntax accepted in
Nexpose configuration fields, with a worked example for each. It is reference material
rather than a working screen, and it is there because the syntax is not guessable.
Scan profiles
Where an integration launches scans rather than only collecting them, Sync Profile pulls the profile definitions from the tool and Profile Details shows what a profile contains — which checks it runs, and against what.
Reading the profile matters when results look thin: a scan that completed against a profile covering forty checks is not evidence of a clean host, and the profile is the only place that distinguishes "nothing found" from "little looked for".
Vulnerability master catalogues
One per tool. The richest are the network scanners:
Qualys — QID, Title, Vuln type, Category, Group, Sub Group, Severity,
Exploitable, Patchable, False Positive.
Nexpose — VID, Nexpose ID, Title, Category, Group, Sub Group, Severity,
Exploitable, False Positive.
Nessus — ID, Name, Group, Sub Group, Version, Exploitable, Risk,
False Positive, plus Family ID, Family Name and Family Type. Nessus organises
plugins into families, and the family is often the useful unit: excluding a whole family is
a single decision where excluding its plugins individually is dozens.
Snyk Code — Rule ID, NAME. Acunetix — VID, VNAME. Dependency Track —
UUID, Name. Network and Red Teaming — ID, Title.
AppScan and Netsparker carry Audit Exception and Client Exception — whether an
issue is excluded for one audit or for the whole client. The two are separate because a
finding irrelevant to one assessment is not necessarily irrelevant everywhere, and
recording it at the wrong level either suppresses too much or too little. Netsparker also
carries Issue Type.
Exploitable, Patchable and False Positive are catalogue-level flags
They apply to the vulnerability definition, not to one occurrence. Marking a QID as a false positive in the catalogue affects every finding of that QID, across every host and every audit, including ones imported in future.
That is the right tool for a check your environment genuinely never fails, and the wrong one for a single host where the finding does not apply — use the finding's own status for that.
Patchable is Qualys-specific and worth using: it separates findings a patch resolves from those needing a configuration change, which are different pieces of work assigned to different people.
Qualys detail
ID, URL, Threat Intel, Remote, Authentication Type, Additional Info, Type,
Section, Description, SRC NAME, REF, Link, MW TYPE, MW PLATFORM, MW ALIAS,
MW RATING, Comments.
The MW fields are malware association — type, platform, alias and rating. A vulnerability
with a malware rating is one being actively used, which outranks a higher CVSS score with
no known exploitation.
Remote and Authentication Type say whether the check ran across the network or needed credentials. An unauthenticated scan that found nothing on a host is much weaker evidence than an authenticated one, and this is where you confirm which it was.
Nexpose detail
Solution Type, Summary, Title, Description — Solution Type distinguishes a
patch from a workaround from a configuration change.
Vulnerability mapping tables
One per tool, all the same shape: ID., <Tool> Issue, Issue Master.
This is what makes the same weakness from two scanners one finding rather than two. The tool's own issue identifier on the left, the NxSAM master entry on the right. Acunetix, Burp Suite, Checkmarx, Checkmarx SCA, Dependency Tracker, Fortify, Gitleaks, JFrog X-Ray and Netsparker each have one — the JFrog X-Ray Issue column, for example, holds the identifier as Xray reports it.
An unmapped tool issue produces findings that do not deduplicate against anything, so the same vulnerability found by Checkmarx and Burp appears twice with separate SLAs. When a customer reports duplicate findings across tools, this table is the answer.
How findings are identified, matched and classified on import
When a scan is imported, NxSAM has to decide, for every row, whether it is a finding it has seen before or a new one. That single decision drives almost everything downstream: whether an item is reopened or created, whether its age and SLA continue or restart, and whether closed findings come back.
Nearly every "the numbers jumped after a scan" escalation traces to this page.
Network VA: the vulnerability key
Default behaviour
Out of the box, Enable Key for VA Vulnerability (Configurations → System → System Settings) is off. With it off, a VA finding's identity is the tool's own identifier (the track ID) carried in the scan file.
The setting applies to Nessus VA uploads only. When it is on, findings are matched using the Key Columns / Key Header set on the Tenable configuration page.
That is usually what you want, and it means identity is entirely the scanner's opinion. It also means that if the scanner changes how it issues identifiers — a plugin rewrite, a platform migration, a different export format — NxSAM sees a completely new set of findings, and the previous ones stop being observed.
When the key is enabled
With the setting on, NxSAM builds its own composite key from columns you choose, joined by a configured separator. The available parts are:
| Part | Notes |
|---|---|
| Port | Empty is coerced to 0; must otherwise be numeric |
| Protocol | Empty is coerced to 0 |
| Plugin ID | Must be numeric |
| Host IP | |
| Host Master ID | Must be numeric |
A manual upload may also carry an explicit key column. If that column is present and its value is valid, it wins outright — the configured columns are not consulted.
The three behaviours that surprise people
Changing the key columns redefines what 'the same finding' means
The key is what matches an incoming row to an existing record. Change the columns and the next import will not match the previous data: existing open findings stop being observed, and their equivalents arrive as brand-new findings. Counts appear to double.
Treat a change to VA key columns as a data migration, not a preference. Plan it, and expect a one-off discontinuity in trend charts.
An empty port and port zero are the same identity
Port and Protocol are coerced to 0 when blank. A finding with no port recorded and a
finding on port 0 therefore produce the same key. On hosts where the scanner omits
port for some plugin types, distinct findings can collapse into one.
Invalid key parts are dropped, not rejected
If a configured part is missing or fails its type check — a non-numeric Plugin ID, for example — that part is discarded and the key is built from whatever remains. The import does not fail. It records the invalid parts and proceeds with a shorter, less specific key, which matches more loosely than intended.
If every part is invalid, identity falls back to the tool's track ID.
Support check: when VA counts move unexpectedly after an import, establish first whether the key is enabled, and whether the incoming file actually carries every configured column. A column that is present in one export format and absent in another is the usual cause.
Application security: automatic classification on import
Tool integrations such as Checkmarx do not merely import findings — they can classify them on the way in. The configuration takes the shape:
when report field matches condition / value → mark as approved, not approved, or false positive
Three mappings are configured per tool: an approval condition, a non-approval condition, and a false-positive condition, each with its own field and comparison value.
The consequences worth knowing:
- A finding auto-marked false positive never enters the open population. It is not hidden by a filter; it was classified at import. Someone looking for it in the open list will not find it, and nothing on that screen explains why.
- Changing the mapping does not reclassify history. It applies to subsequent imports only. After a mapping change, older findings and newer ones will have been judged by different rules.
- Unmatched findings fall through to the default. A finding matching none of the three conditions is not classified by this mechanism at all.
Support check: "the scan had 800 findings but NxSAM shows 600" is usually the approval or false-positive mapping doing its job. Compare the tool's own report against the configured conditions before treating it as data loss.
What each integration actually needs
Credentials differ by tool, but the shape is consistent — a reachable endpoint, an account, and a scope. For example, a Qualys connection is defined by:
| Field | Purpose |
|---|---|
| URL | The Qualys API base URL for your platform. Platform-specific — the wrong regional URL authenticates but returns nothing. |
| Port | Usually 443. |
| Username / Password | An API-capable service account, not an interactive user. |
| Client | Which NxSAM tenant the imported data belongs to. |
Cloud integrations such as Prisma follow the same pattern on their own configuration form (Configurations → Integration → Prisma): an Enable toggle, API URL, Username and Password, and a Use Proxy toggle that reveals a Proxy URL when on.
The Enable toggle and Test Connection are paired deliberately — the form will not save an enabled integration whose connection has not been tested, which is what stops a typo in the API URL from being discovered days later by an empty sync.
Two failure modes look identical from the UI
A connection that authenticates but returns nothing looks exactly like a connection that is working and genuinely has nothing to report. Distinguish them by checking whether the account's scope covers the assets you expect — the most common cause is a service account with valid credentials but no visibility of the target scope.
Triage order for import problems
- Did the count jump or double? → VA key columns changed, or a column is missing from the new export format.
- Are findings missing entirely? → auto-classification mapping (AppSec), or account scope (any tool).
- Did findings reopen unexpectedly? → identity changed, so previously matched records no longer match.
- Did nothing import at all? → authentication succeeded but scope is empty; check the service account's permissions, not the credentials.
Integration errors and what they mean
Support-facing. The failures that actually get raised, what each one is telling you, and what to do about it. Ordered roughly by how often they come up.
Connection and credentials
"Authentication failed" immediately after saving
The credentials are wrong, or they are right and the account lacks API access. These are different problems with the same message, and the distinction matters: a security team will often issue a console login and assume it works for the API.
Check, in this order:
- Is the account's API access enabled in the tool, separately from console access?
- Is the API URL the right one for your region or instance? Several vendors use region-specific endpoints, and a wrong region authenticates as a wrong password.
- Has the credential expired or rotated since it was entered?
The connection test passes but no data arrives
Authentication and authorisation are separate. The account can sign in; it cannot see the scans. In most tools, API accounts see only the scans, asset groups or projects they have been explicitly granted.
This is the most common integration ticket, and it is almost never an NxSAM problem. Ask the tool's administrator what the API account can see — not what your own account can see.
It worked for months and then stopped
In order of likelihood: the credential expired or was rotated; the account was disabled during a review; a network path changed (a new firewall rule, a proxy, an IP allow-list that no longer includes NxSAM); or the tool's API version was deprecated.
The last sync timestamp tells you when it stopped, which usually identifies the change.
Import and parsing
Rows rejected during staging
Almost always one of:
- Column mapping. The report has a column the mapping does not expect, or the tool changed its export format in an upgrade. Re-check the mapping against a current export rather than against the documentation.
- Date format. The mapping specifies how dates are written in the file. A file
produced with different locale settings will parse dates wrongly, or not at all — and
wrongly is worse, because
03/04/2026is valid in two formats that are five weeks apart. - A required field is empty. Some rows in an otherwise valid export genuinely lack the field NxSAM matches on.
The per-row rejection reason is recorded. Read it before theorising.
The import completed but the numbers are lower than the source
Expected when part of the file was rejected. Compare the source row count against the imported count plus the failed count. If those reconcile, nothing was lost silently.
If they do not reconcile, the difference is deduplication: the same finding appearing twice in one file is imported once.
Findings landed against the wrong asset
The identifier in the file matched a different asset than intended. Hostname-based matching is the usual culprit — short name against fully-qualified name, or two hosts sharing a name in different environments.
This is a matching-configuration question, not an import failure, and correcting it retrospectively means re-importing after fixing the identifier.
Queue and worker
Status stuck at PENDING
The message was queued and nothing consumed it. Either no worker is running for that queue, or the broker is unreachable.
Every module's imports, scheduled reports and outbound email share this infrastructure, so if this is the cause you will see all three stalled together. That correlation is the quickest way to confirm it.
Status stuck at IN PROGRESS
A worker took the message and did not finish. Usually the worker process died — a restart, an out-of-memory kill on a very large file, or a container replacement mid-job.
Unlike a failure, this does not release the message cleanly, so the job neither completes nor retries.
Status FAILED
The worker ran and raised an error. The task detail carries the reason. Common causes are a malformed file that passed staging, and a referenced asset or audit that no longer exists because it was deleted while the job was queued.
Partially completed
Specific to tool sync. Some assets in the batch synced and others did not — commonly because the API account can see some asset groups and not others, or because a subset of hosts timed out. It will not retry on its own.
Configuration
matTabContent / a blank integration screen
Three integration screens (Checkmarx, Checkmarx SCA and Fortify) log a template binding error on load. The tabs still work. This is a known product defect, recorded in the project's findings log; it is not a symptom of a broken integration.
An icon fails to load and the screen does not render
Reported on RLCM Controls and Templates. An icon is registered with a filename whose case does not match the file on disk, which resolves on Windows and 404s on Linux. Also a known defect rather than a configuration problem.
What to collect before escalating
- The integration and the tool version
- The last successful sync timestamp
- The queue status and the task detail for the failing job
- The failed-row reasons, if the job reached staging
- Whether other queues (reports, email) are also stalled
Those five answers resolve or correctly route almost every integration ticket, and the last one in particular distinguishes an integration problem from an infrastructure one.
Integrations: find the right screen
Every screen in this module, what each one is for, and where it lives. Use it to find the right screen quickly, and to confirm you are on the one a colleague means — several screens in this product have similar names and different jobs.
Screenshots come from a demonstration data set, so the figures are illustrative. Click any screenshot to open it at full resolution.
Acunetix
Dynamic application scanning.
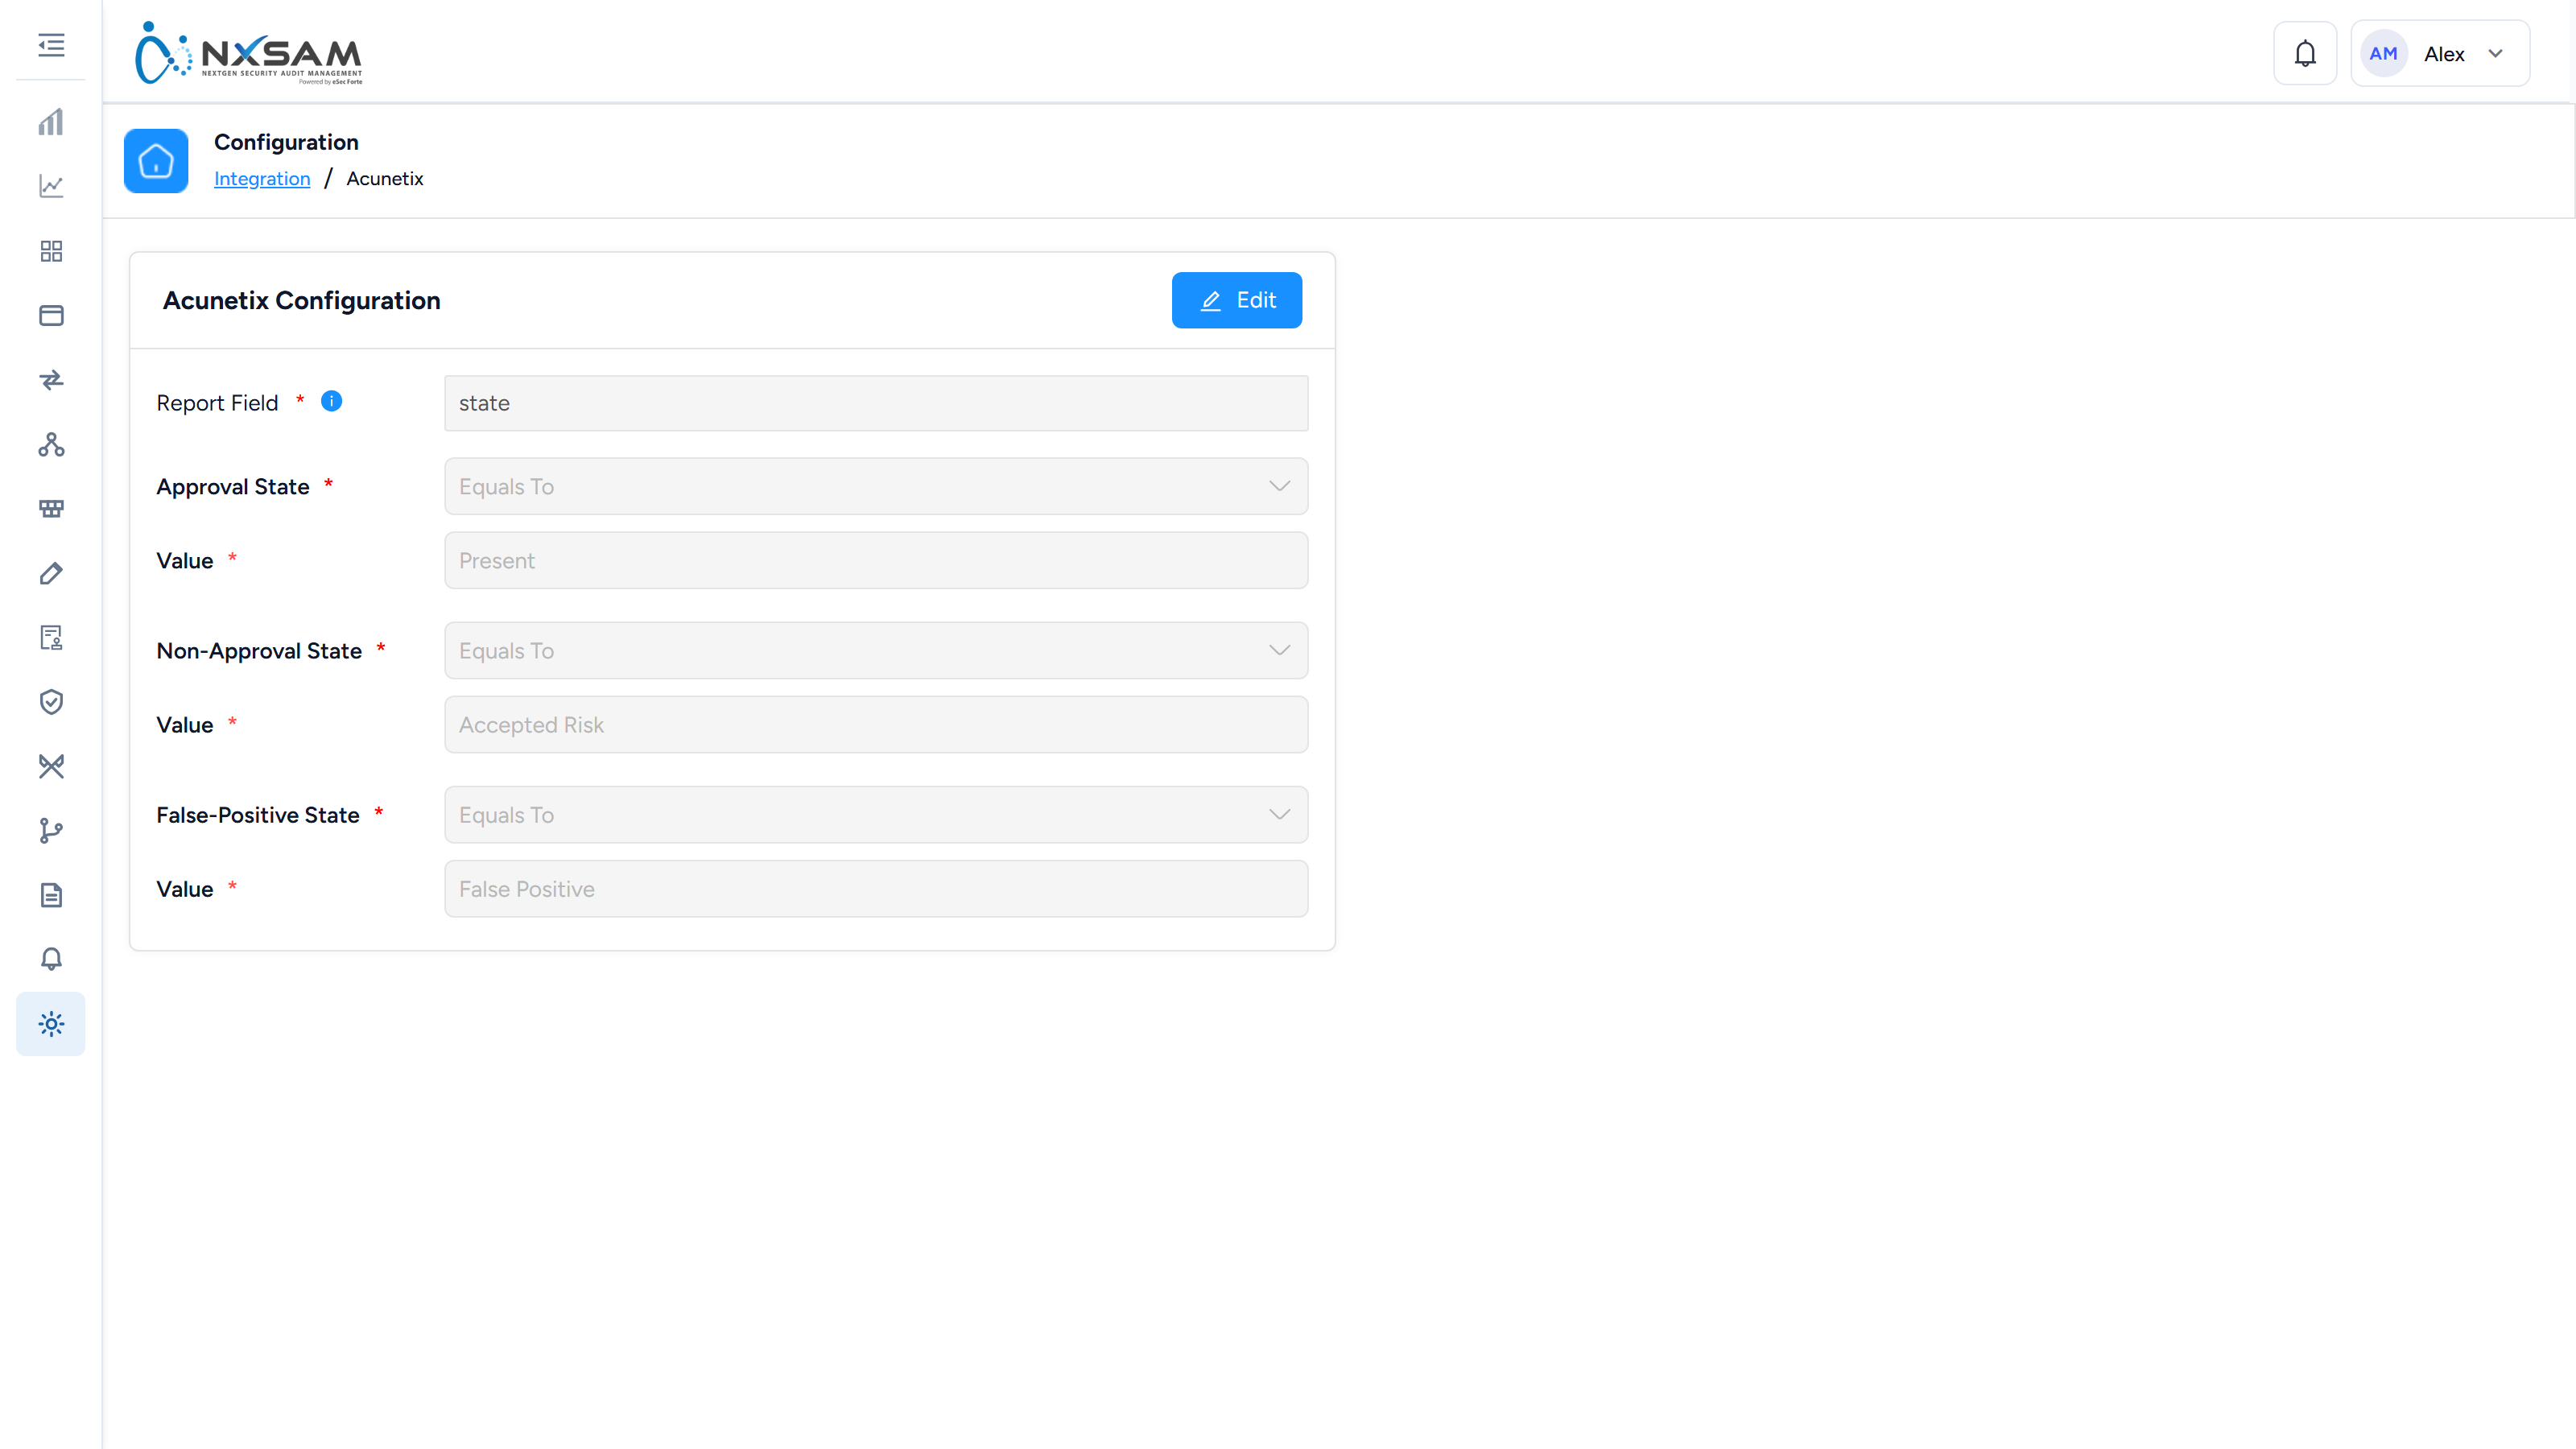
AppScan
Application security testing, static and dynamic.
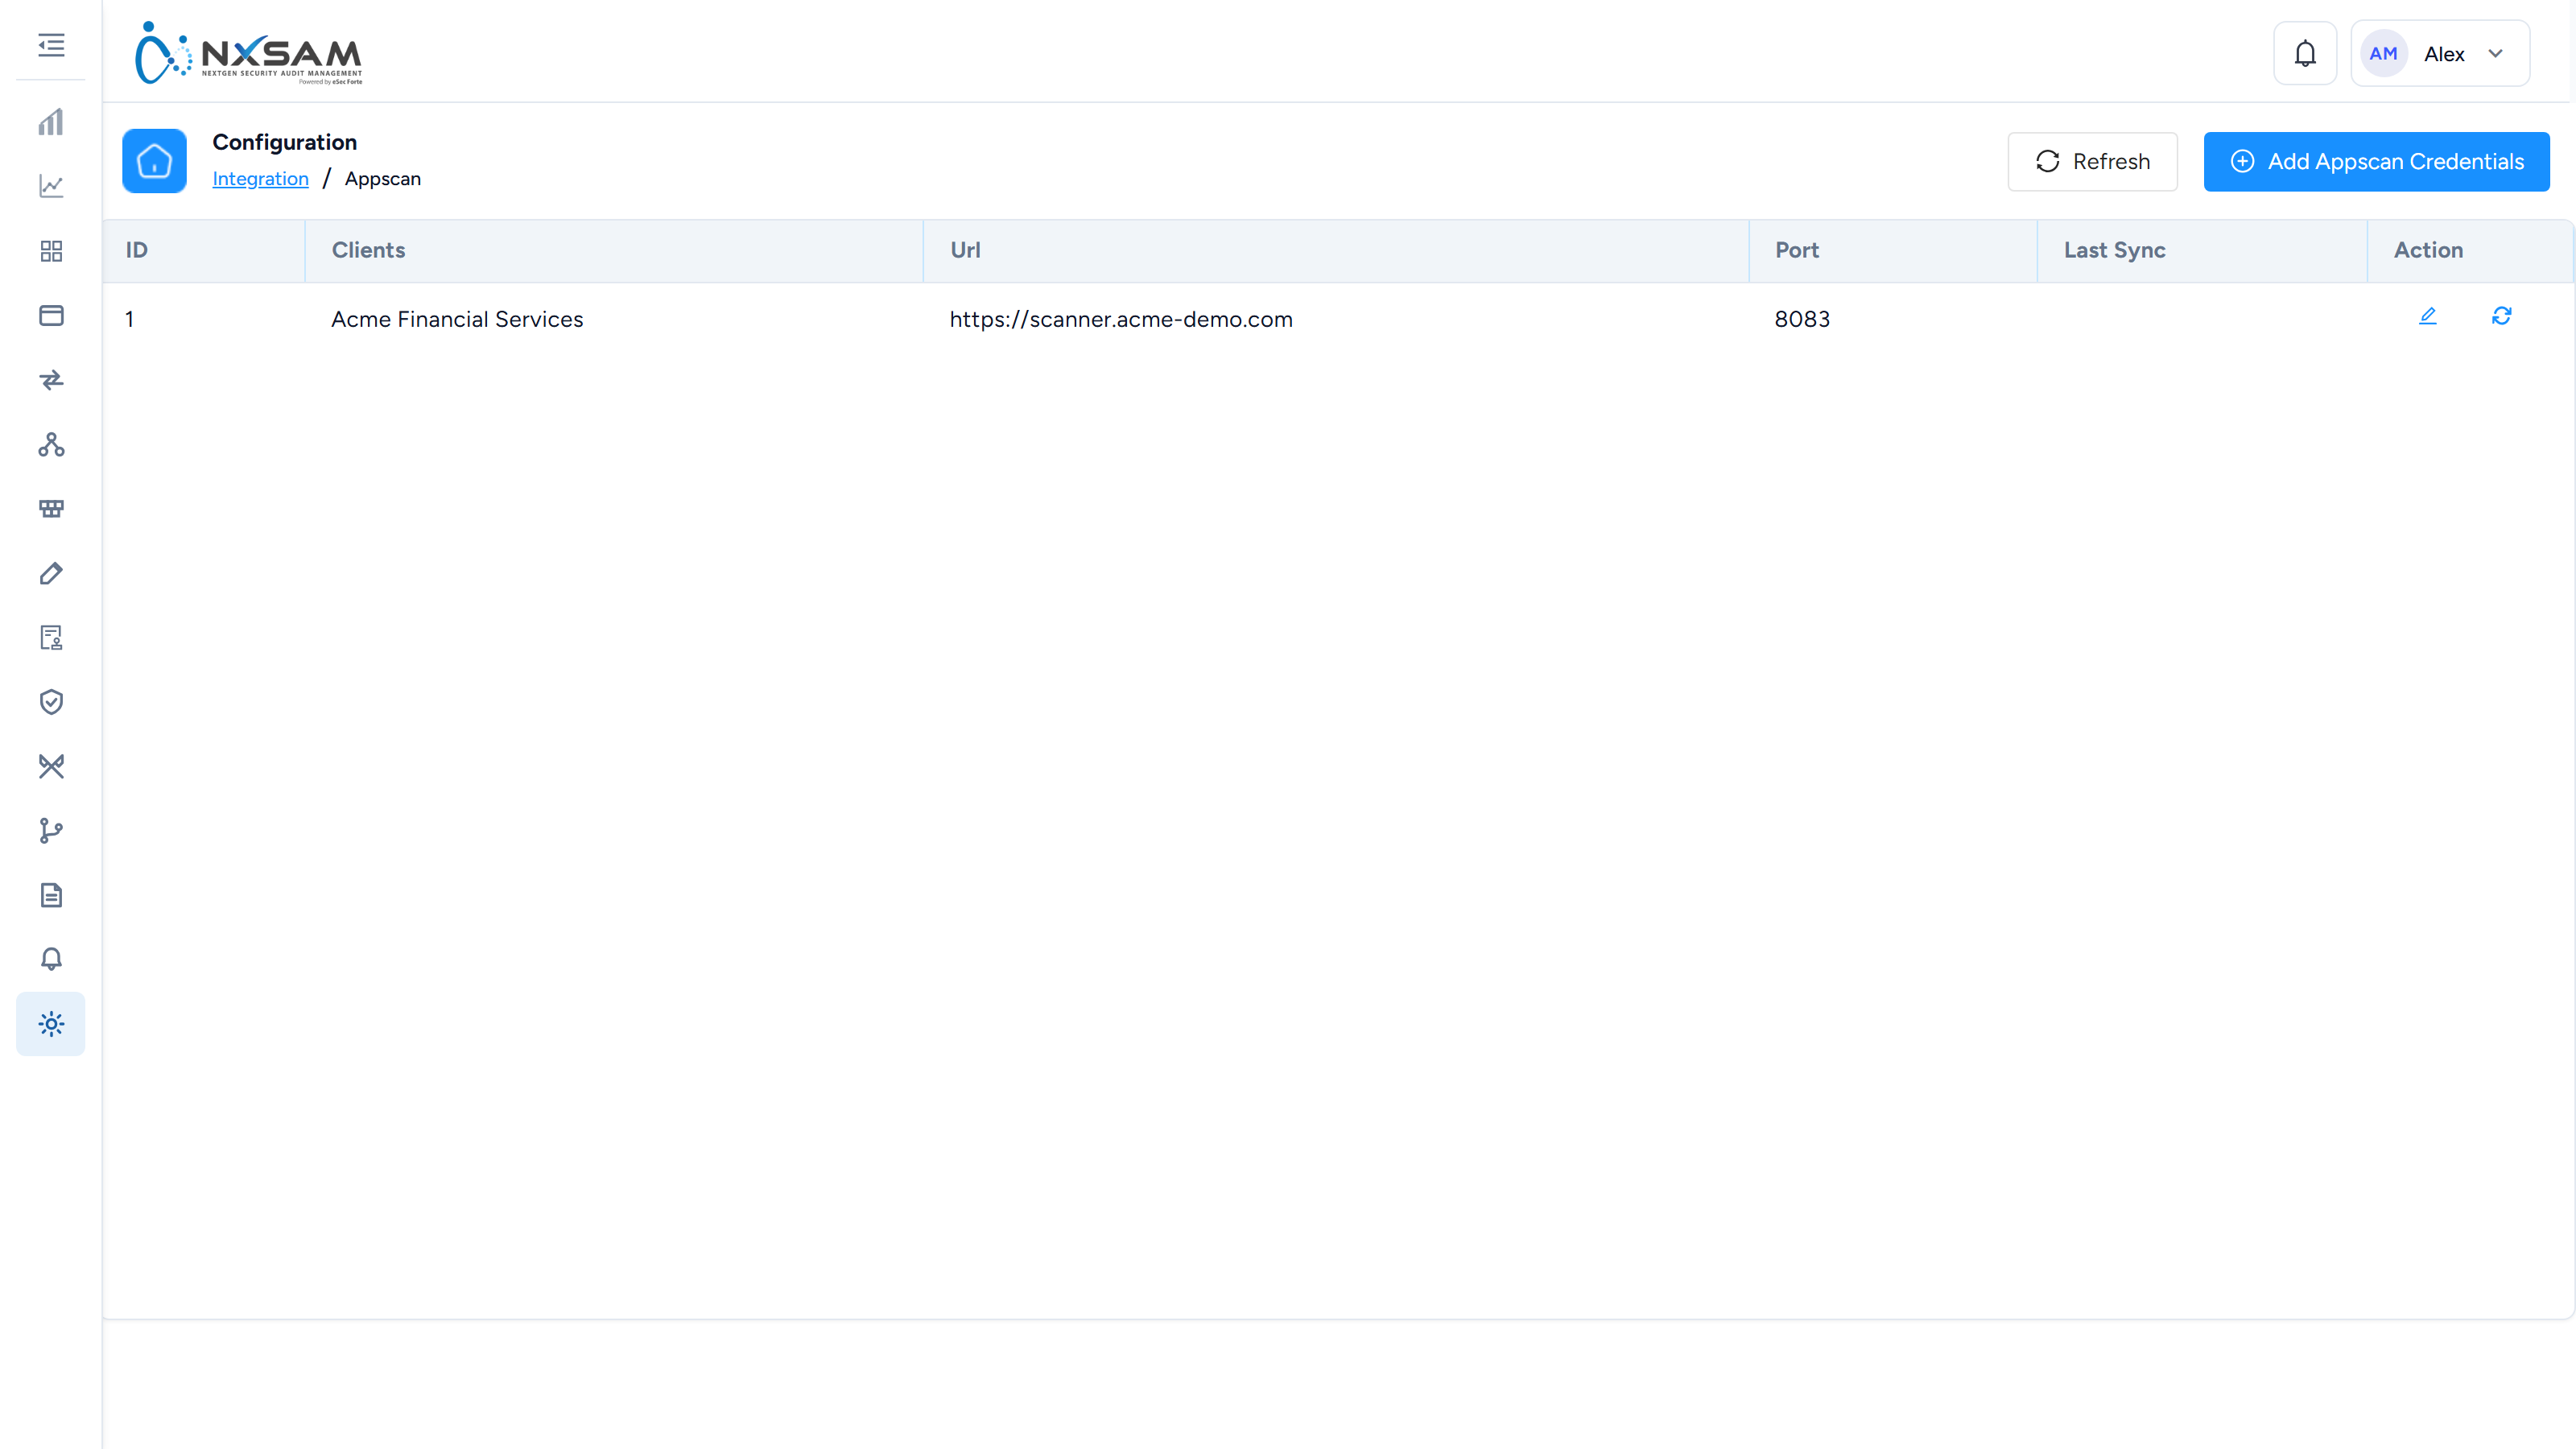
Burp Suite
Dynamic application testing. Findings arrive against the URL that was tested.
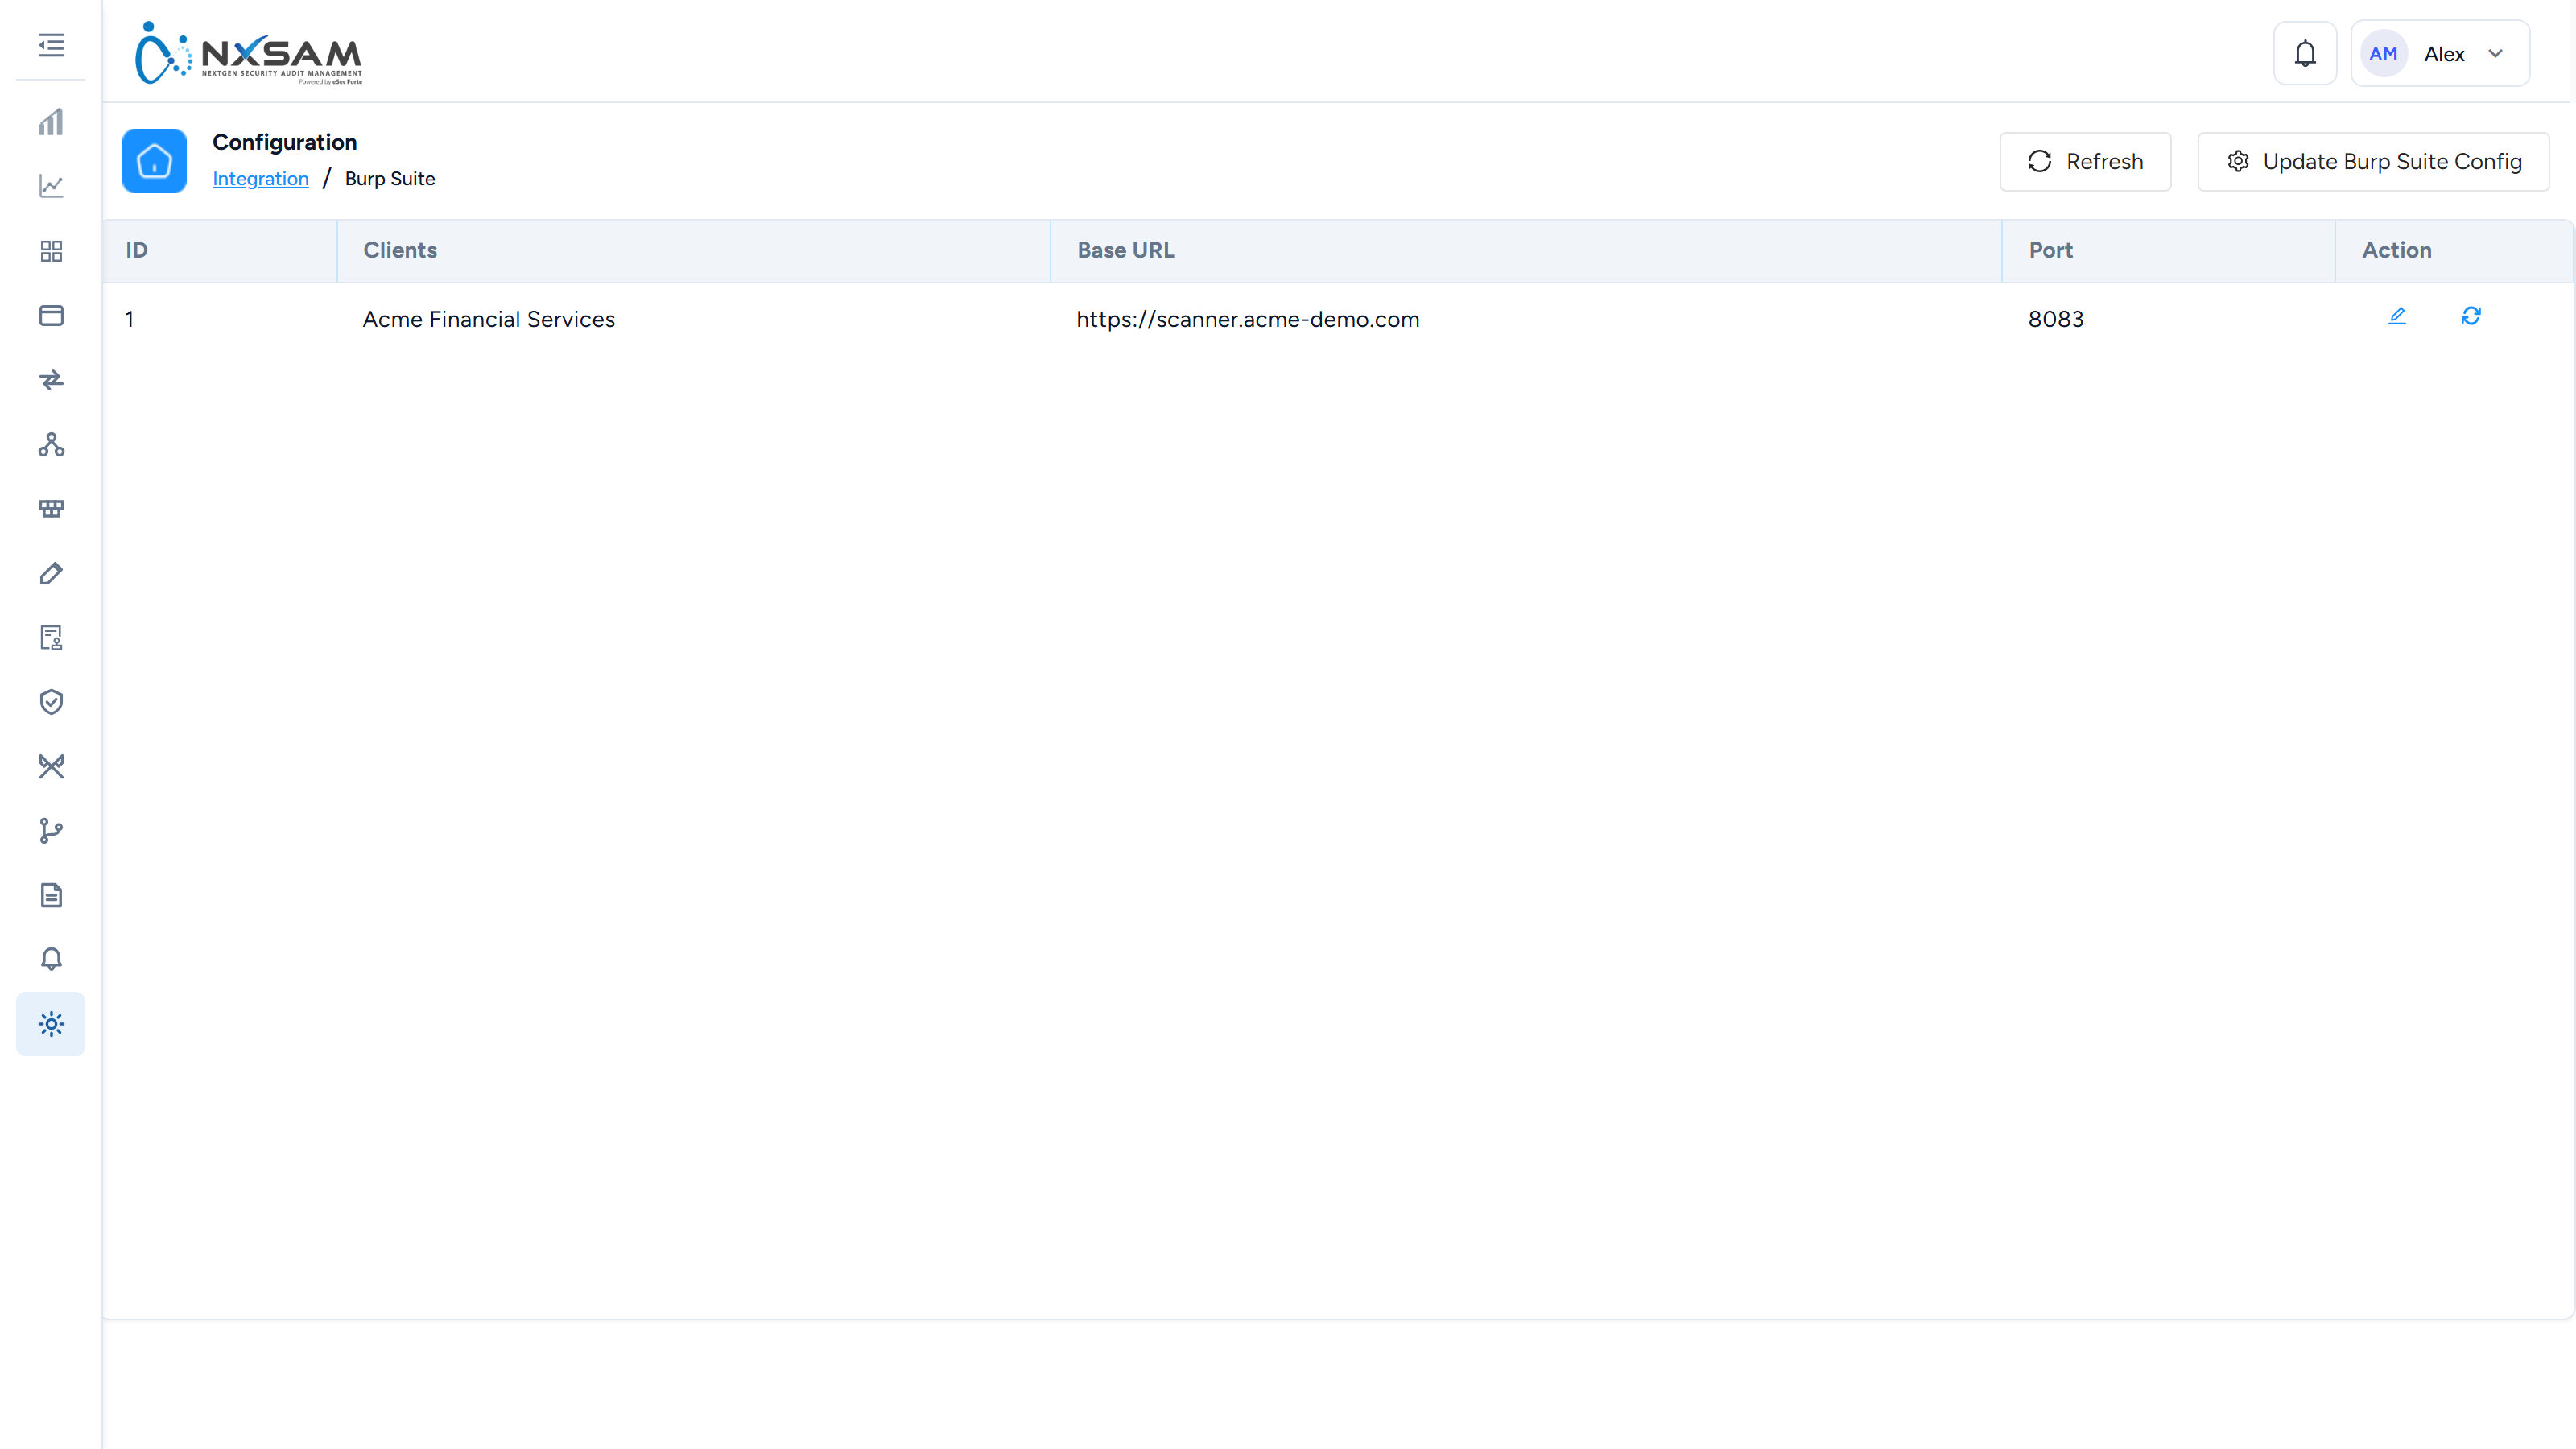
Checkmarx
Static application security testing. Projects map to NxSAM applications.
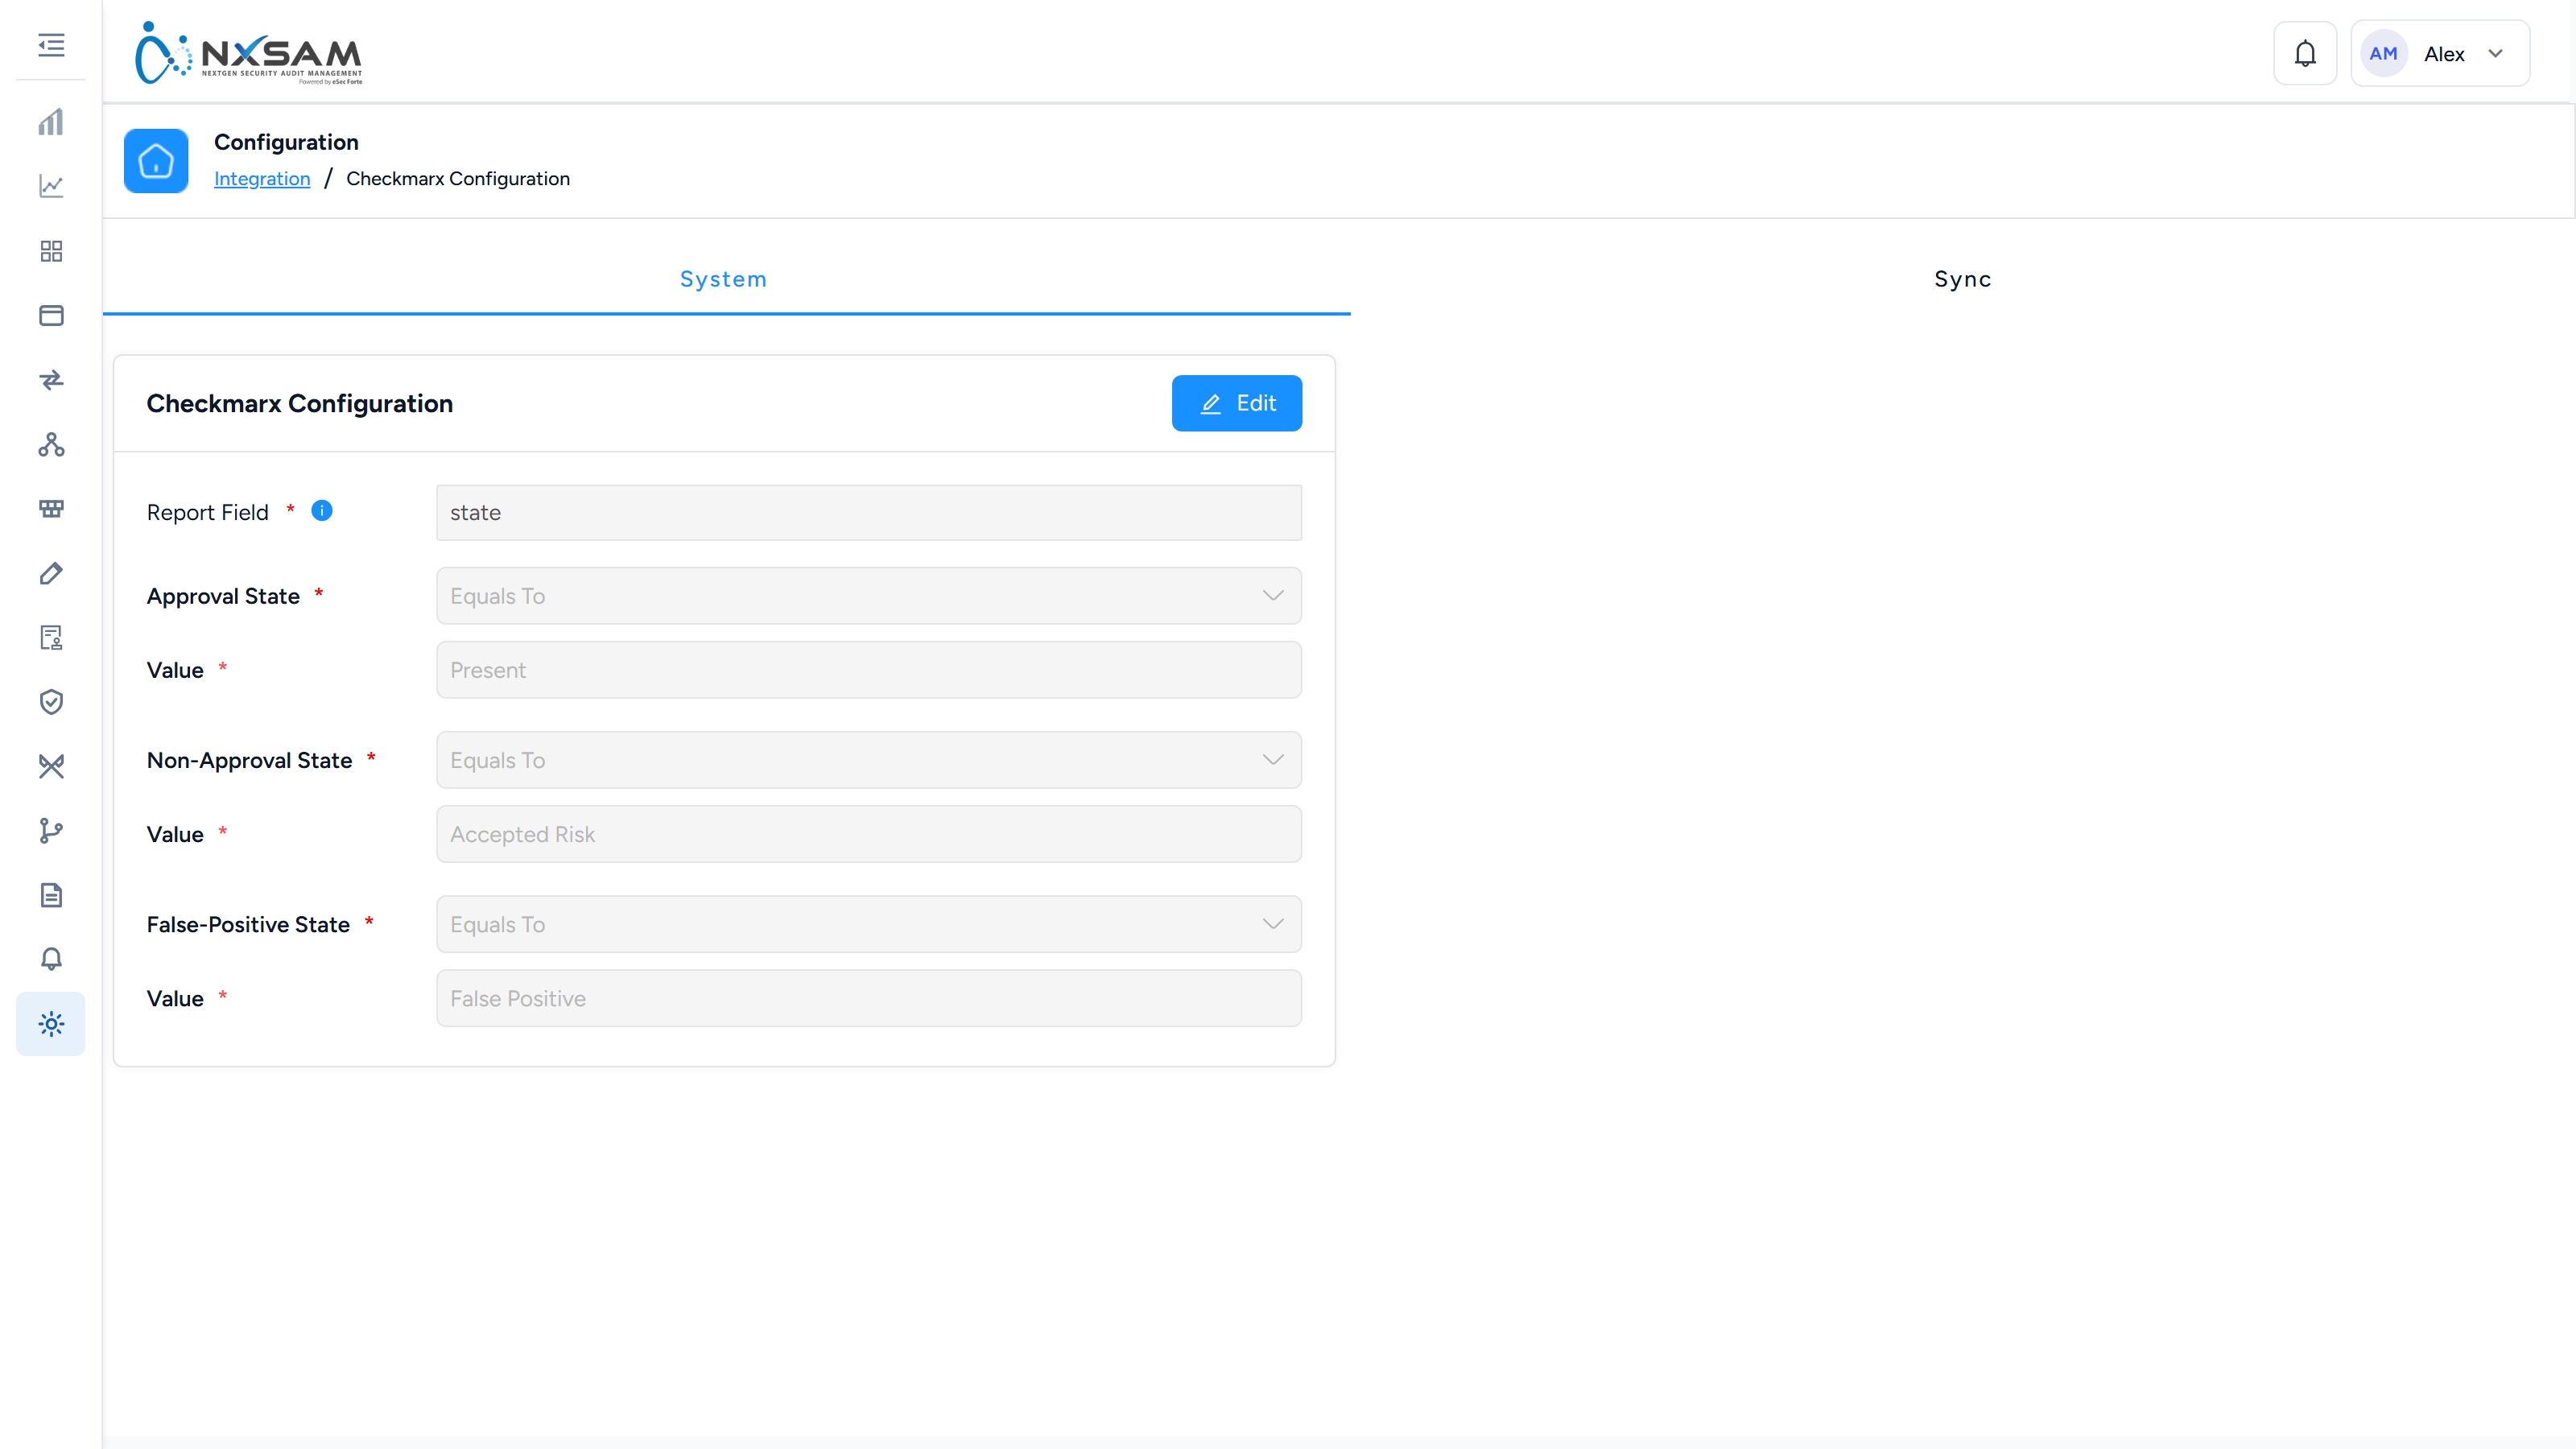
Checkmarx SCA
Software composition analysis — third-party libraries and their known vulnerabilities.
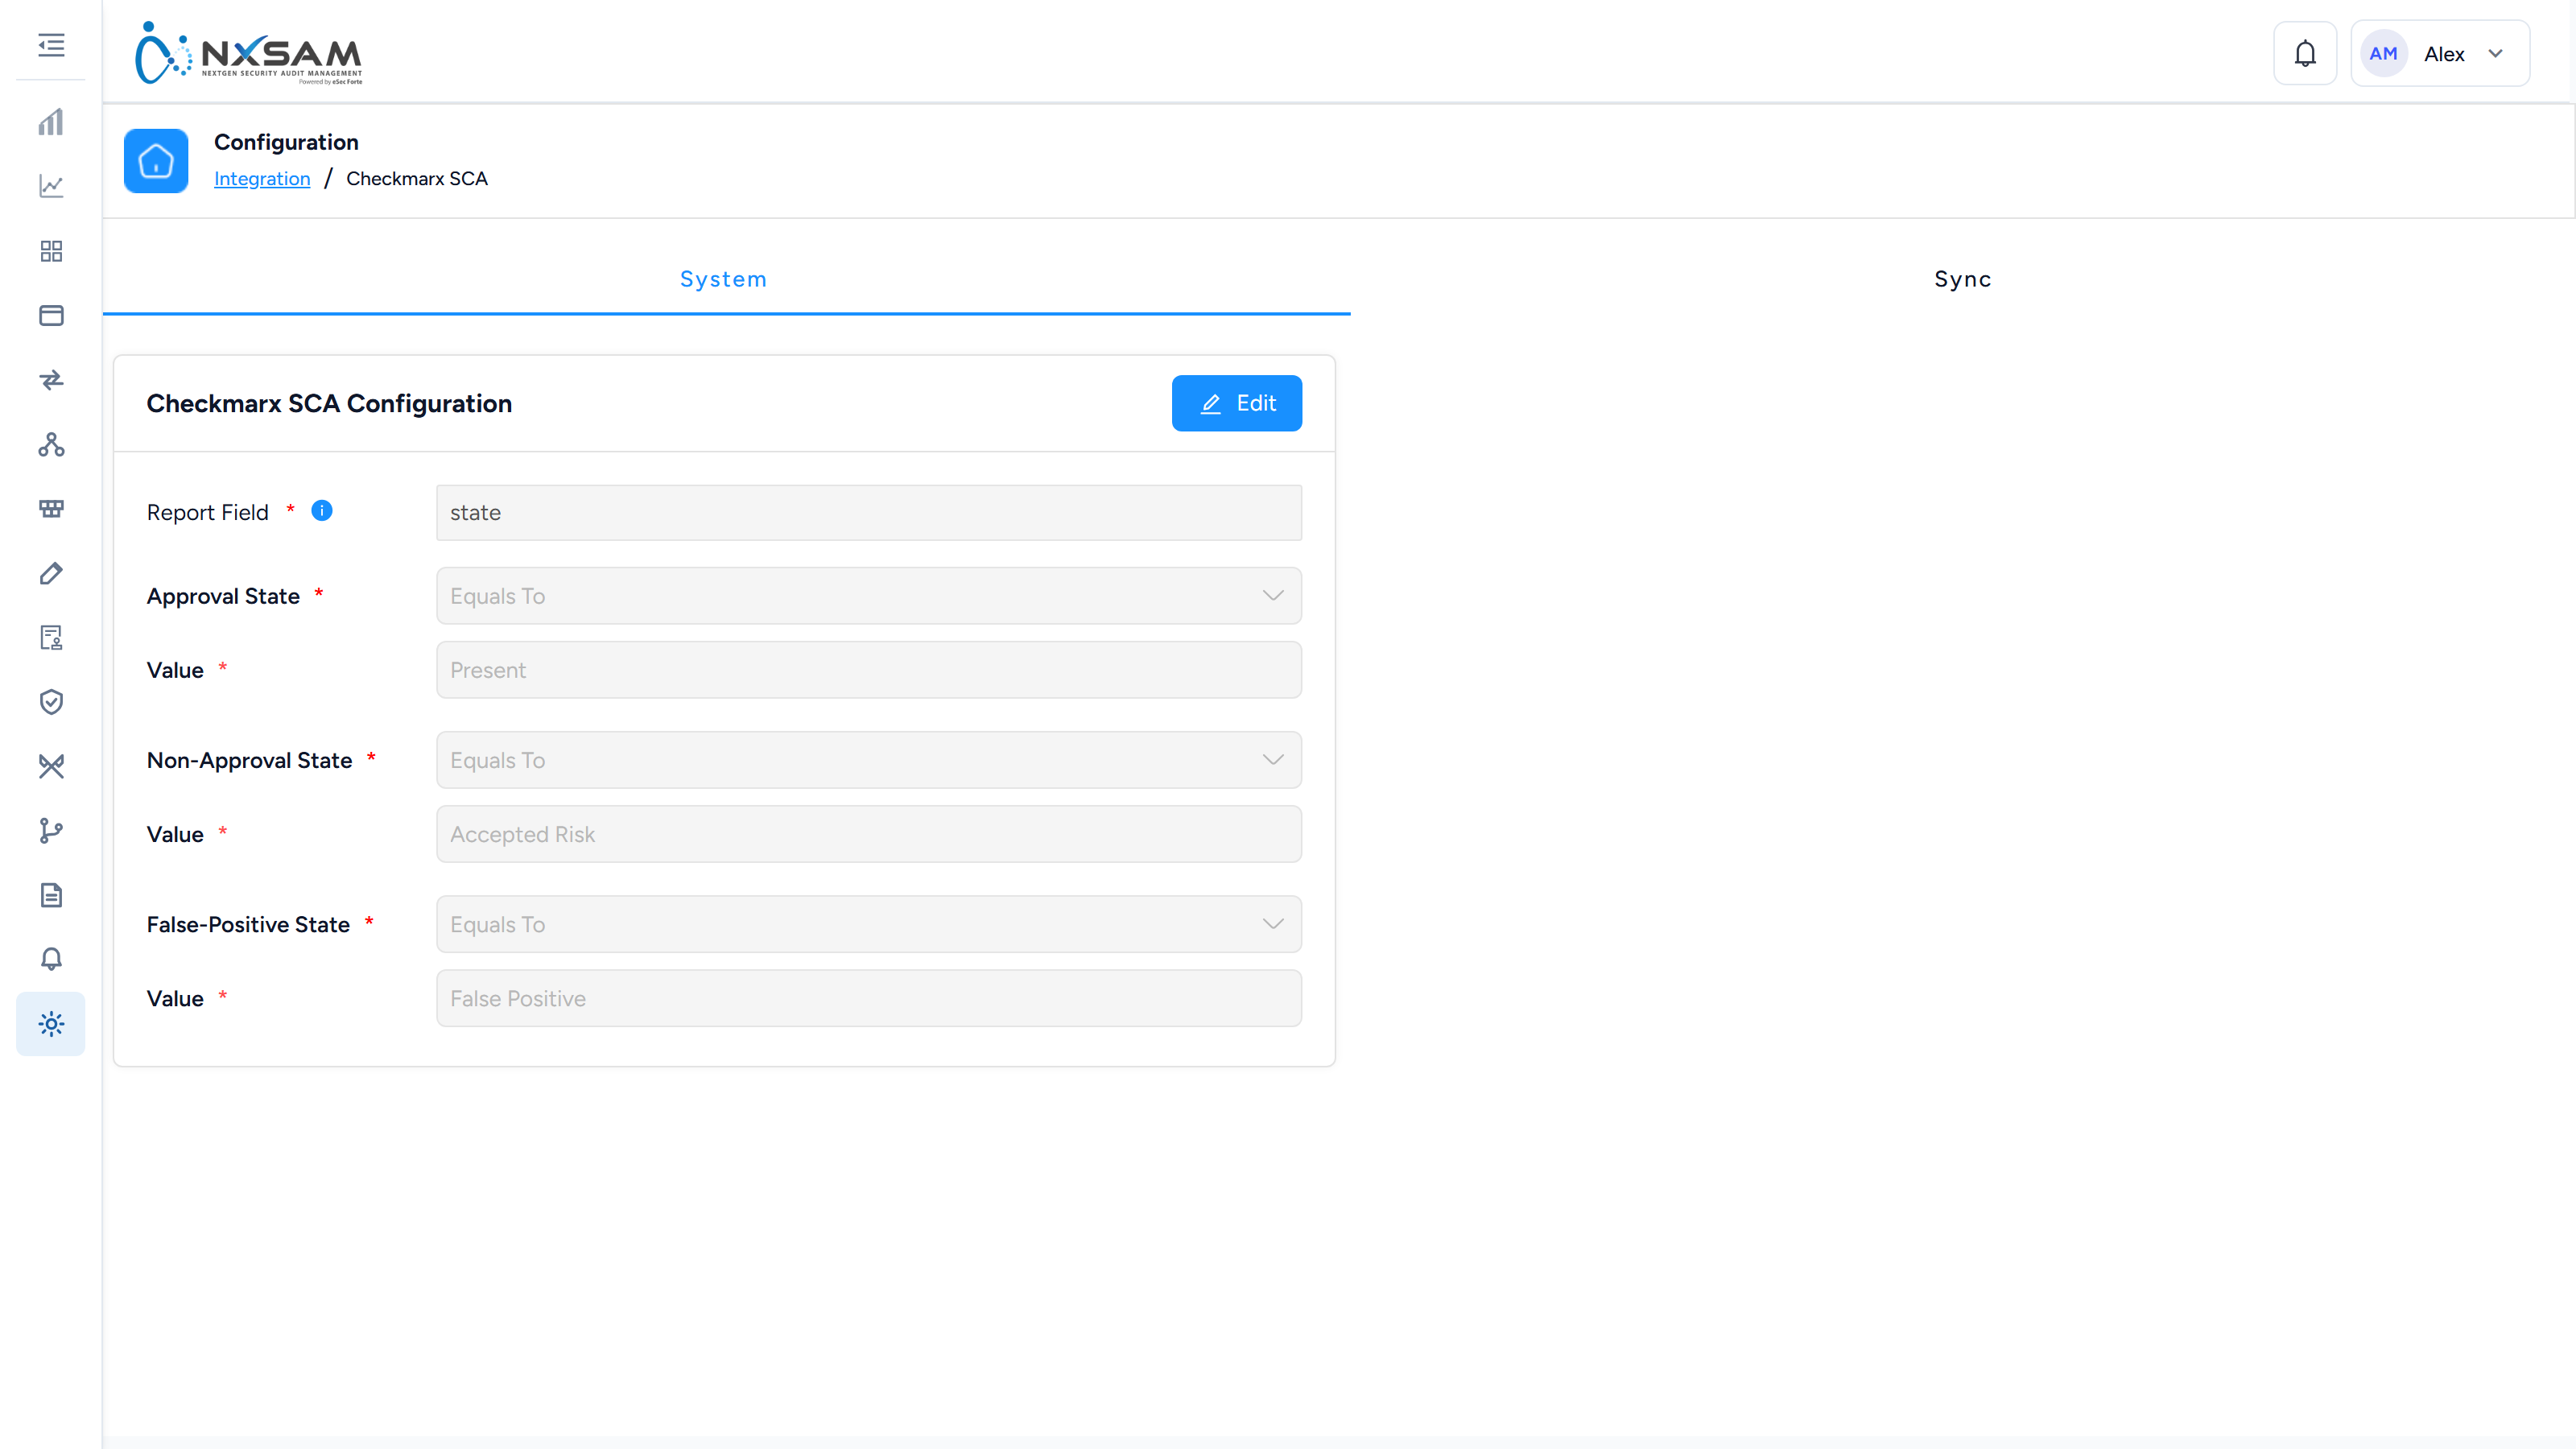
Checkmarx Standalone SCA
SCA run independently of the main Checkmarx platform.
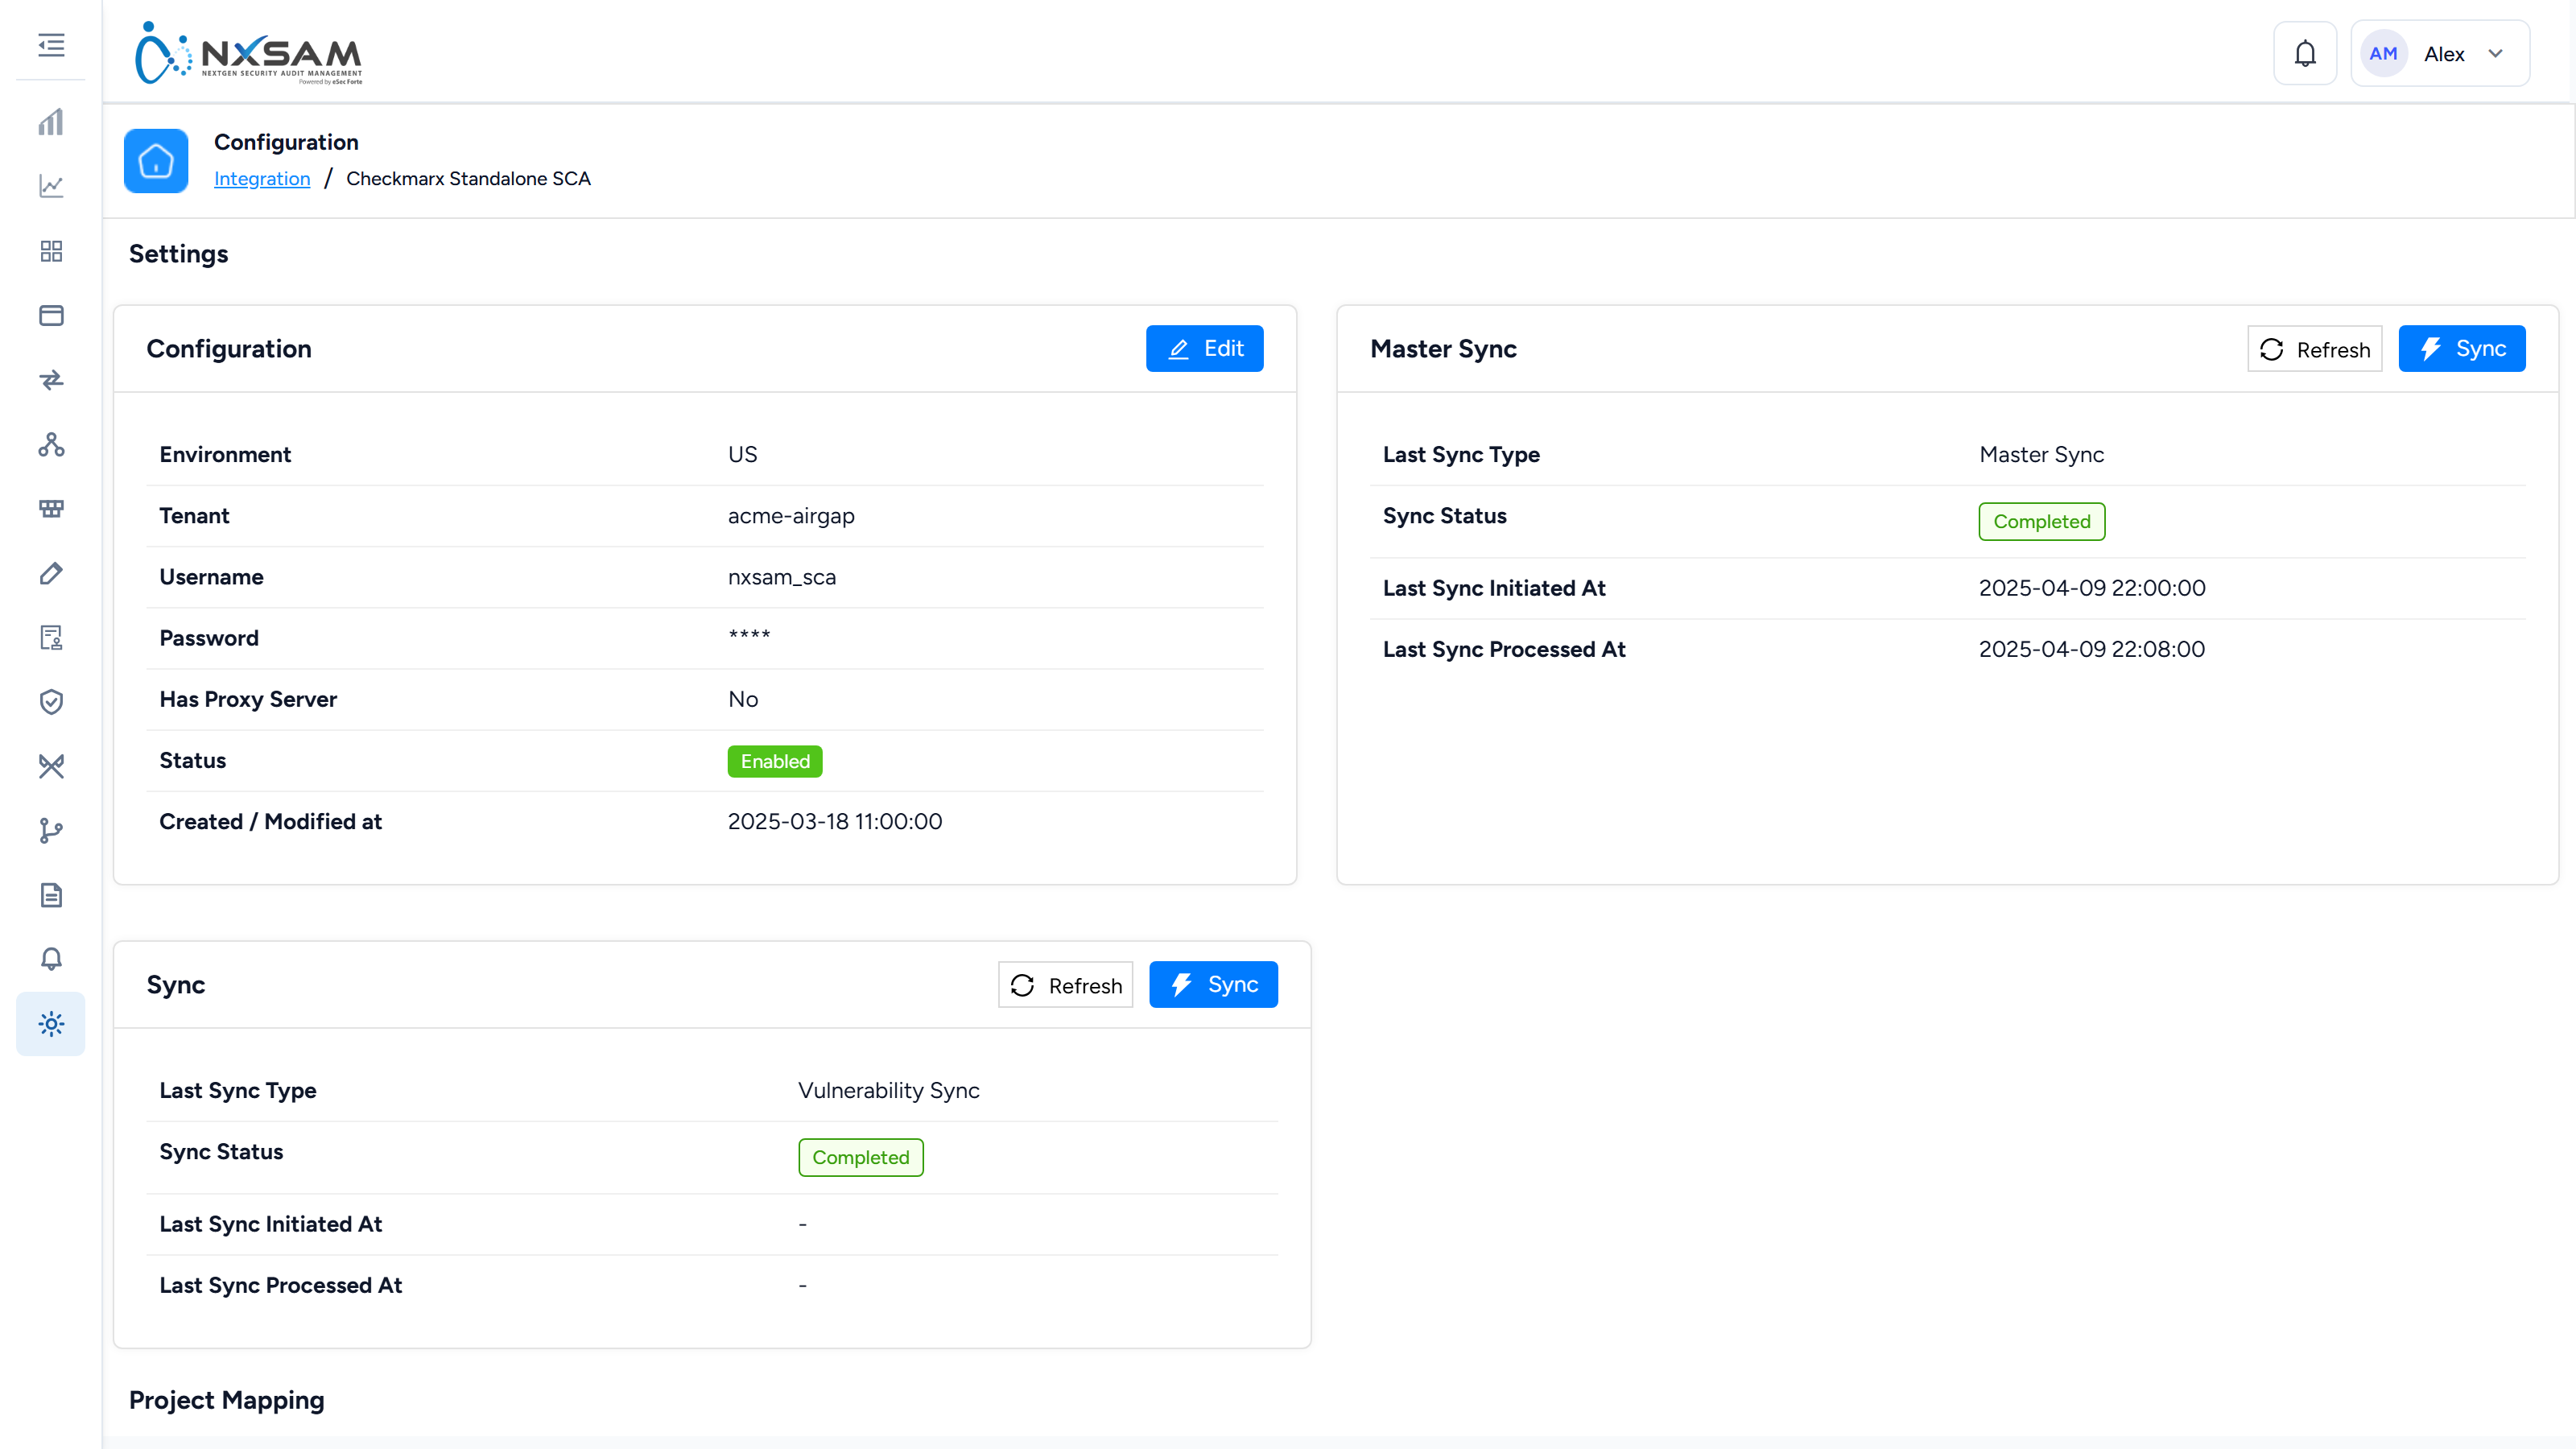
Cortex CSPM
Palo Alto's posture platform, feeding the CSPM screens rather than the Prisma ones. Master Sync brings rules and policies; Sync brings assets, issues and cases against them — in that order.
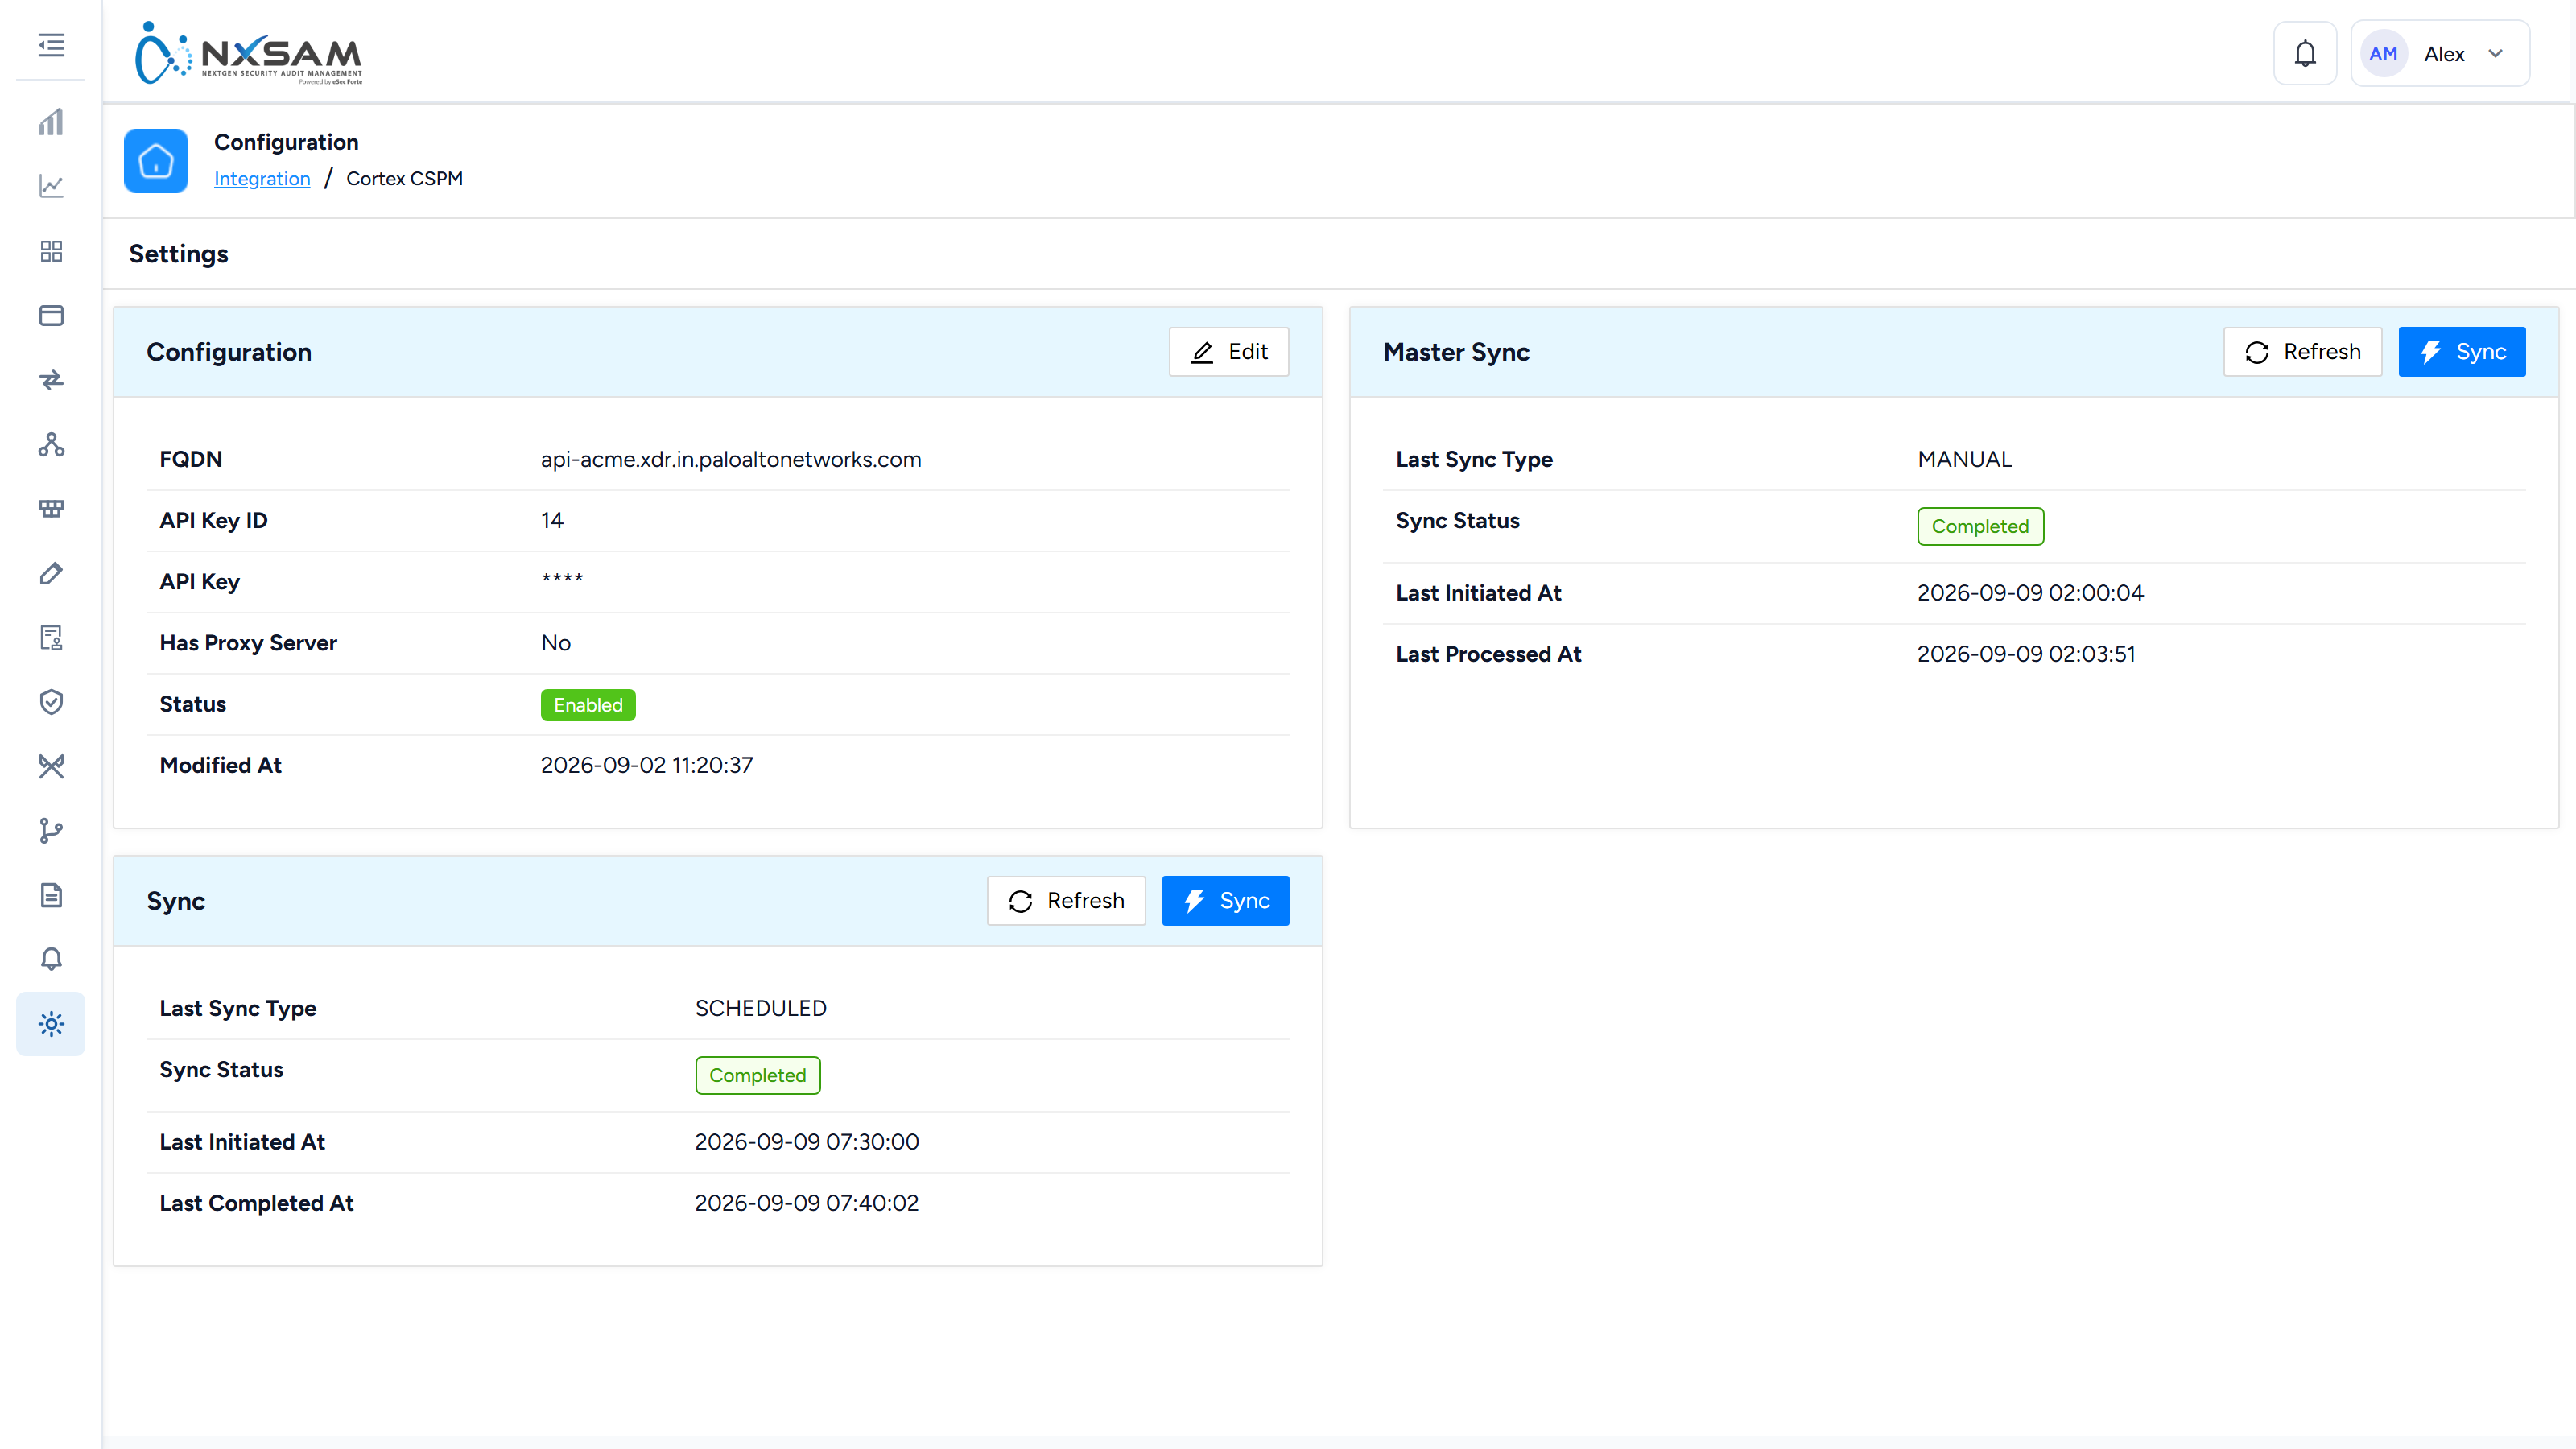
Cortex XDR
Host insight findings as a Network VA source. Shown here in its unconfigured state.
Dependency Track
Continuous composition analysis from an SBOM rather than from a scan.
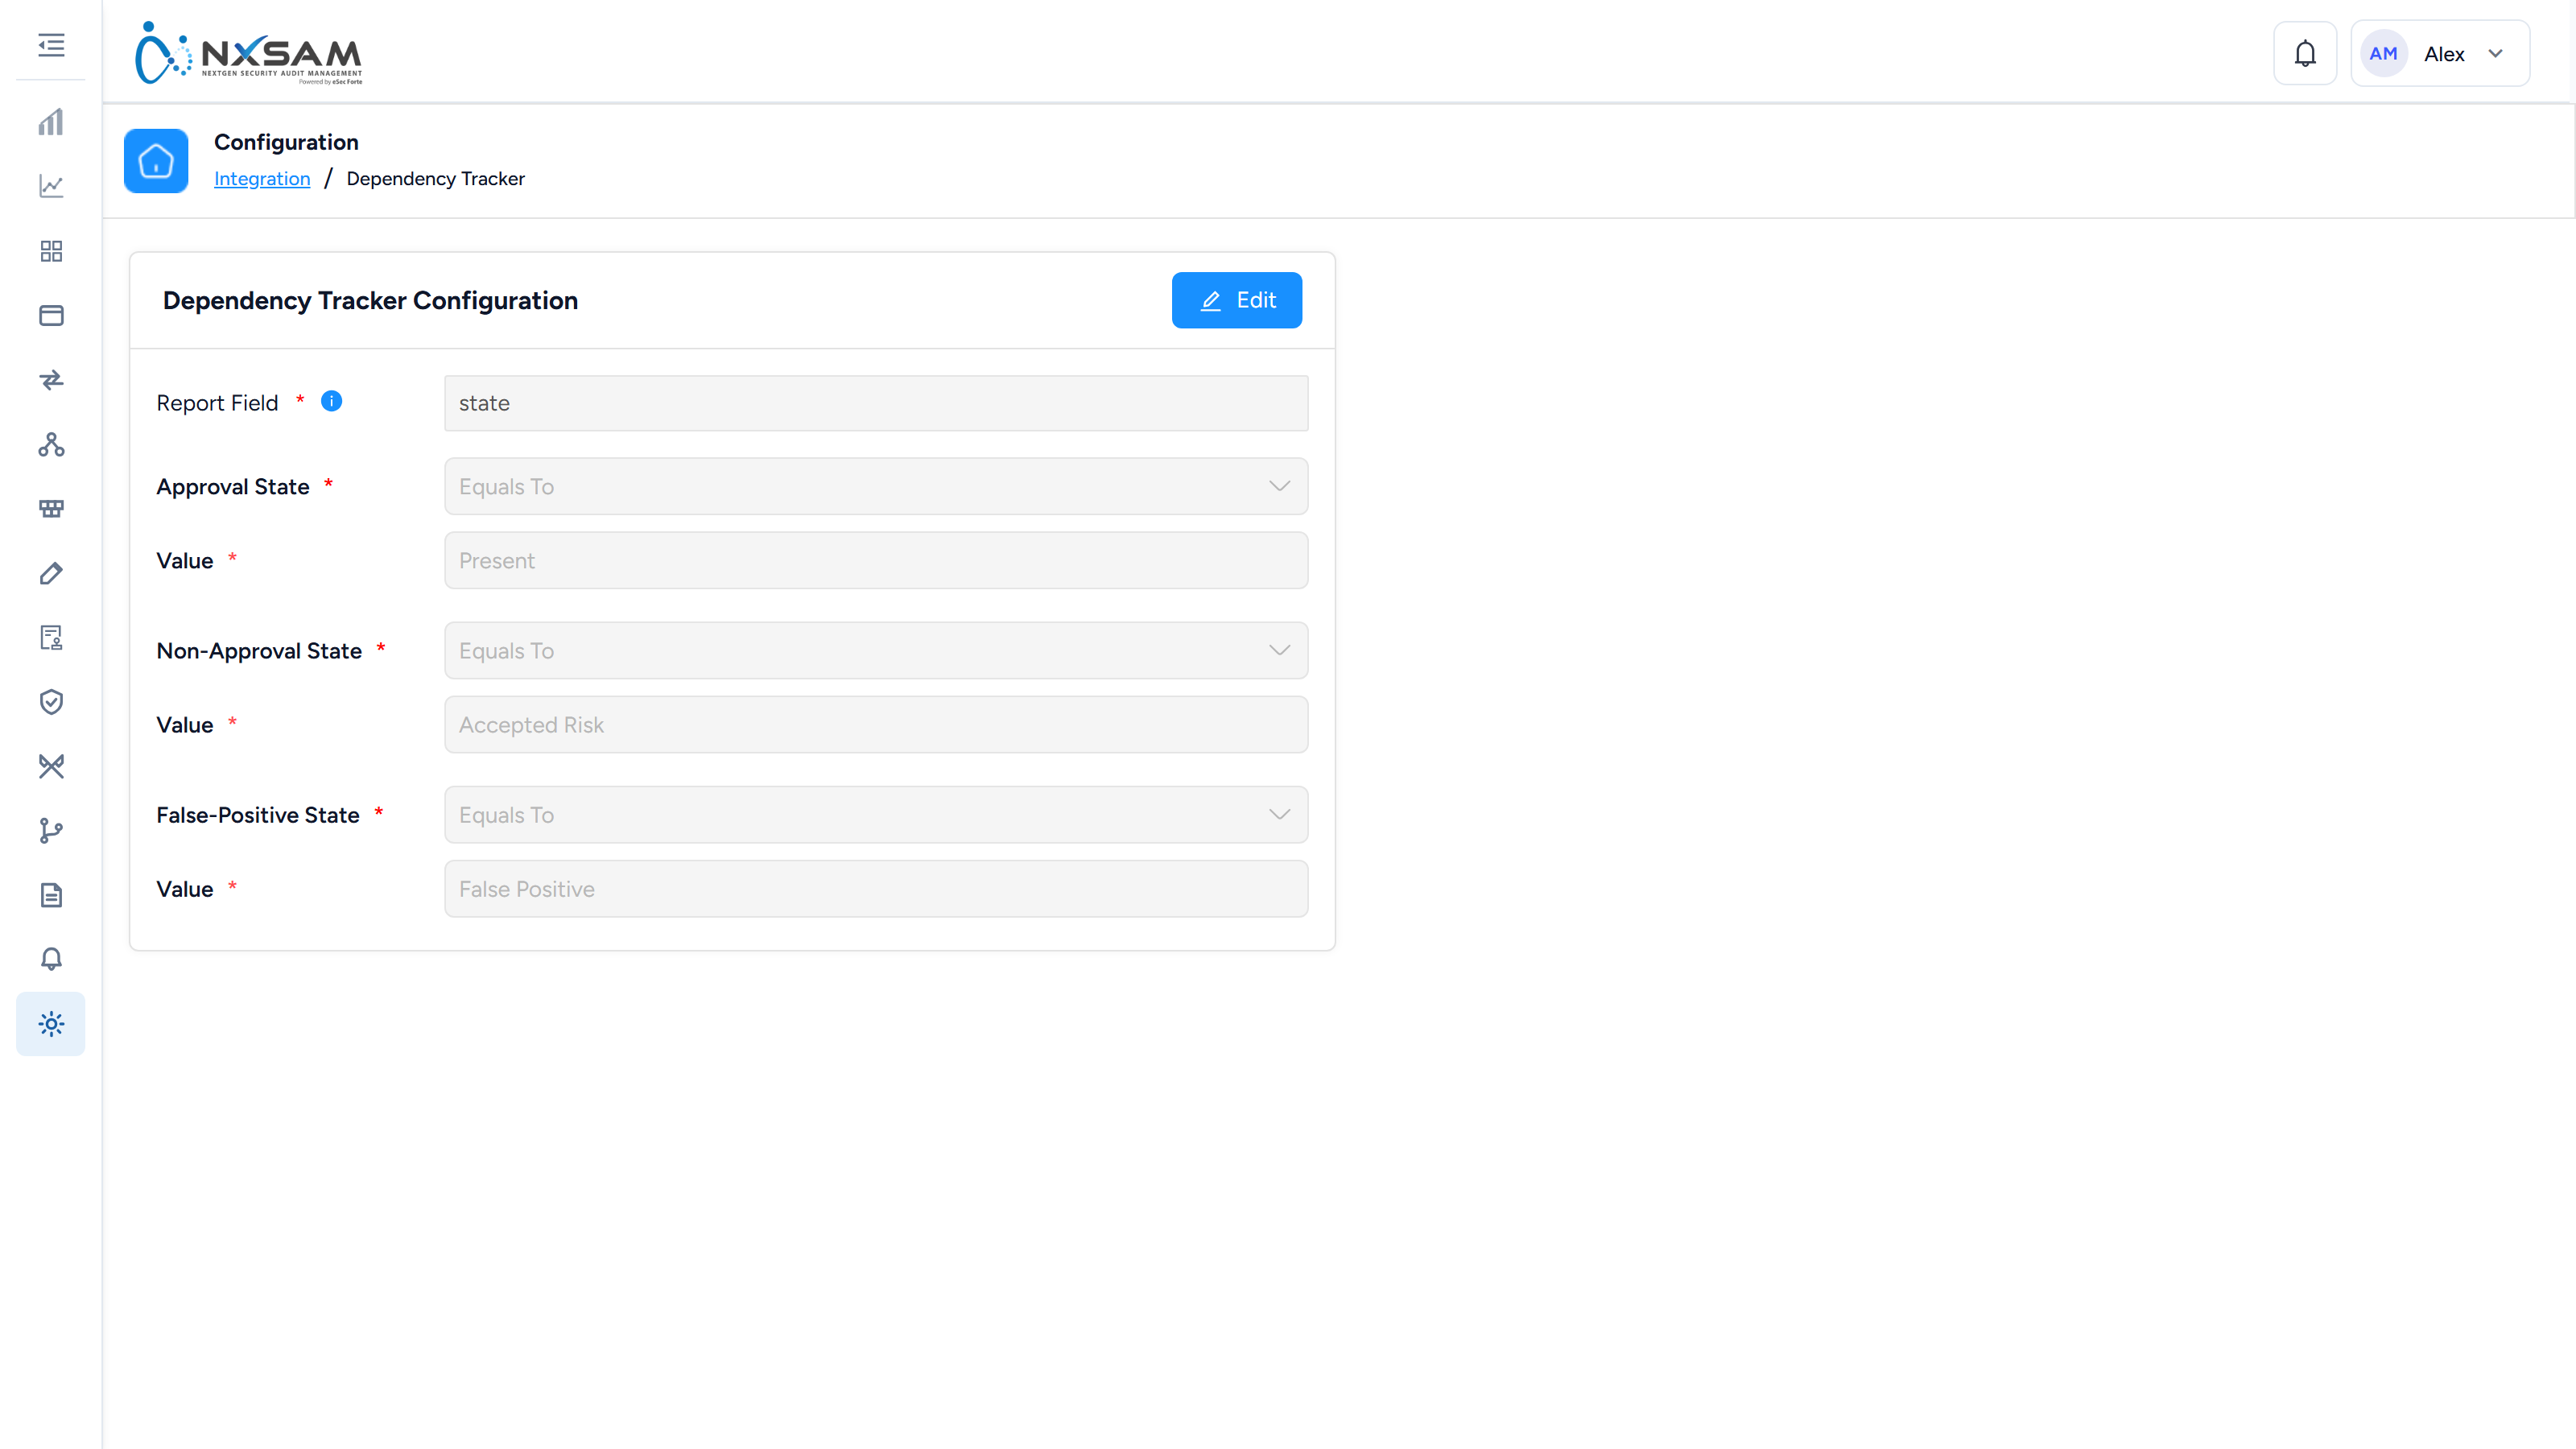
Fortify
Static application security testing.
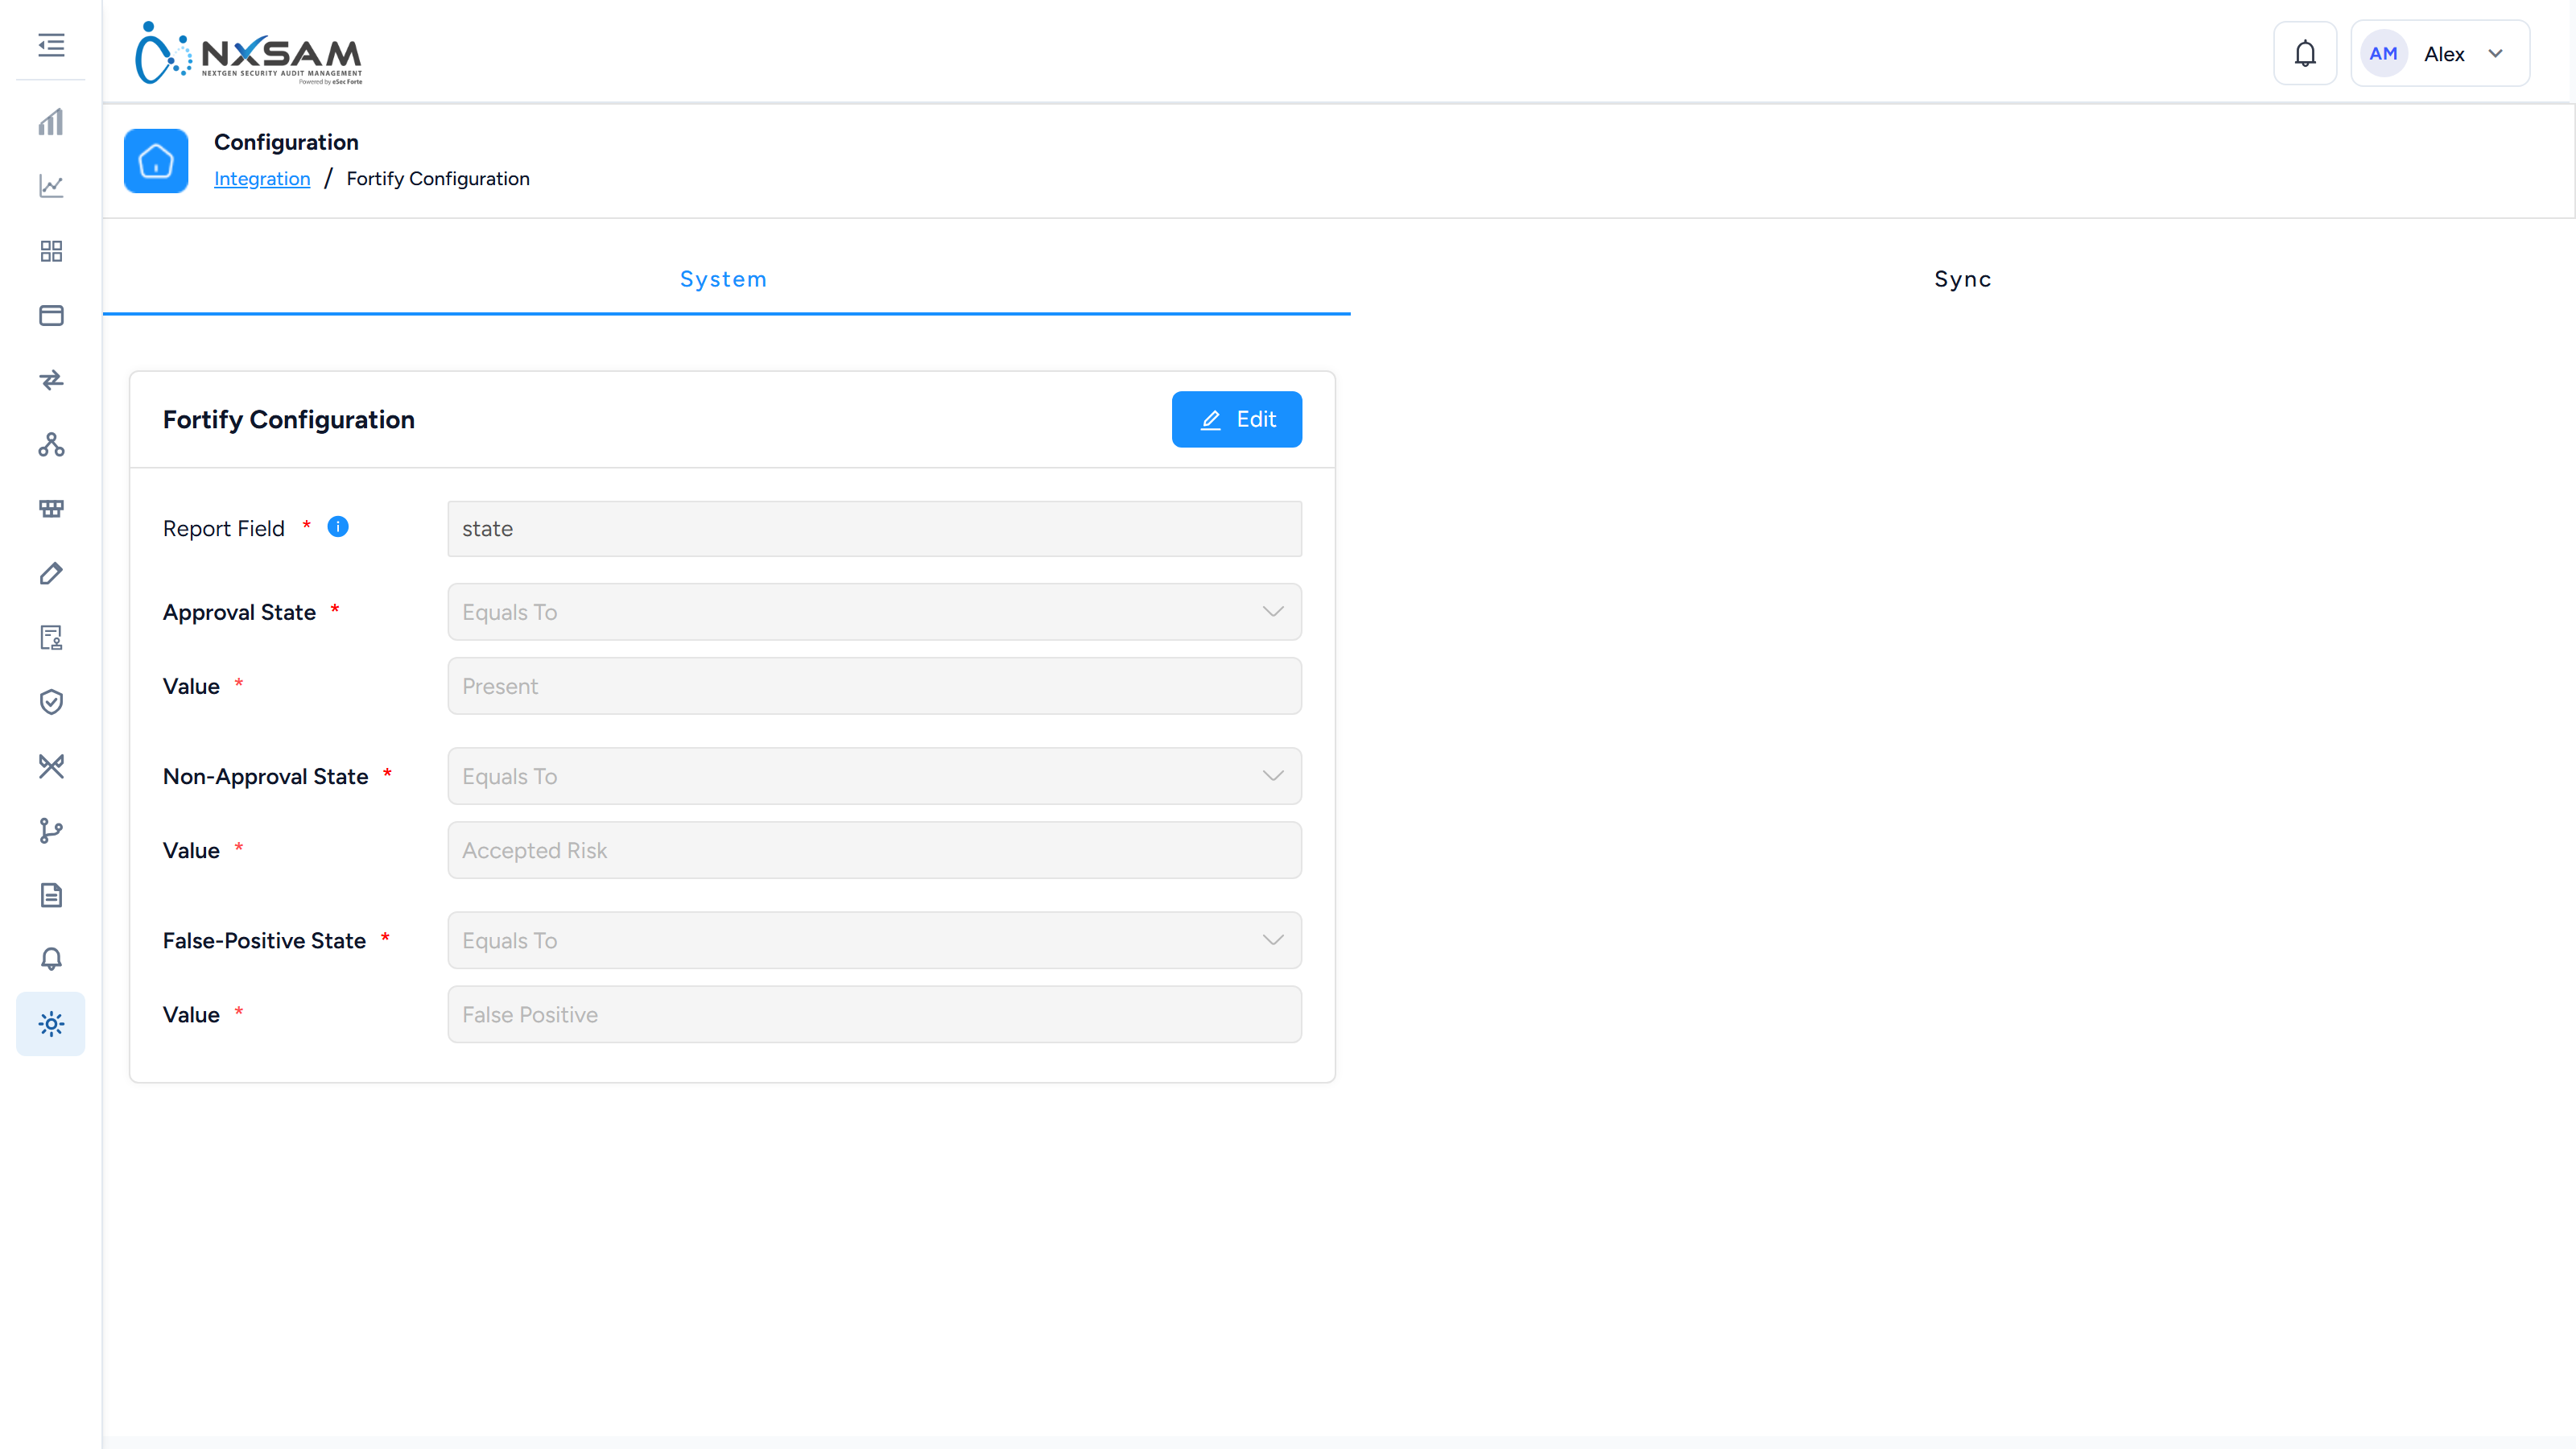
Gitleaks
Secrets detection — credentials committed into source control.
JFrog Xray
Composition analysis over artefacts held in Artifactory.
Netsparker
Dynamic application scanning.
Nexpose Upload Mapping
Which column of a Nexpose export carries each date NxSAM needs, and whether it is mandatory.
Prisma Cloud
Container security. Connects to the registry scan results and the collections they belong to.
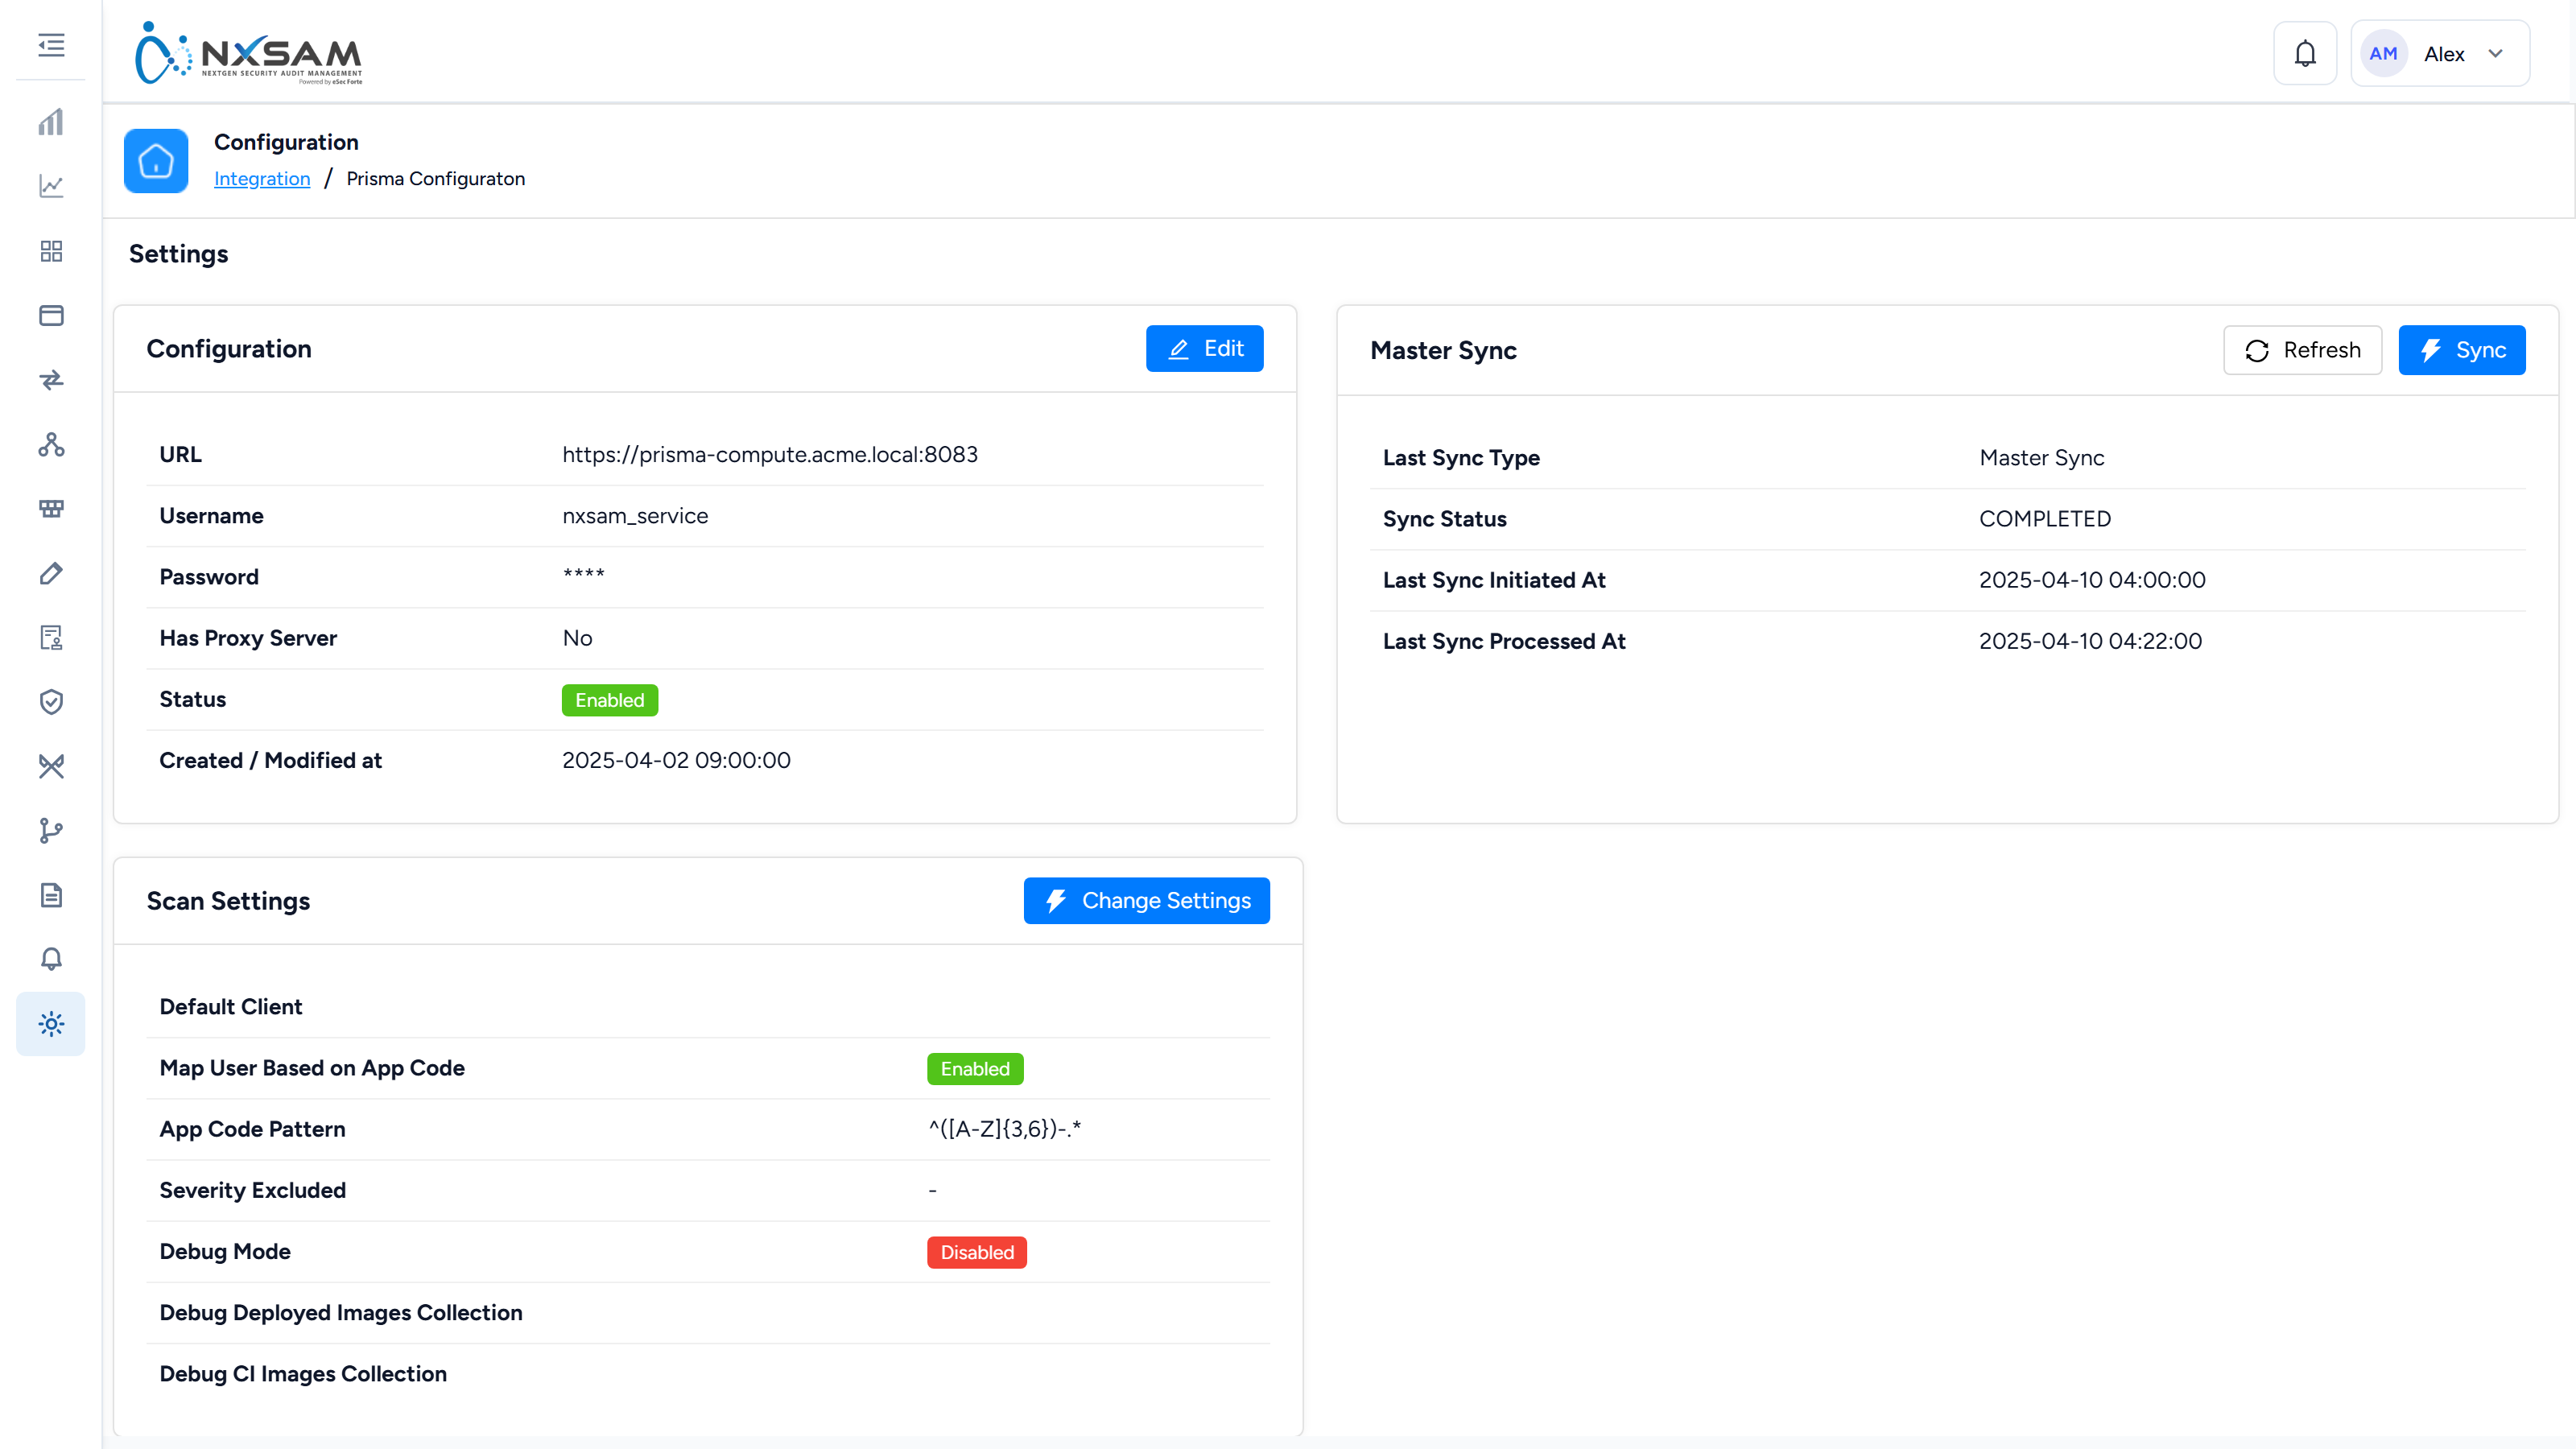
Prisma Cloud (Twistlock) Connection
The connection to the container scanner: endpoint, port and credentials.
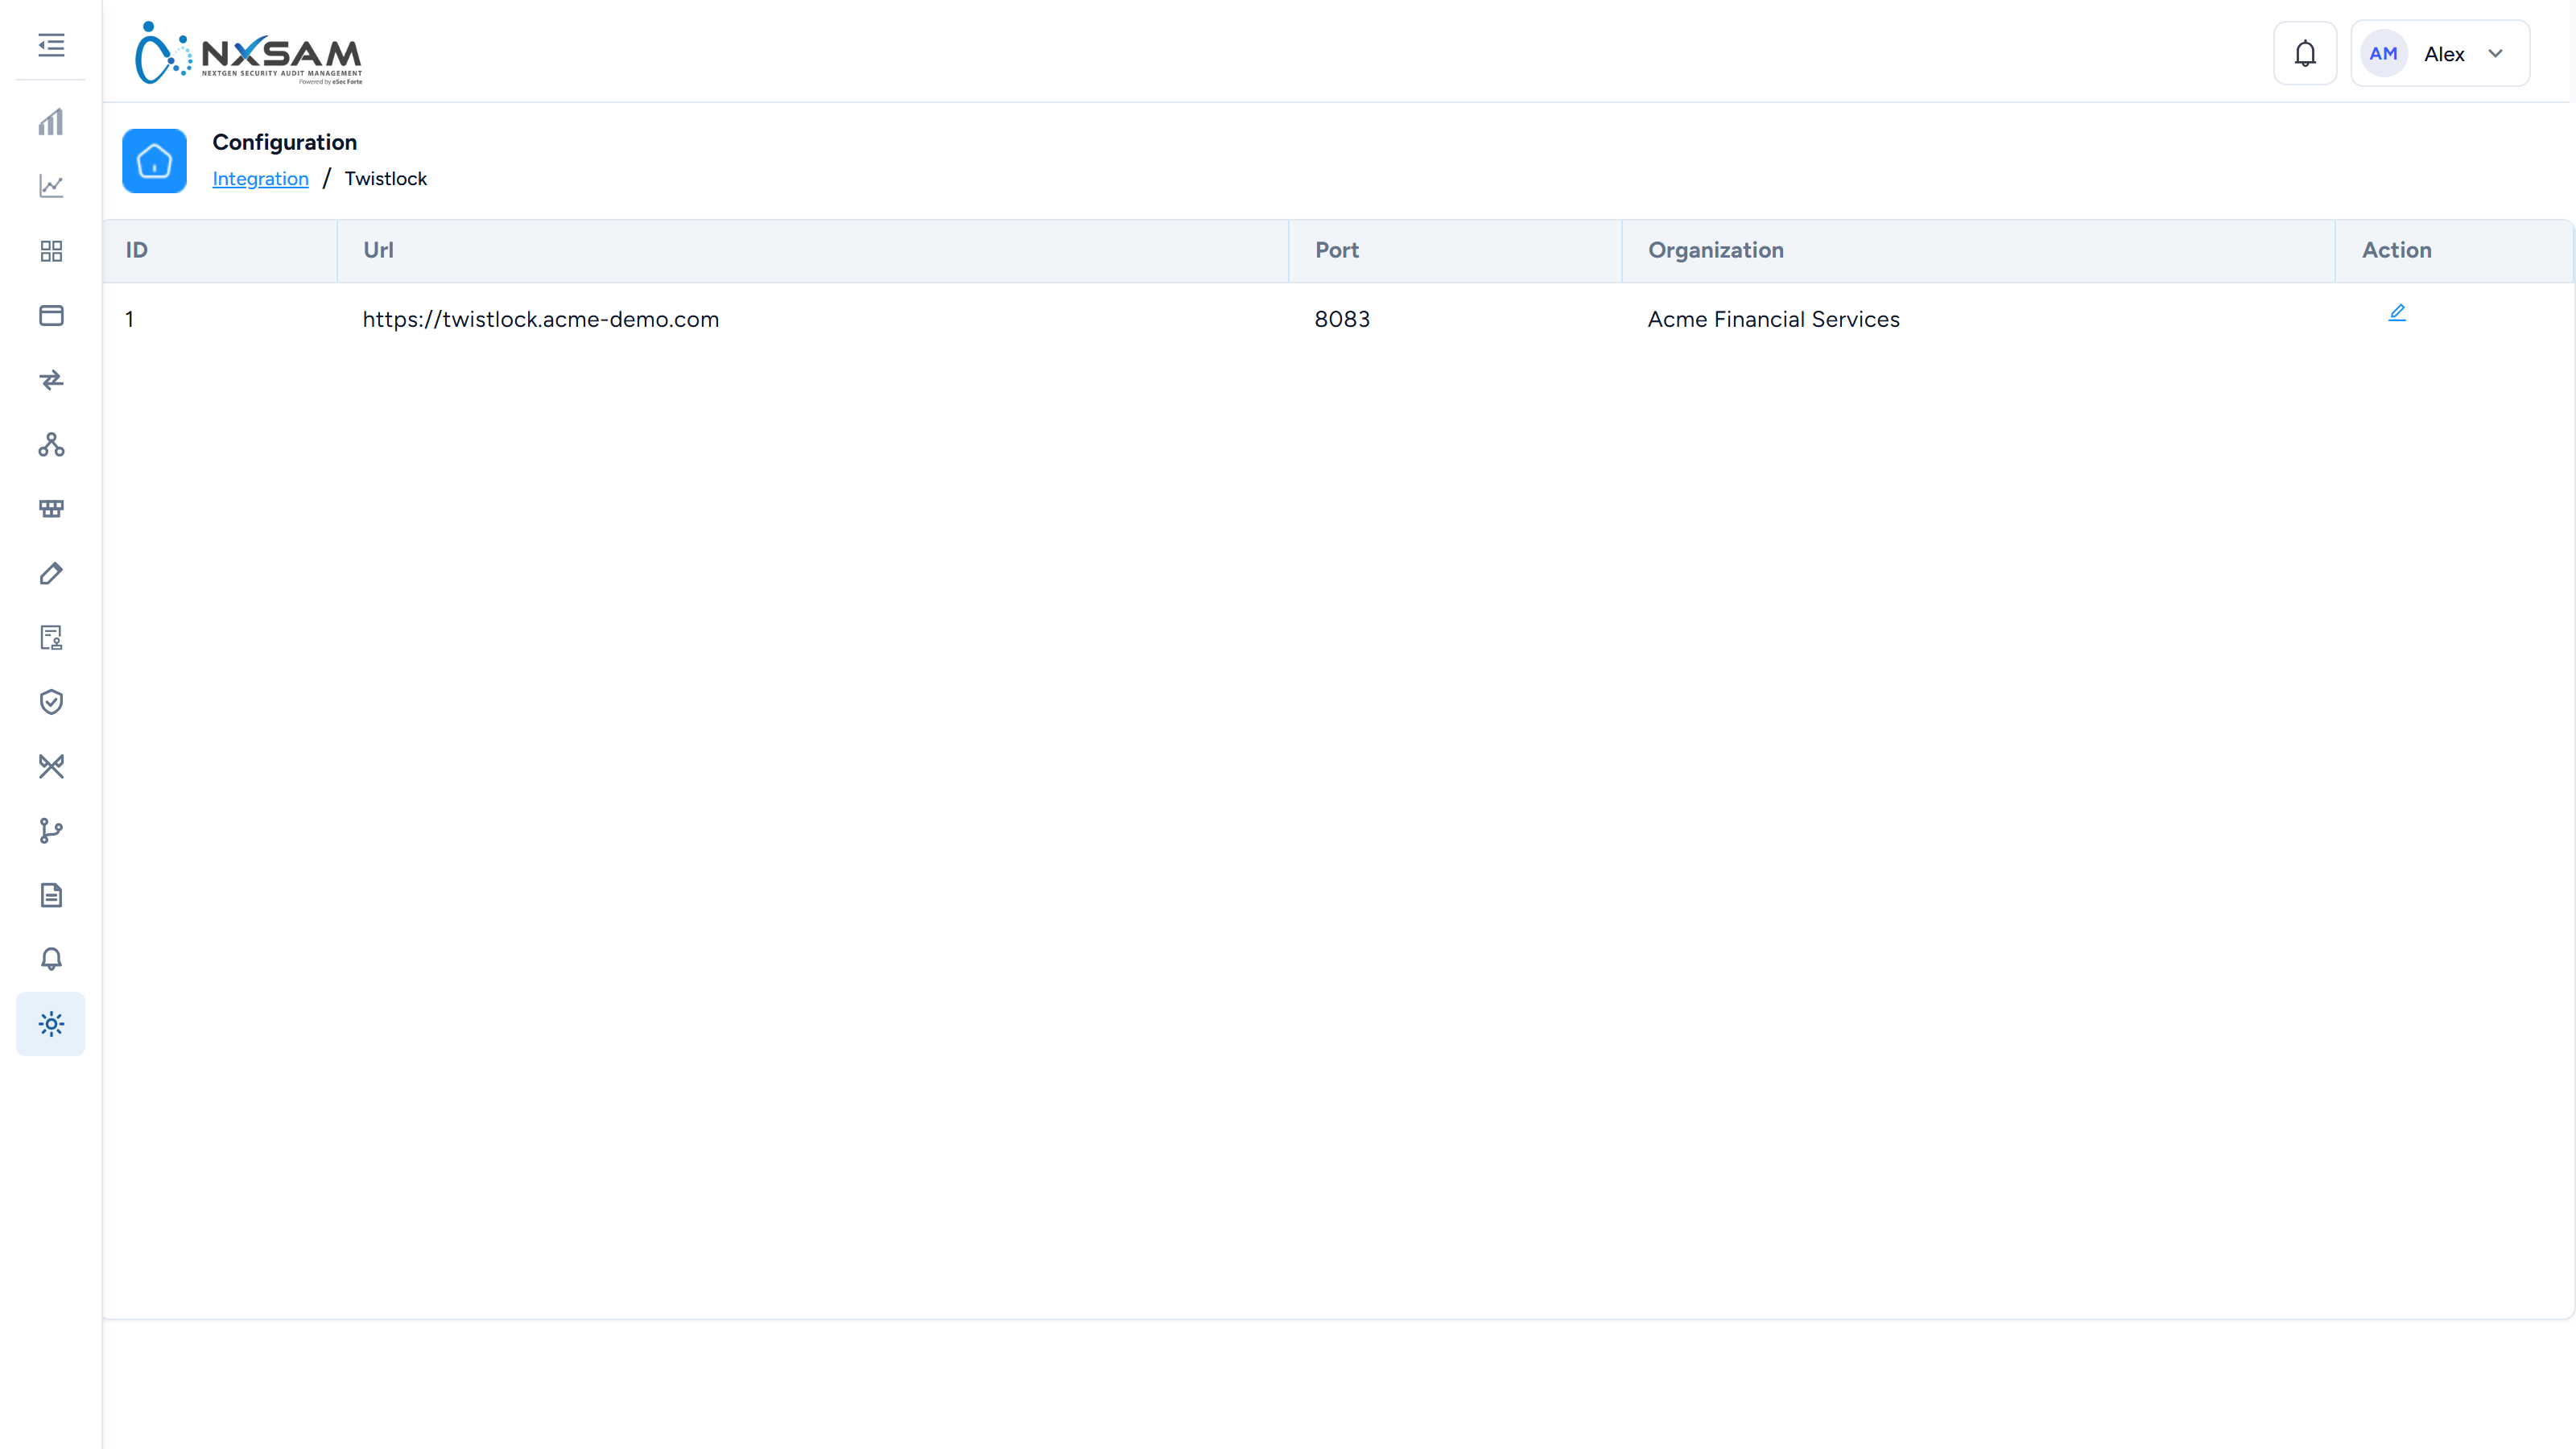
Prisma Cloud CSPM
Cloud posture. Separate from the container integration even though the vendor is the same.
SentinelOne CSPM
An alternative cloud posture source, feeding the CSPM screens. One Data Sync brings everything.
Snyk Code
Static analysis of source code.
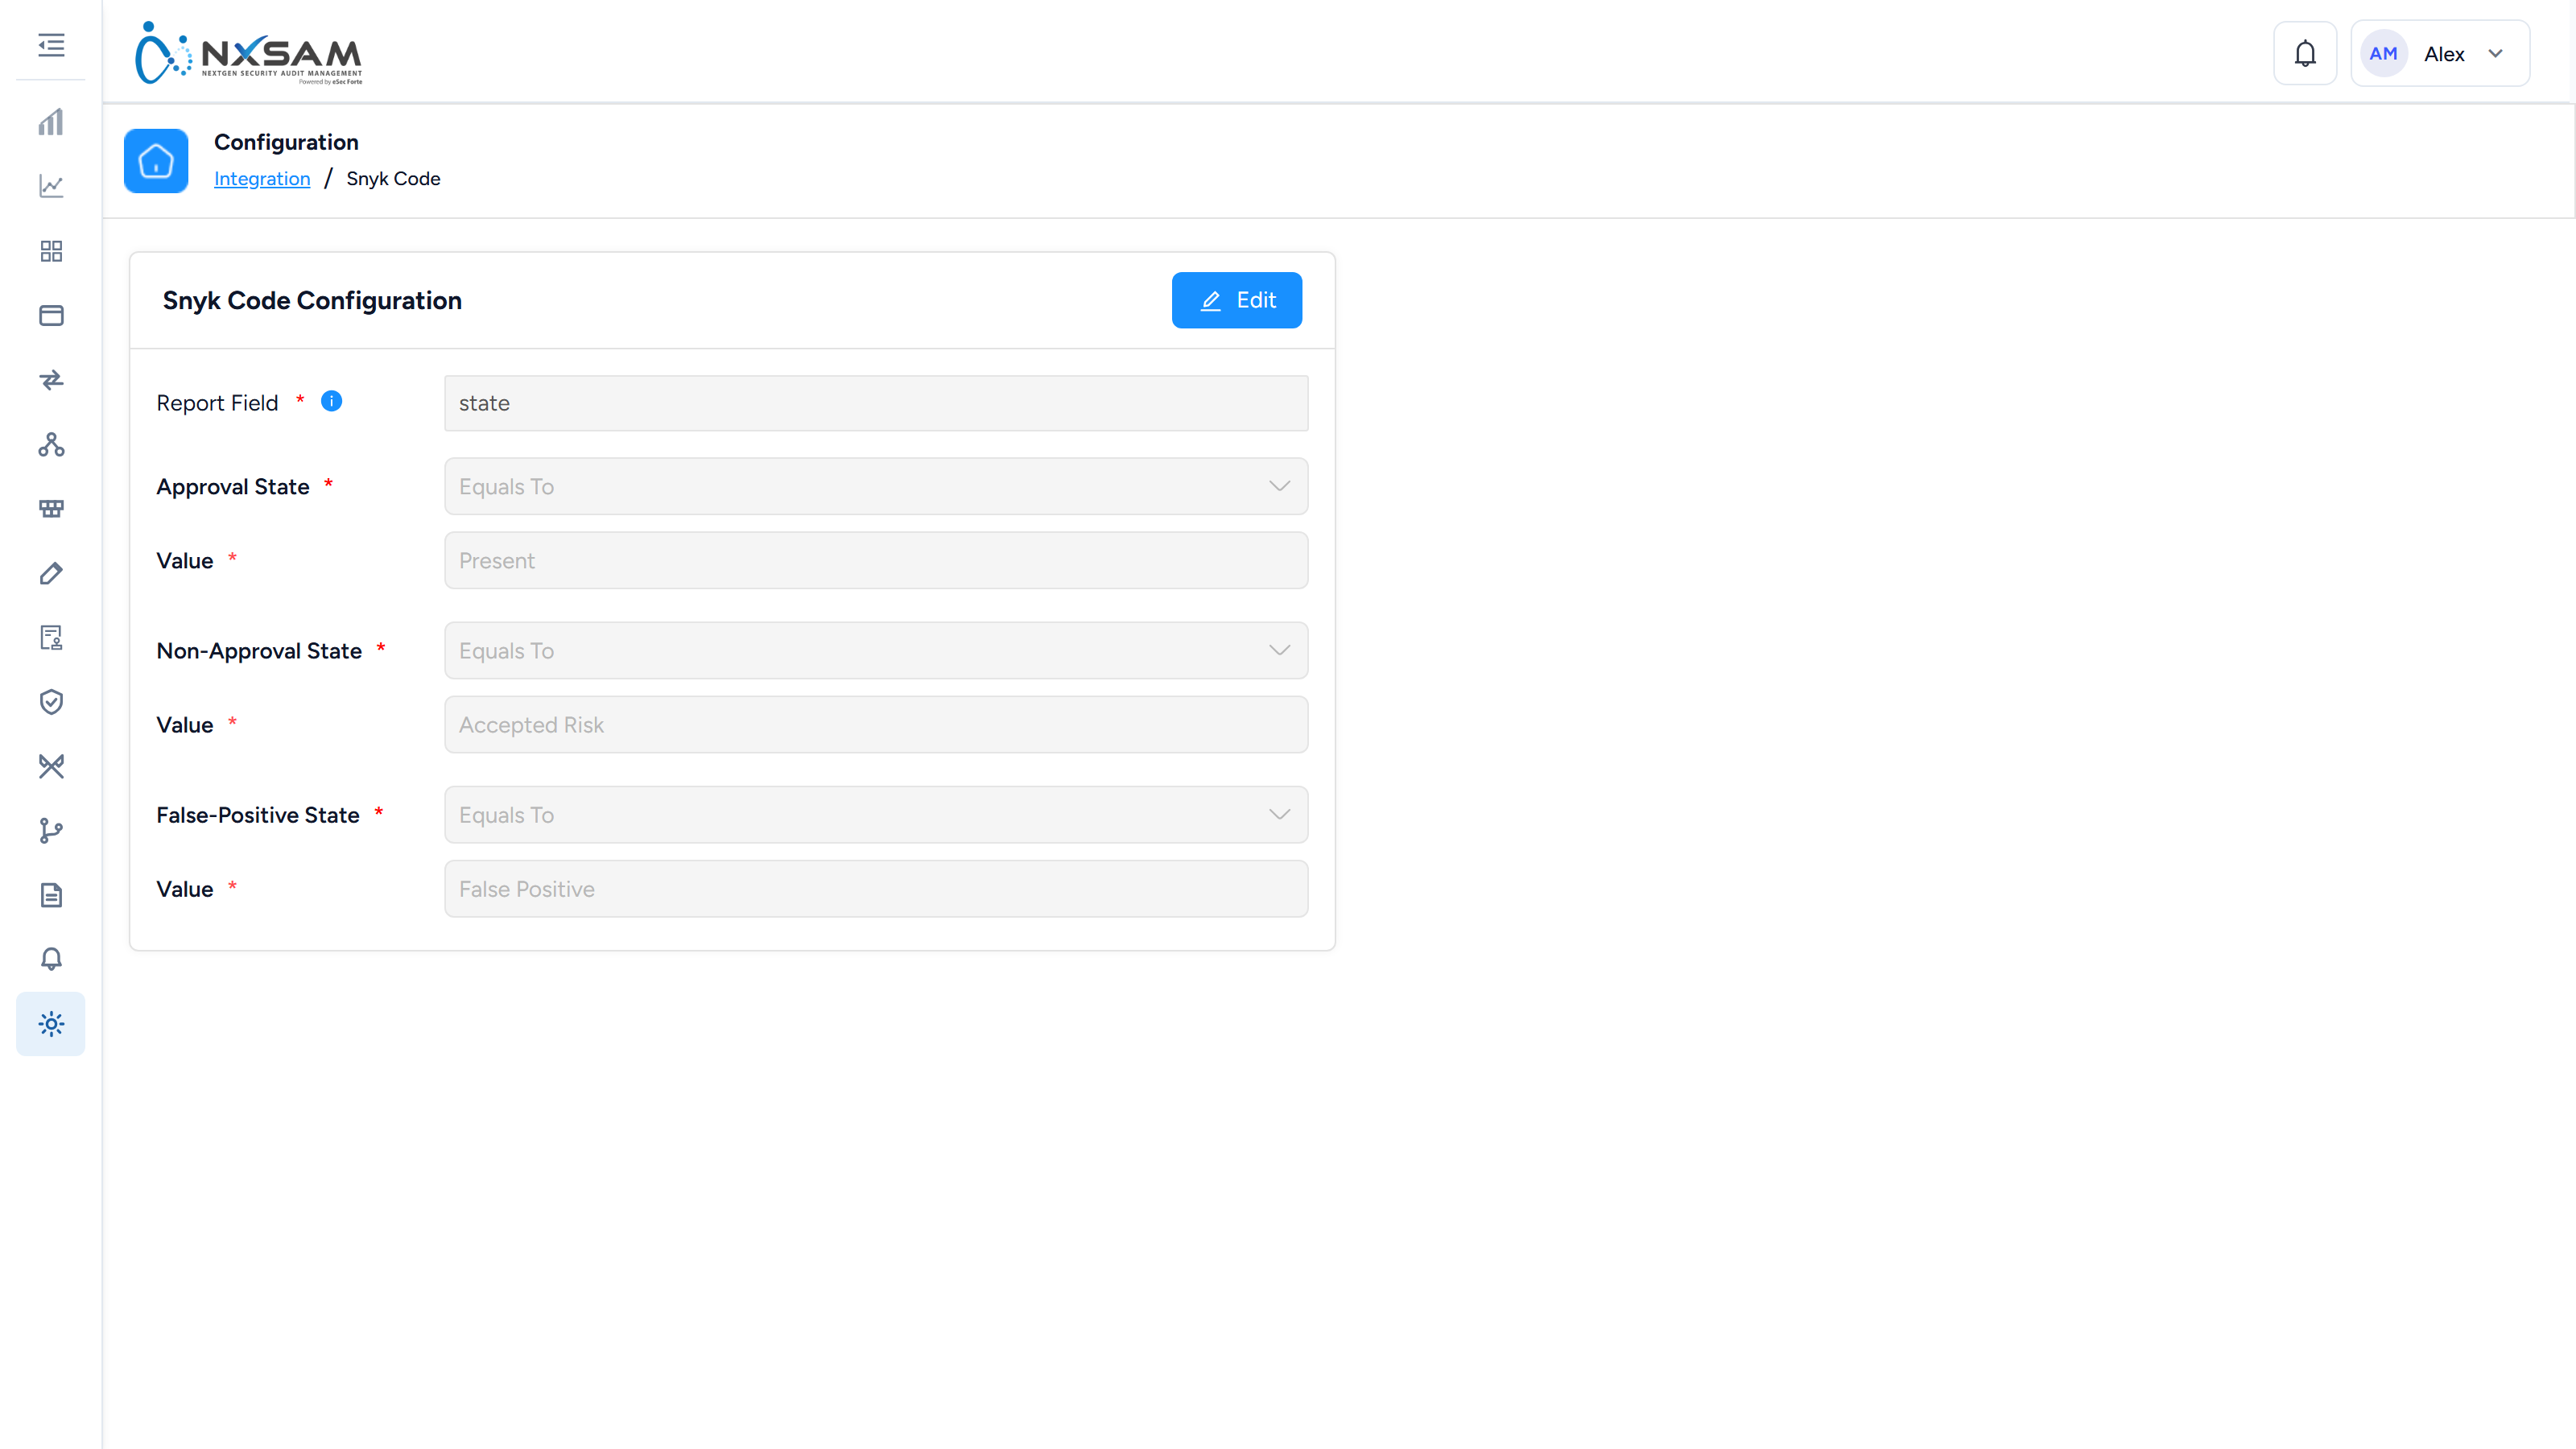
Tenable
Network VA. Credentials, plus the column mapping that decides how the report's dates and keys are read.
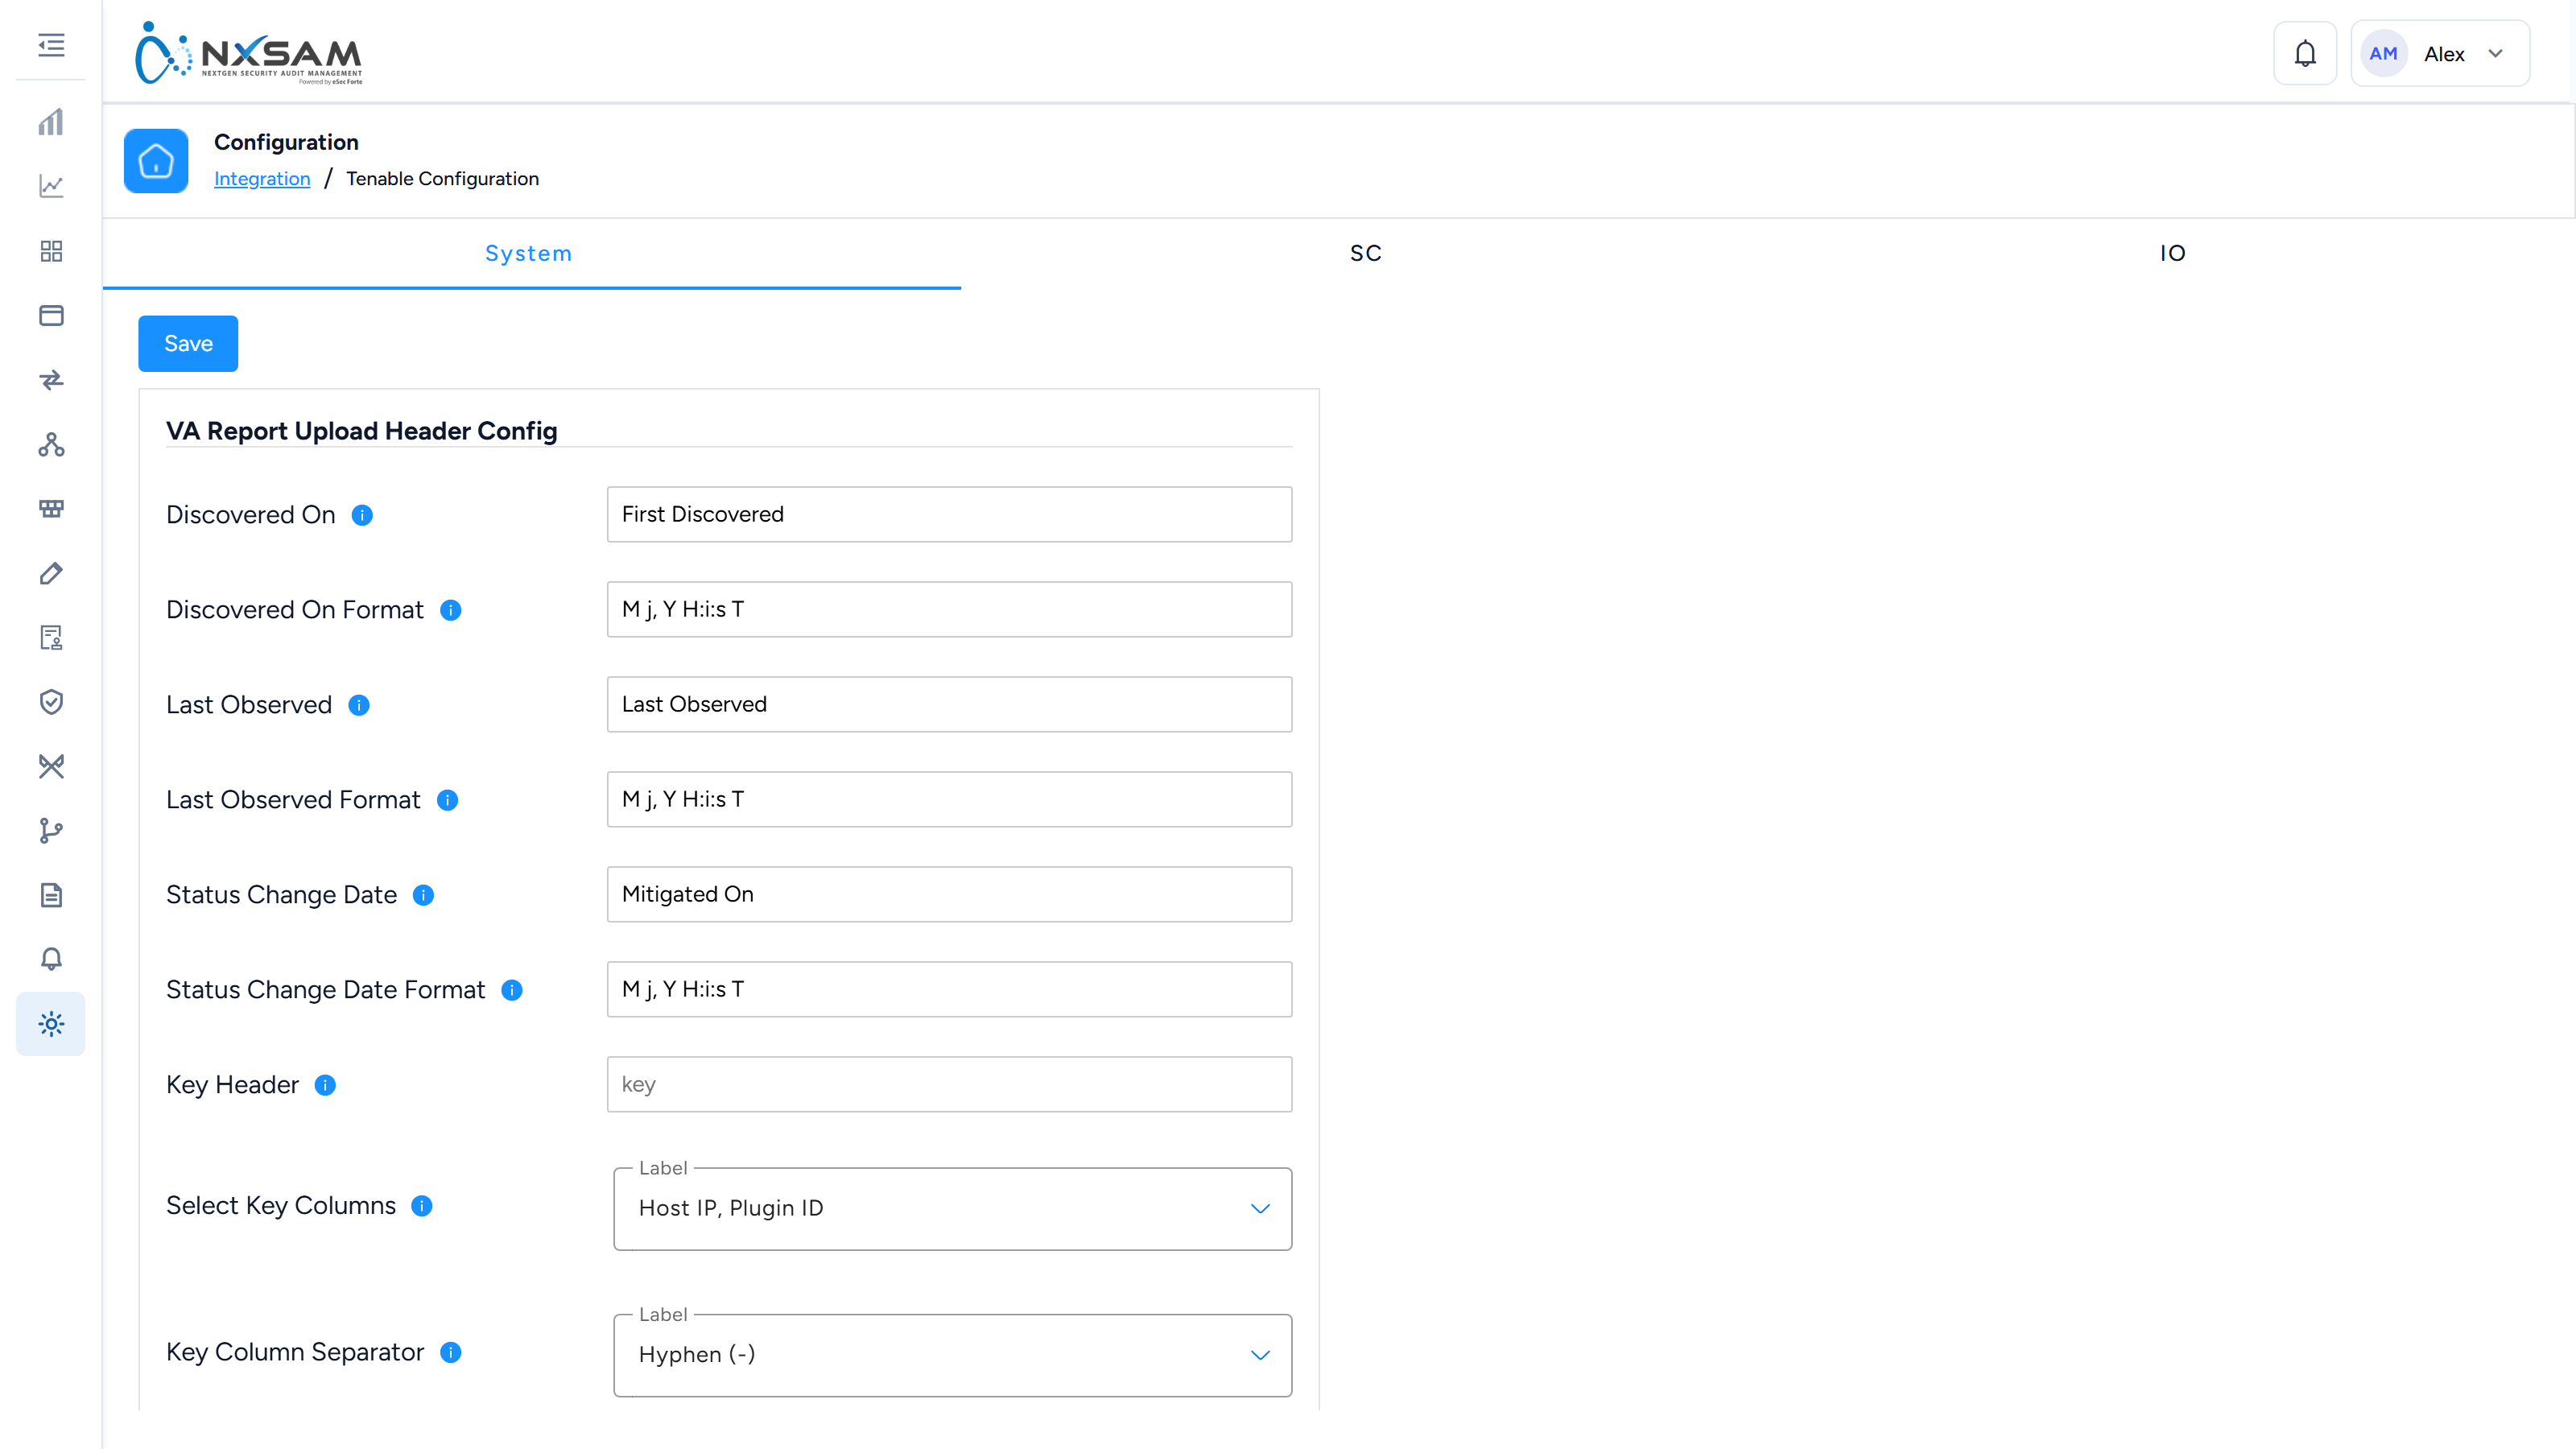
Vulnerability Mapping — Checkmarx
How this tool's identifiers line up with the catalogue, so the same weakness from two tools is one finding rather than two.
Administration
Administration
Administration covers who can use NxSAM, what they can see, and how the platform behaves. Most of it is set up once and revisited rarely — but the settings here shape what everyone else experiences, so changes deserve care.
Users, roles and groups
Three separate ideas that are easy to conflate:
| Controls | |
|---|---|
| Role | What a person can do — which modules and actions are available |
| Ownership | What a person can see — which assets and findings |
| User group | A convenient way to assign the above to several people at once |
Role and visibility are different mechanisms
Giving someone the Security Analyst role does not automatically show them every asset, and granting asset ownership does not give them new abilities.
"I can't see the module" is a role problem. "I can see the module but it's empty" is an ownership problem. They have different fixes.
SLA configuration
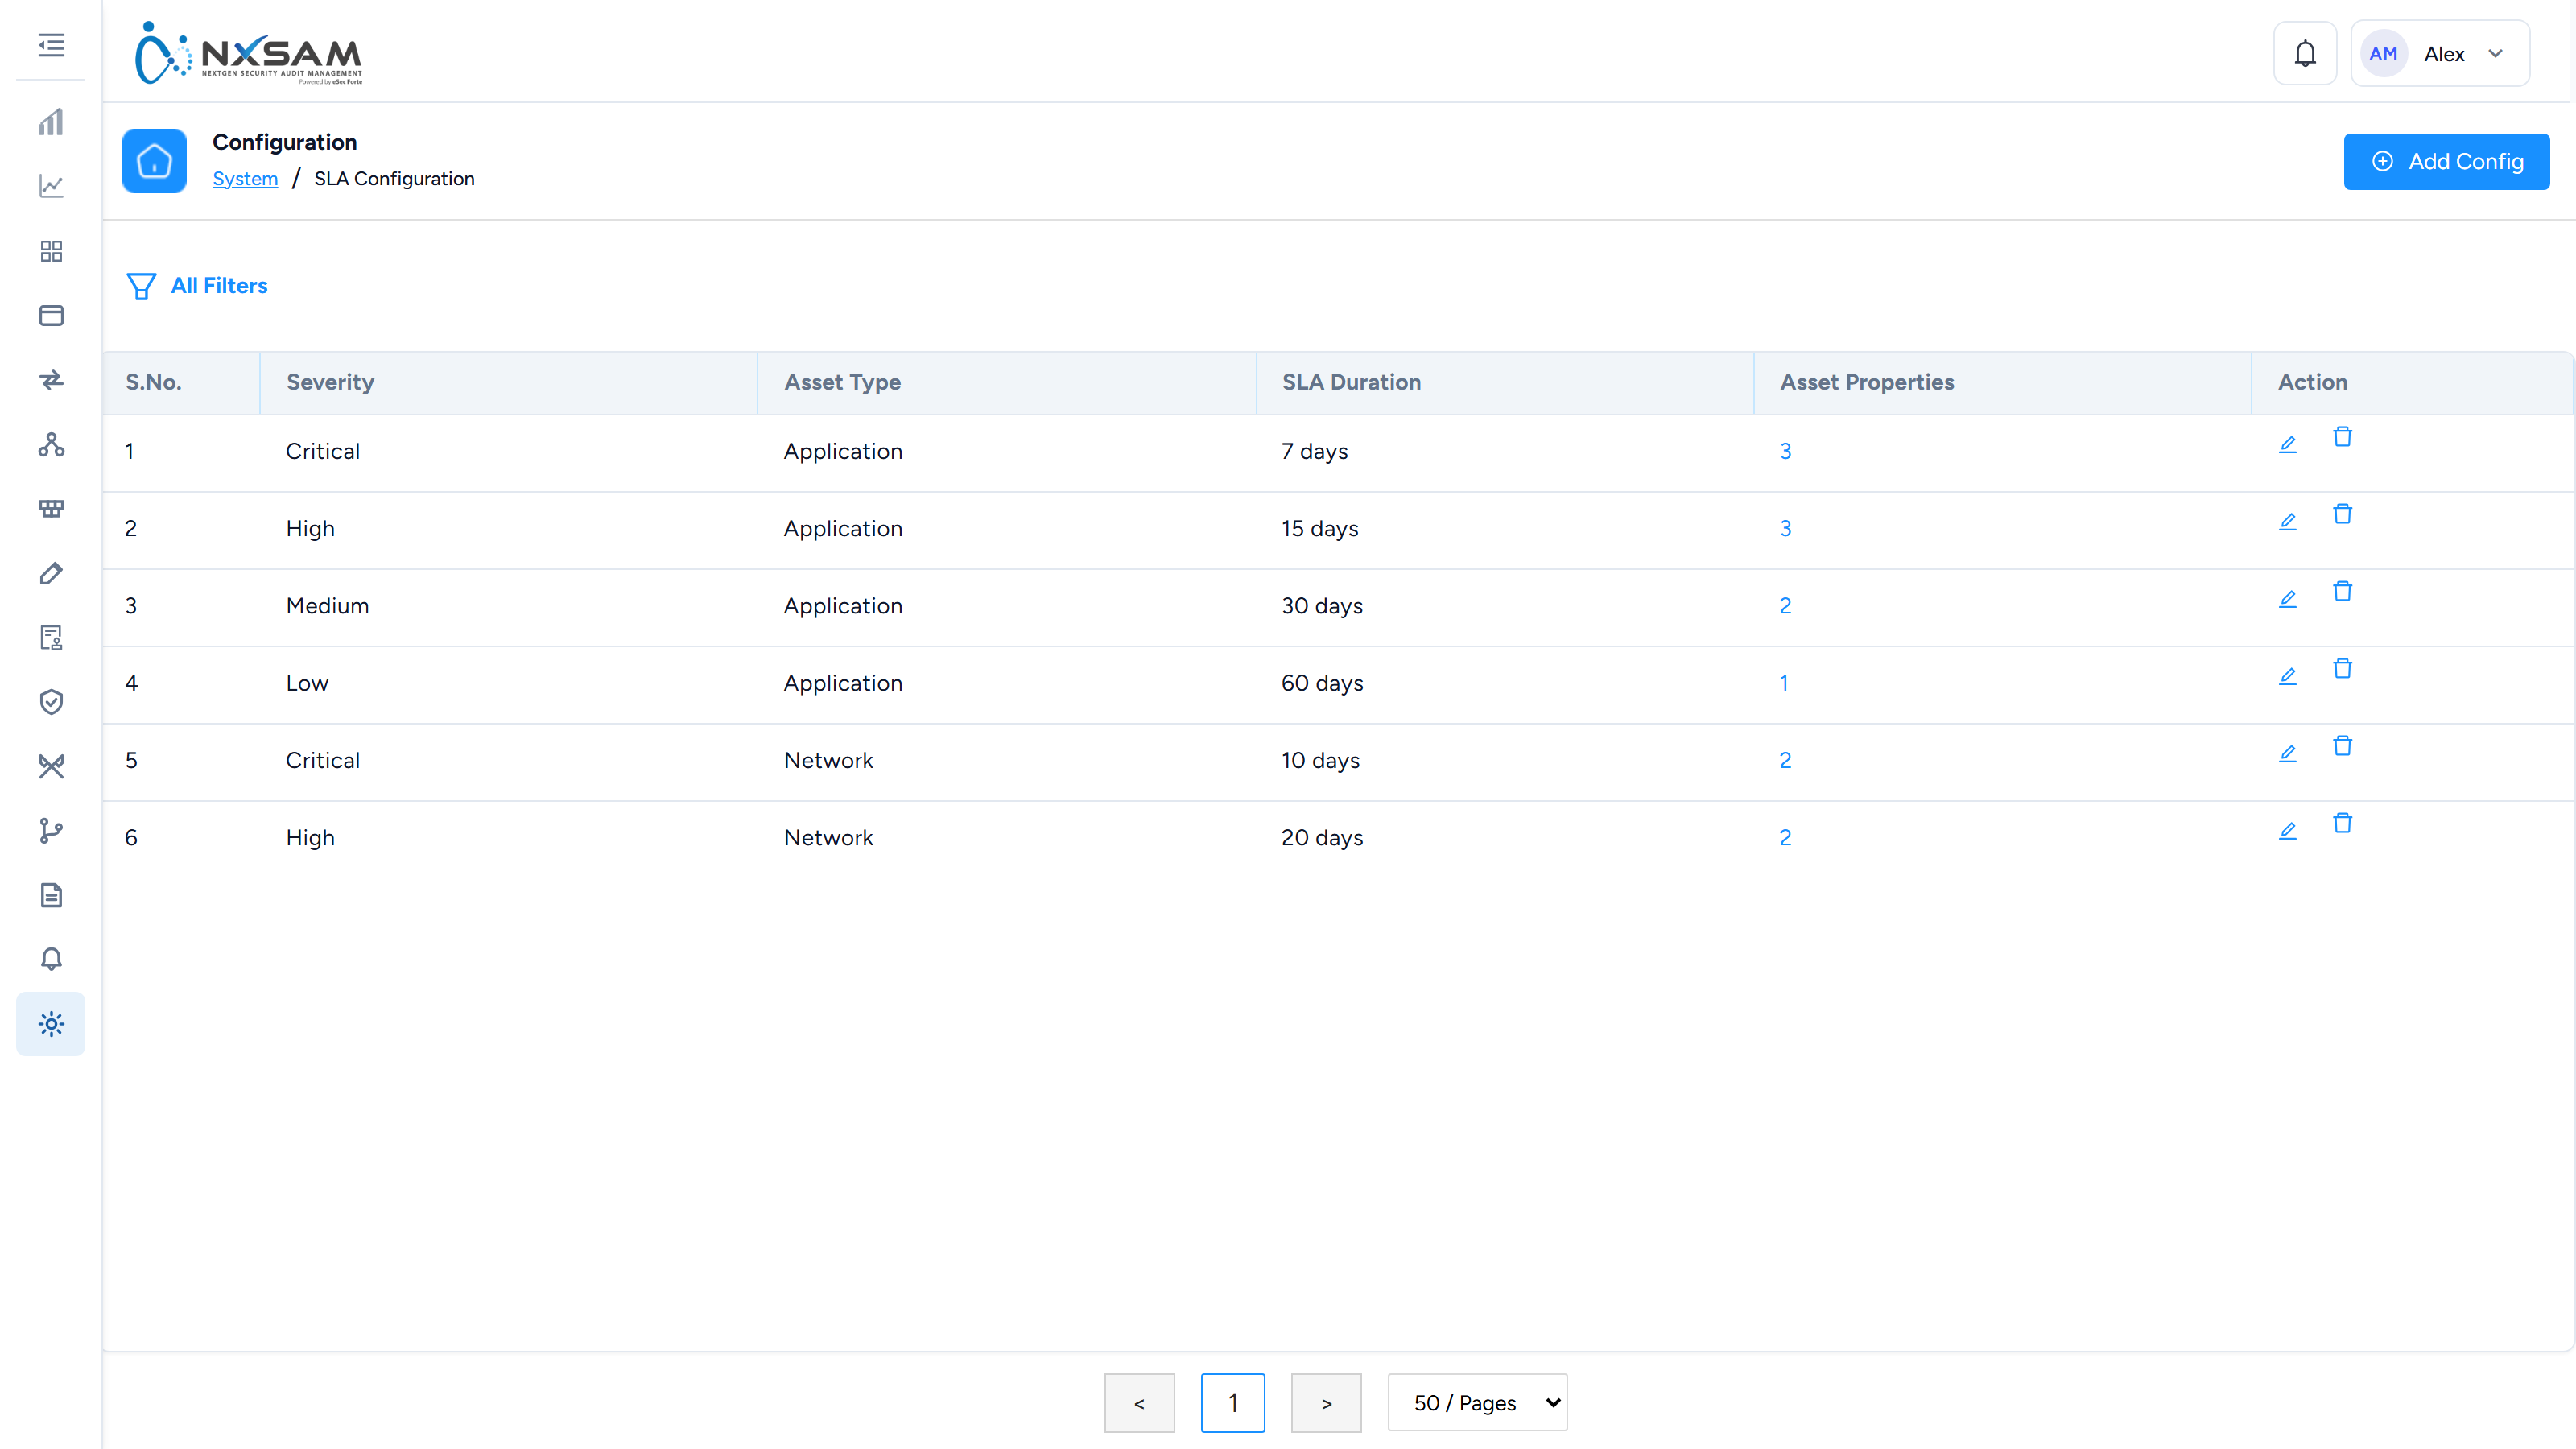
SLA settings define how long each severity has before it is overdue. This is the single most consequential setting in the platform: it determines what counts as late for every finding.
Two things to know before changing it:
- It applies going forward. Findings already carrying an SLA date keep it.
- Shortening an SLA can make many findings overdue at once, because the comparison is against today's date. Expect the overdue count to move immediately.
Severity colours
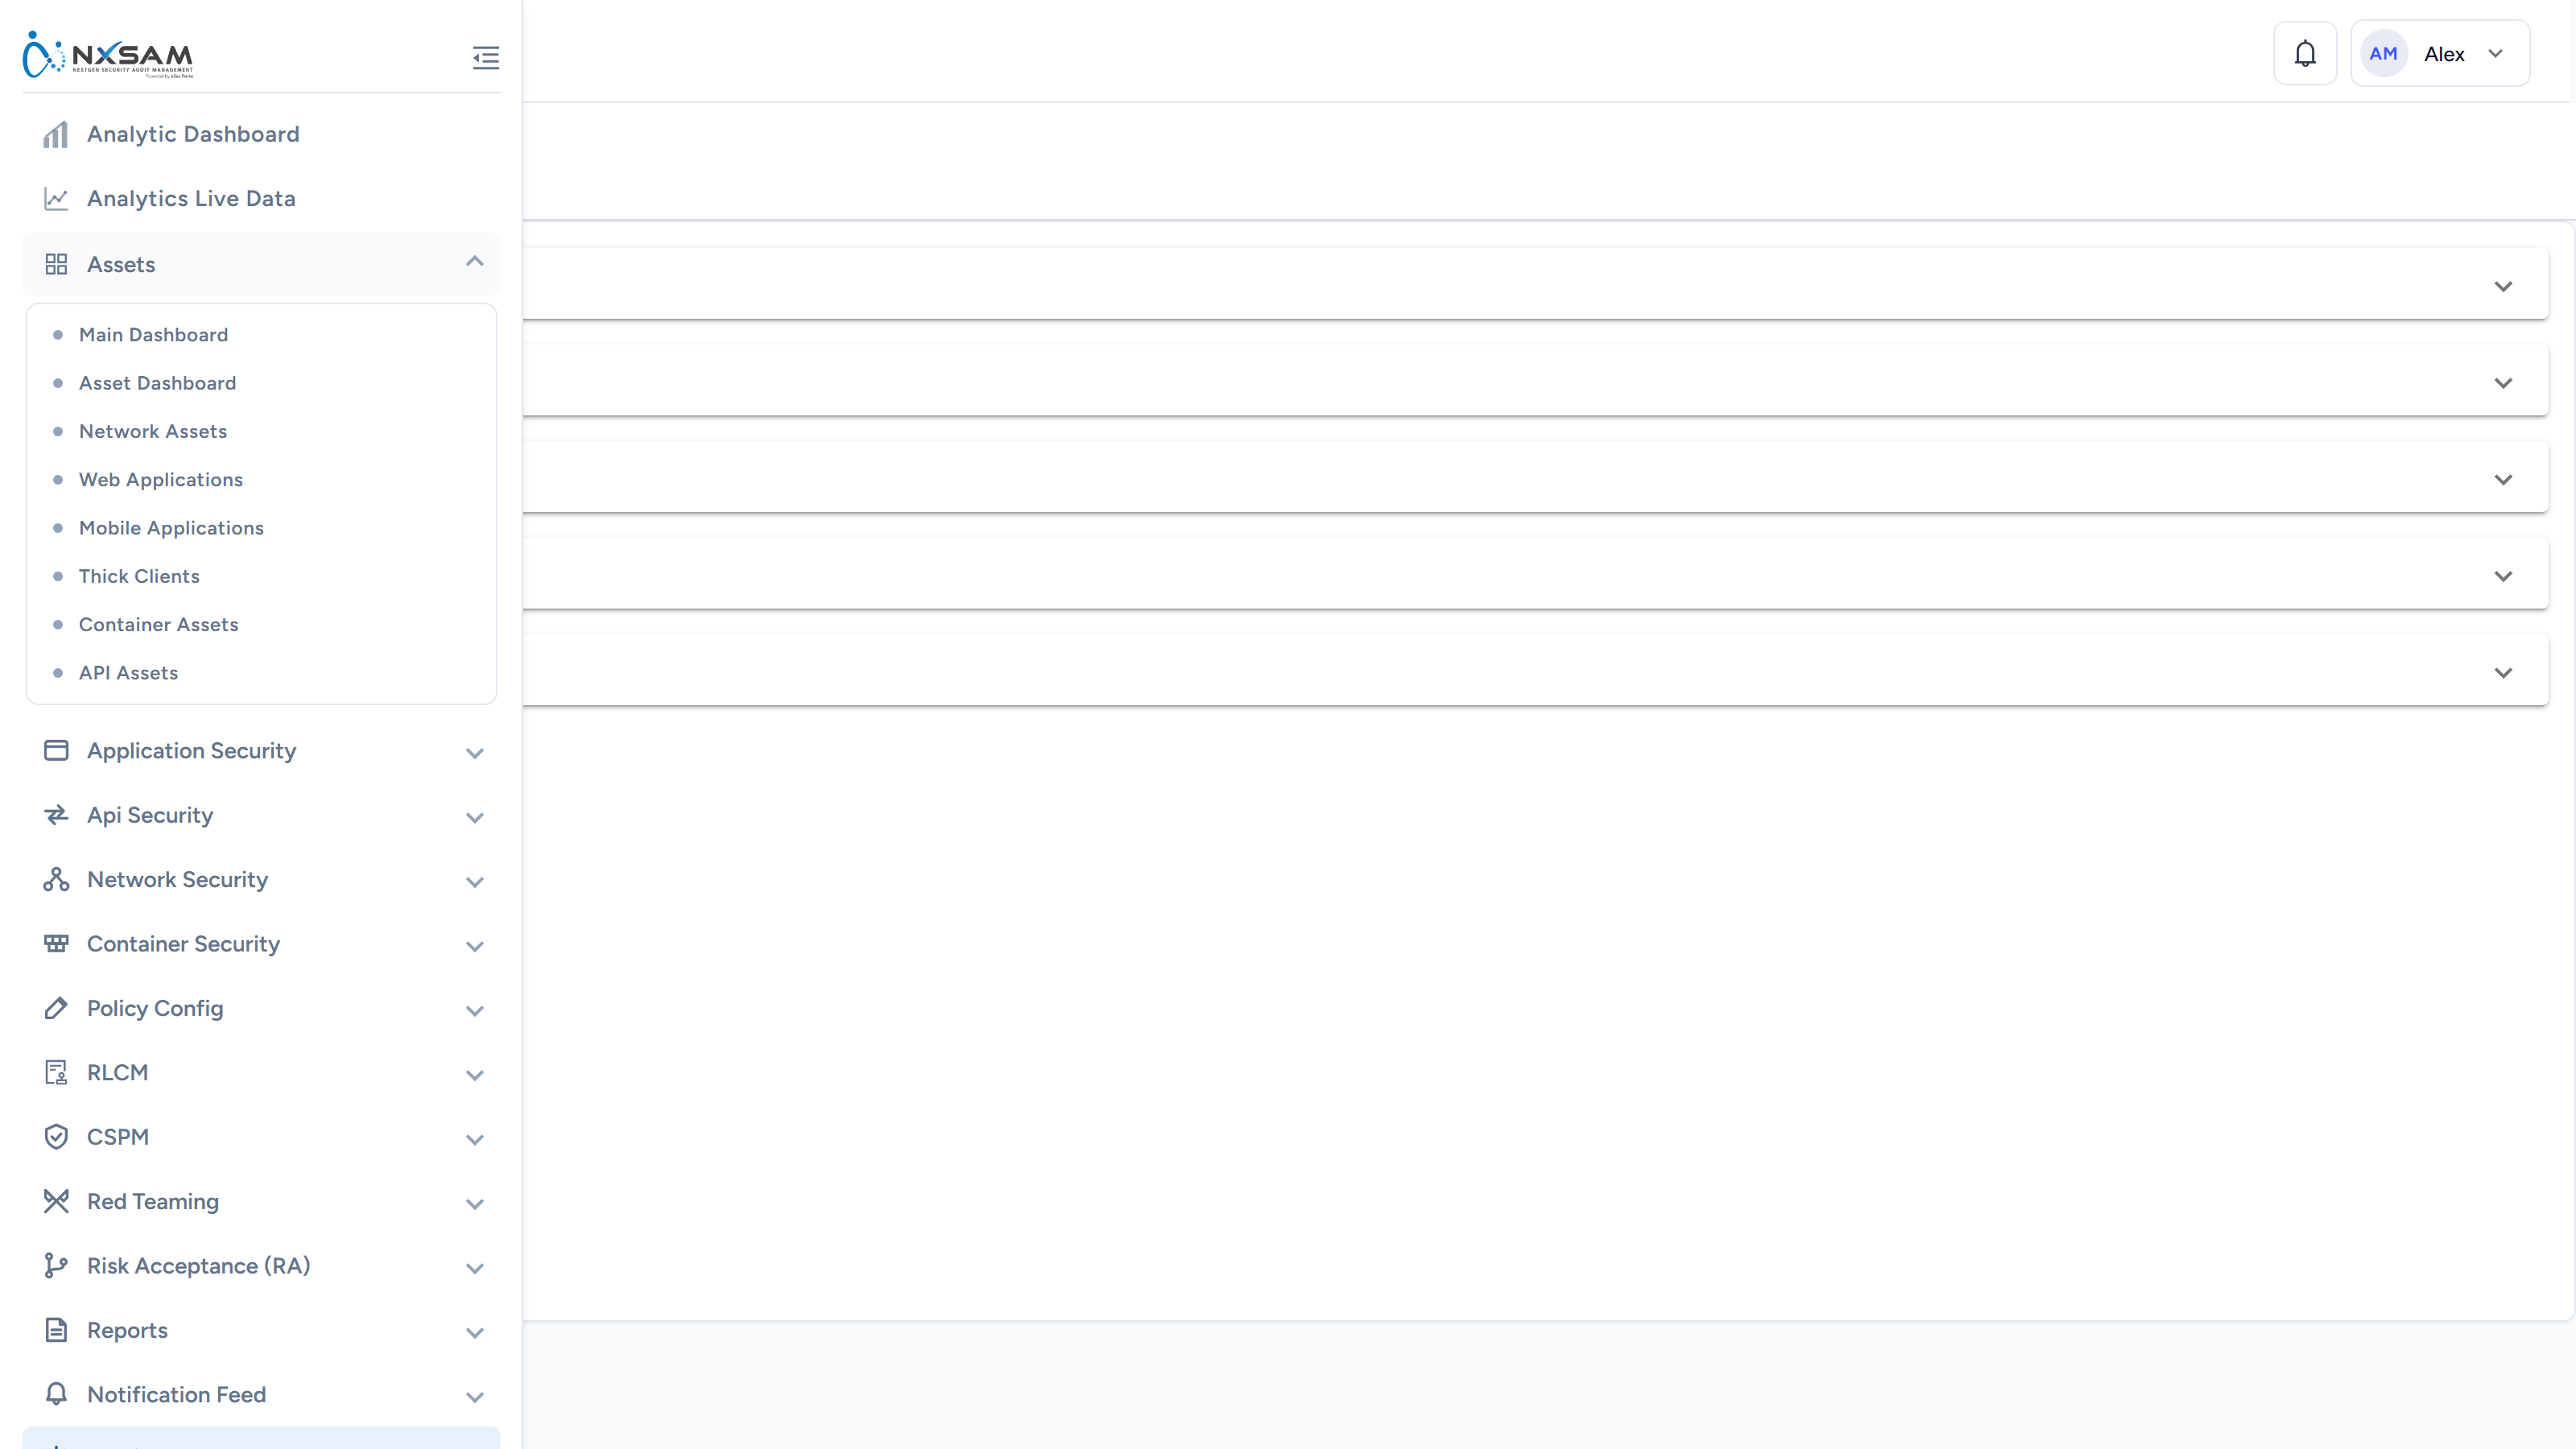
Severity colours are configurable and are used consistently across screens, reports and emails. Changing them changes every visual output, including reports already familiar to recipients — worth a note to users if you do.
Email configuration and templates
Email configuration is the connection to your mail server. Templates control what notifications actually say.
The email log is the first place to look when someone reports not receiving a notification: it distinguishes "never sent" from "sent but not delivered", which are very different problems.
Directory integration
Where corporate sign-on is configured, users authenticate against your directory and NxSAM does not hold their passwords. Roles and ownership are still managed in NxSAM — the directory answers who they are, not what they may do.
Audit management
Audit types and properties define the kinds of assessment your organisation runs and what metadata each captures. Adding a property makes it available on future audits; existing audits will not have a value for it.
A note on changing settings
Most settings here apply to what happens next, not to what has already happened. Changing an SLA does not re-date existing findings; changing an approval matrix does not re-route requests already raised. When a change appears not to have taken effect, check whether the records in question predate it.
Design a scheduled email report
Configuration → Email Template → Custom Email Template v2 lets you assemble a recurring security email — its figures, its tables, its charts, its spreadsheet attachment, its recipients and its schedule — without anyone writing a template for you. One definition can also fan out into many emails, one per owner, each carrying only that owner's findings.
This is the deepest configuration surface in the platform, so it is worth reading before you build rather than after.
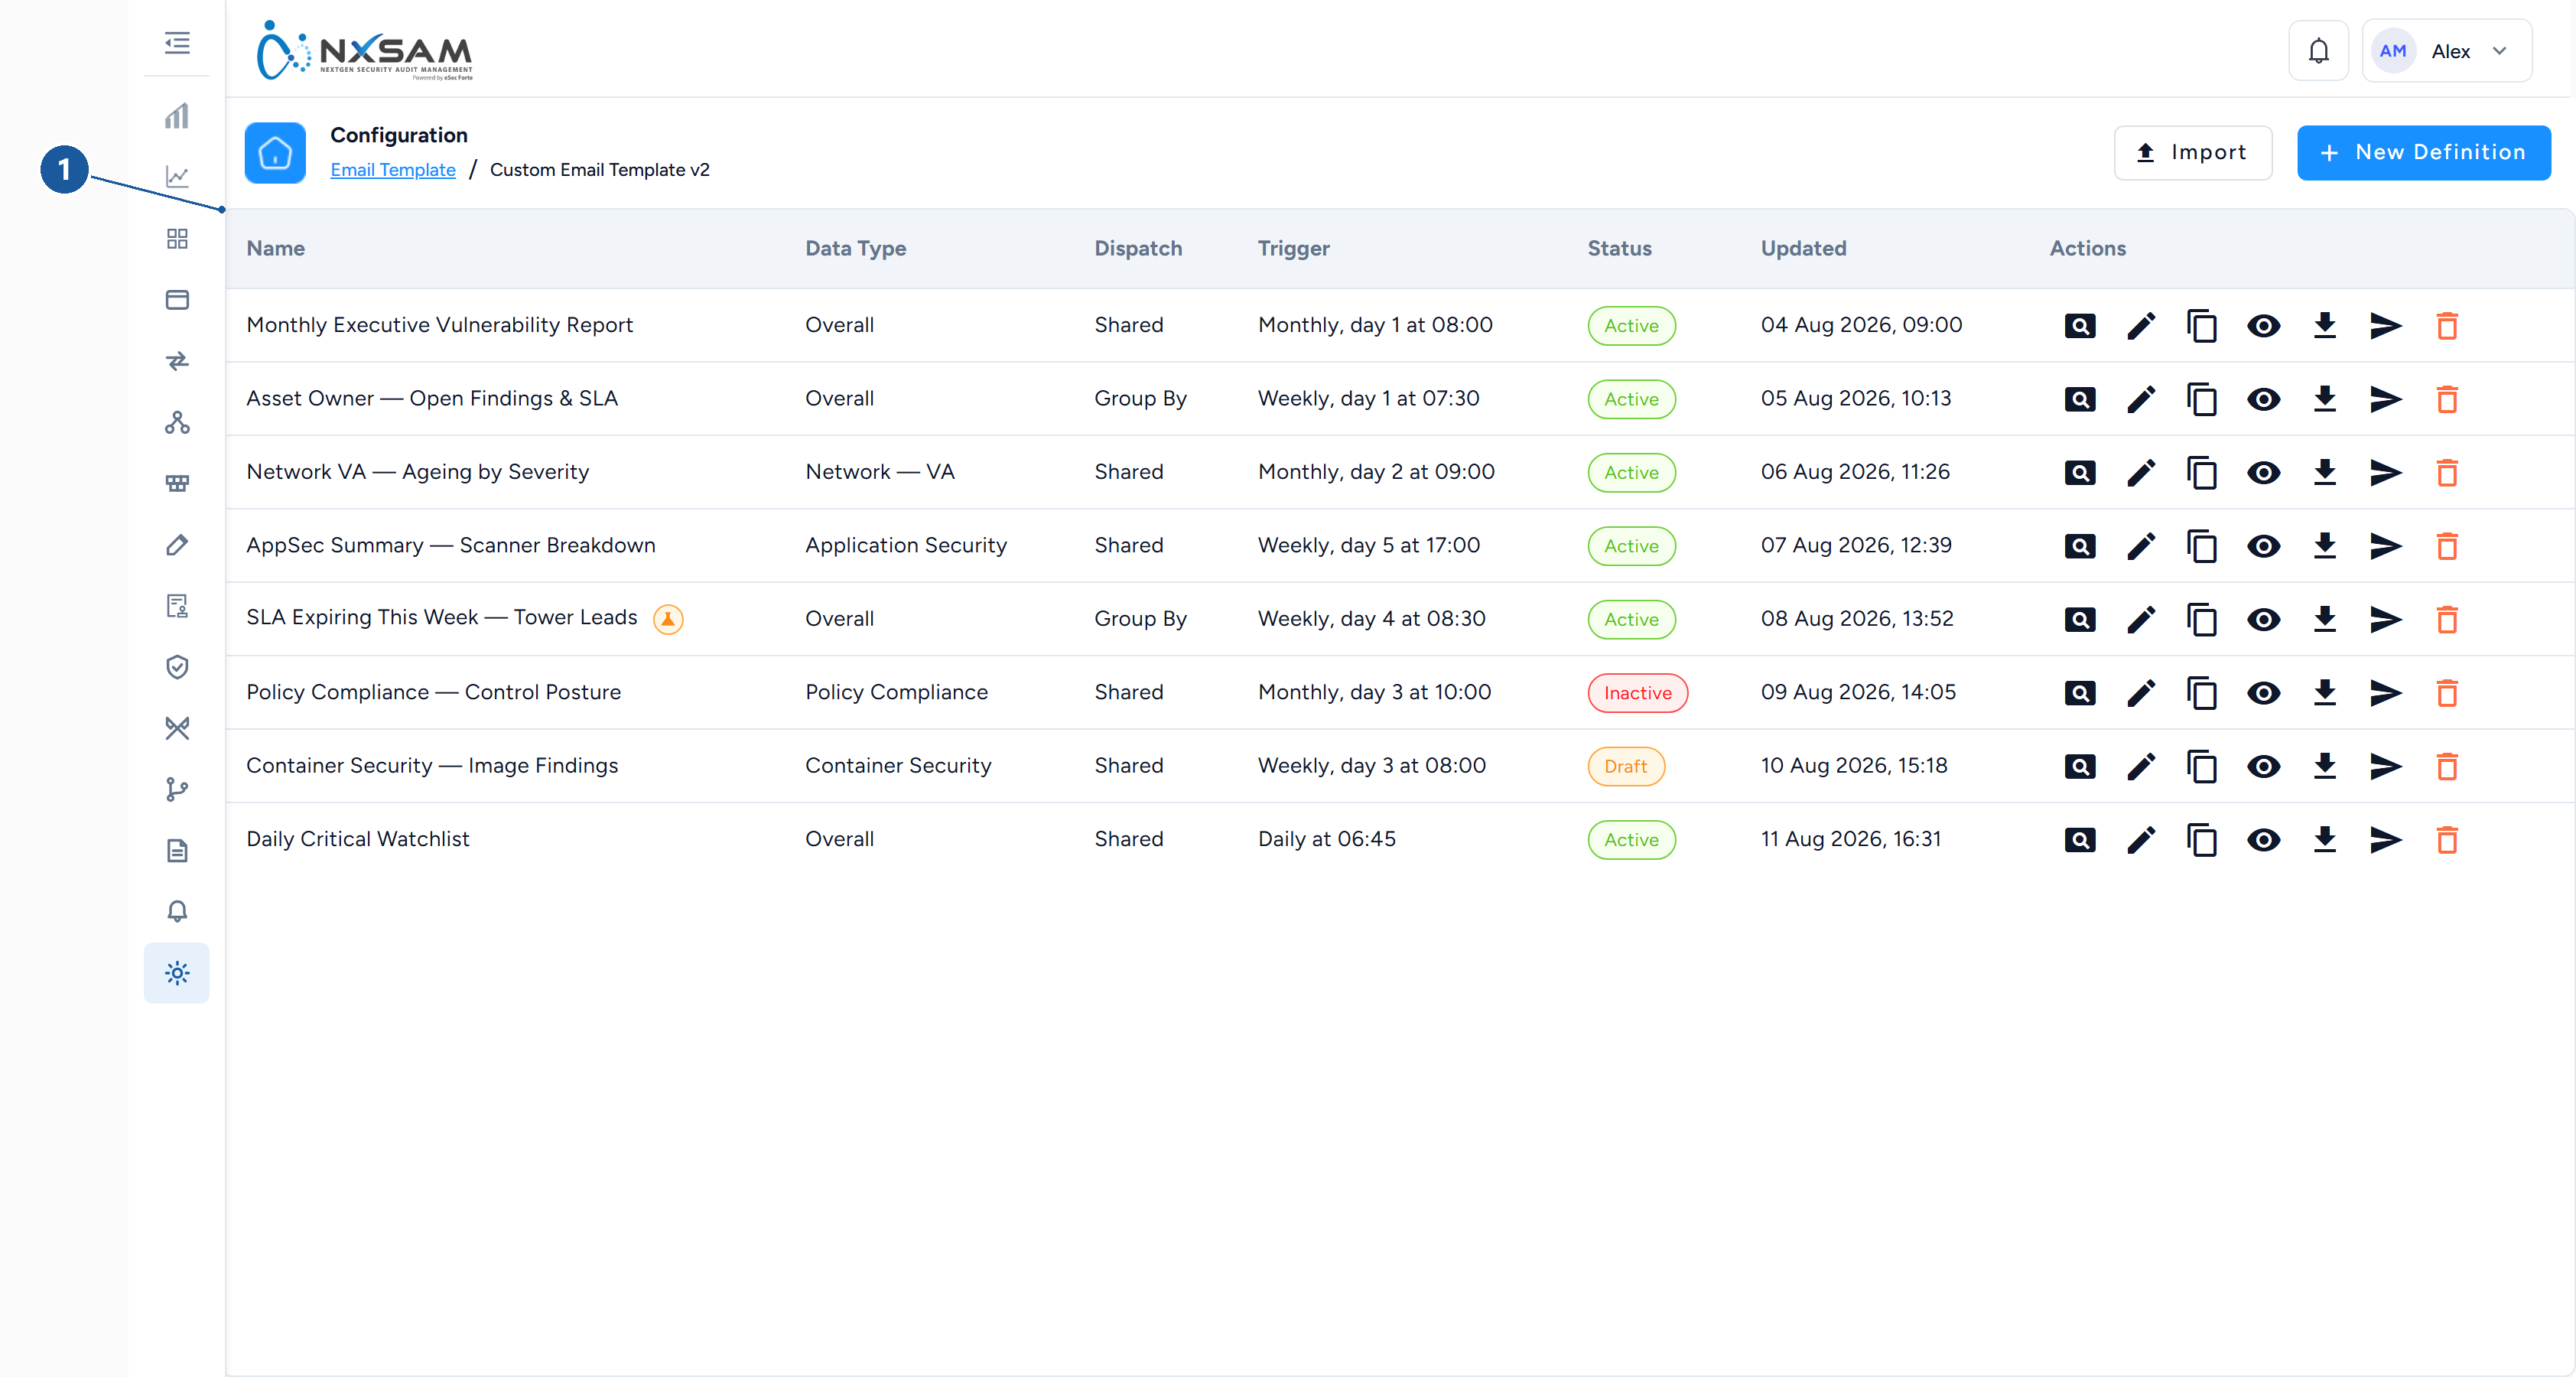
1 Dispatch mode, send cadence and status
The list, and what you can do from it
Each definition shows its Name, Data Type, Dispatch, Trigger, Status and when it was last Updated. A template running in test mode is flagged on its name.
New Definition starts an empty one; Import loads a definition exported elsewhere.
| Action | What it does |
|---|---|
| View | Opens every tab read-only. A banner says so, and Preview still works |
| Edit | Opens the same screen for changes |
| Clone | Copies the whole definition. The usual way to start — begin from something that already works |
| Preview email | Renders the email against live data, without sending |
| Export | Downloads the definition as a file |
| Import | Loads a definition exported from another instance |
| Send Now | Sends immediately, off-schedule |
| Delete | Removes it |
Each is separately permissioned, so a colleague can be allowed to preview and send without being allowed to edit or delete.
Status is Draft, Active or Inactive. Only Active definitions are picked up by
the schedule — a finished template left on Draft is the usual reason a report never
arrives.
Import and Export are how a report travels between environments
Build and prove a definition on a test instance, export it, import it into production. The file carries the whole definition, including any advanced settings the screen does not display.
Before you start: two decisions that shape everything else
One email, or one per owner?
Dispatch mode is the first choice and the one hardest to change later.
- Shared — a single email to a fixed audience. An executive summary, a weekly digest.
- Group by — one email per distinct value of a chosen field, each containing only that group's findings. Choose the field in Group By Field: any standard dimension, or any asset property you have defined. Pick the property that carries ownership, and each owner receives their own report with nobody else's findings in it.
Group-by is what turns one definition into a hundred personalised emails. It also changes what the recipient options mean, which is covered under Recipients.
Which findings are in scope?
Data Type groups the template in the list; Client scope restricts every data source to the chosen clients. Both are set on the first tab.
Tab 1 — Scope & Data
The name, subject and scope, and then the data sources — the figures everything else draws from.
The subject line
Type it freely and use Insert variable for values resolved at send time:
| Variable | Resolves to |
|---|---|
| Group value | The group this email is for — the owner's name, on a group-by template |
| Client name | The client the report belongs to |
| Today's date | The date the email is generated |
| Month & year | For example June 2026 — the natural choice for a monthly report title |
| Month | The month name alone |
A subject of Monthly Vulnerability Report — Group value — Month & year produces Monthly Vulnerability Report — Payments Platform — June 2026 for one recipient and the same line with their own group for the next.
Data sources
A data source is one query. Every table, chart and card in the email names a source, so build these first. Give each a short Key — you will pick it by that name later.
Each source has three parts: where it reads from, how it shapes the result, and what it excludes.
Source is the population: Open Issues, VA Closed or PC Closed.
Mode decides the shape, and which fields appear below it:
| Mode | Shape | Feeds |
|---|---|---|
| Aggregate | One metric, grouped by one dimension | Summary tables, summary cards, bar charts, chart images |
| Metrics | Several metrics as columns, grouped by one dimension | Metrics tables |
| Matrix | One metric across two dimensions, optionally grouped by a third | Matrix tables, grouped matrix tables, charts |
| Nested | Parent group → member rows → value columns | Nested tables |
| List | Raw finding rows with the columns you choose | Data tables, and the attachment |
| Trend | A metric over months | Line charts |
Metrics available to aggregate, metrics and matrix modes:
| Metric | Notes |
|---|---|
| Issue Count | The default |
| Affected Assets | Distinct assets rather than findings |
| Avg Vuln Score, Total Vuln Score | Weighted views |
| Overdue Count, Overdue % | Past the SLA date |
| No-SLA Count | Findings with no SLA date at all |
| Within-SLA Count | Still inside the SLA |
| Exception Count, No-Exception Count | Risk-accepted and not |
| SLA Breached (exclusive), Within SLA (exclusive), Exception (exclusive), Exception Under Approval (exclusive) | Mutually exclusive states — see the note below |
| MTTR (Days) | Mean time to remediate. Closed sources only |
The 'exclusive' metrics exist so a table can total correctly
The plain metrics overlap: a risk-accepted finding can also be past its SLA date, so it appears under both Exception Count and Overdue Count, and a table built from them sums to more than the real total. The exclusive family assigns each finding to exactly one state, so the columns add up. Use the exclusive set whenever a table shows a total; use the plain set when you want each question answered on its own.
Dimensions are the fields to group by: Severity, Module, Asset Type, Vuln Status, Age Band, Age (Days), Age Since Overdue (Days), SLA Status, SLA Status (exclusive), SLA, Tool, Audit Category, Application, Application Name (Linked), App Sub Type (Linked), Assessment Group and Module Bucket — plus every asset property you have defined.
Every source carries its own filters, and they are the difference between a report that answers a question and one that dumps everything:
- Severities and Modules — restrict the population
- Tool — restrict to particular scanners
- Dimension Filters — any dimension or asset property, Include or Exclude, with real values offered from your data rather than typed from memory. This is how a source becomes "servers only" or "everything except the sandbox environment"
- Sort — high to low, or low to high
- Row limit — list mode only
SLA window appears on Open sources and restricts by SLA date: already overdue, expiring today, or expiring soon, where you set how many days ahead counts as soon. Those three windows are exactly the classic SLA-warning emails, now built rather than coded.
Age buckets appear whenever the source groups by age. Enter ascending day counts —
30, 90, 180, 365 produces 0–30, 31–90, 91–180, 181–365 and 365+. Leave it blank for the
standard bands. Matrix sources can also render those labels compactly, which matters when
a table has five age columns and a narrow email body.
Tab 2 — Body
The email body is an ordered list of blocks. Add Block, choose a type, set its width, and move it with the arrows in its header. Widths run from full to two-thirds, half, a third and a quarter, so two half-width blocks sit side by side.
A block reads from a data source, and the source list only offers sources it can actually render — a matrix table will not offer you a list source. If a block's source dropdown is empty, the data source it needs has not been built yet.
| Block | Reads from | What it produces |
|---|---|---|
| Text | — | Free rich text, with the same variables as the subject plus a running total per data source |
| Summary cards | Aggregate | The headline figures as cards |
| Summary table | Aggregate | The simple one-dimension table |
| Metrics table | Metrics | A dimension down the side, several metrics across |
| Matrix table | Matrix | Two dimensions crossed, with totals |
| Grouped matrix table | Matrix with a group dimension | Three dimensions: an outer status grouping, ageing rows and severity columns |
| Nested table | Nested | Parent rows with member sub-rows |
| Data table | List | Actual findings, with the columns and headings you choose |
| Bar chart | Aggregate or matrix | Bars drawn in the email itself — crisp at any zoom, and visible even where images are blocked |
| Chart image | Aggregate, matrix or trend | A rendered chart: column, grouped, line, pie or donut |
| Section repeat | Aggregate or metrics | Repeats a set of blocks once per value of a field |
| Link | — | A labelled link |
Controls worth knowing
Every table lets you rename its headings. First column label, total label, and on data and metrics tables a custom heading per column. An email that says Application where your organisation says Service is one field away from matching how people speak.
Row and column order are yours: type the values in the order you want them, comma separated. Severity columns in Critical, High, Medium, Low, Info rather than alphabetical is a comma-separated list, not a support request.
Zero handling — show zero values or leave the cell blank, and hide rows that are all-zero. A monthly report whose table is nine-tenths empty usually needs one toggle.
Conditional formatting on metrics and nested tables colours a cell when it crosses a threshold — Overdue % at or above 50 → red. Choose the metric, the comparison (including between), the value and the colour. This is what makes a table scannable rather than merely accurate.
Box height appears on charts and data tables. Set the same value on two side-by-side blocks and their boxes align, which is the difference between a tidy email and a ragged one.
Chart options vary by type: value labels and legend on all of them; curve and point markers and a zero-based axis on lines; stacking on grouped columns; count, percentage or one-decimal formatting on pie and donut; sort order and a top-N cut on bars; and a series order you can type when the default order is not the one you mean.
Data tables are a preview, not the full list
A data table's Max Rows caps it at the most severe findings — up to a hundred. The complete list belongs in the attachment. An email carrying thousands of rows inline is one many mail clients will truncate or refuse.
Tab 3 — Attachment
Turn the attachment on and choose XLSX or CSV. Then choose a mode:
- Flat — one row per finding. Pick the columns and give each its own heading.
- Grouped — grouped by a dimension or column, with a severity count per group. Choose which severities become columns.
- Grouped multi — a parent and a member dimension, with severity columns, split across sheets you define. Each sheet bundles a set of tools onto its own tab — one for SAST, one for DAST, one for dependency findings.
The attachment reads a list source, and the columns available include the full finding detail — title, asset, host, port, protocol, CVE, scanner and its identifier, status, first reported, SLA expiry, risk acceptance and its comment, audit, project, client, app code, public-facing flag, duration, plus description, synopsis, diagnosis, impact and solution, and every asset property you have defined.
The builder warns when the attachment cannot reconcile with the email
If the attachment's source is filtered differently from the sources feeding the body — a different tool or module set — a warning appears on this tab. Ignore it and you will ship an email whose table says one number and whose spreadsheet says another, which costs more trust than the report earns. Align the filters.
Tab 4 — Recipients & Dispatch
Recipients are resolved at send time rather than listed, which is what keeps a group-by report correct as ownership changes.
| Resolver | Resolves to |
|---|---|
| Asset owner | The owner named on the asset. Choose which property carries ownership |
| Group owner | The group's owner — a tower lead, for instance |
| Asset access | Everyone with access to this group's assets. Super-admins are excluded unless you switch them in |
| Static emails | Addresses you type, comma or newline separated |
Build To and CC independently, and mix resolvers freely — the owner in To, a static distribution list in CC.
Test mode
Test mode redirects every email to addresses you name. Each message is still generated with its real per-group data and its real resolved recipients, shown in a banner at the top, but delivery goes only to the test addresses.
This is how you validate a group-by report that would otherwise reach a hundred people: turn it on, send, read what each owner would have received, then turn it off.
Test mode with no recipients sends nothing
That is deliberate. A blank list fails safe rather than falling back to the real audience.
Tab 5 — Schedule and branding
Frequency is daily, weekly or monthly. Weekly and monthly ask for a day; all three ask for a time. A monthly report set for day 31 will not fire in a short month — pick 28 or earlier for a report that must arrive every month.
Branding & style applies to the whole email:
- Brand name in the header
- Theme preset — eSec Maroon, Corporate Navy, Slate Professional, Teal & Amber, Indigo & Rose, or Graphite for printing and colourblind readers. A preset fills every colour below in one click and you can then adjust any of them
- Frame colours — primary, primary dark, panel header and border
- Chart series colours — the first three series
- Shell width in pixels, between 480 and 1200
Severity colours stay fixed. Red for the most severe is a convention people read without thinking, and re-colouring it costs more comprehension than any palette gains.
Preview before you save, and again before you activate
Preview renders the email against live data at any point, including on a draft you have not saved. On a group-by template it renders one group, so you see a real recipient's email rather than an abstraction.
The sequence that avoids embarrassment:
- Build it and Preview until the figures look right.
- Turn on Test mode, set it Active, and Send Now. Read the real thing.
- Check the attachment reconciles with the body.
- Turn test mode off and leave it Active on its schedule.
A template can carry settings this screen does not show
If a definition was authored elsewhere and uses options beyond the builder, a banner lists them by name. Those settings are preserved when you save — the screen will not quietly drop them — but changing them means exporting the definition, editing the file and importing it back.
When a report does not arrive
In order of likelihood:
- Status is Draft or Inactive. Only Active definitions are scheduled.
- Test mode is still on, so it went to the test addresses. The list flags this on the template's name.
- The schedule has not come round yet — a daily template sends at its time, not when you finish editing. Use Send Now to confirm the template works.
- No recipient resolved. A group with no owner set produces no address. Preview shows the resolved recipients per group.
- The email was sent but not delivered — check the email log, which records what was queued, to whom, and whether it failed.
Tuning how findings are classified
These screens decide how a raw scanner finding becomes a prioritised item of work. They are set up rarely and have wide effects, so each one is worth understanding before it is changed.
CVSS configuration
Sets how CVSS scores map onto NxSAM's severity levels — the boundary between High and Critical, and so on.
Changing the mapping re-classifies existing findings
Severity is derived, not stored per finding. Move a boundary and findings on either side of it change severity — which changes their SLA, which can make a batch of findings overdue that were not overdue yesterday.
This is the single change most likely to produce a sudden, unexplained jump in overdue counts. If one appears, ask what was changed here before investigating the data.
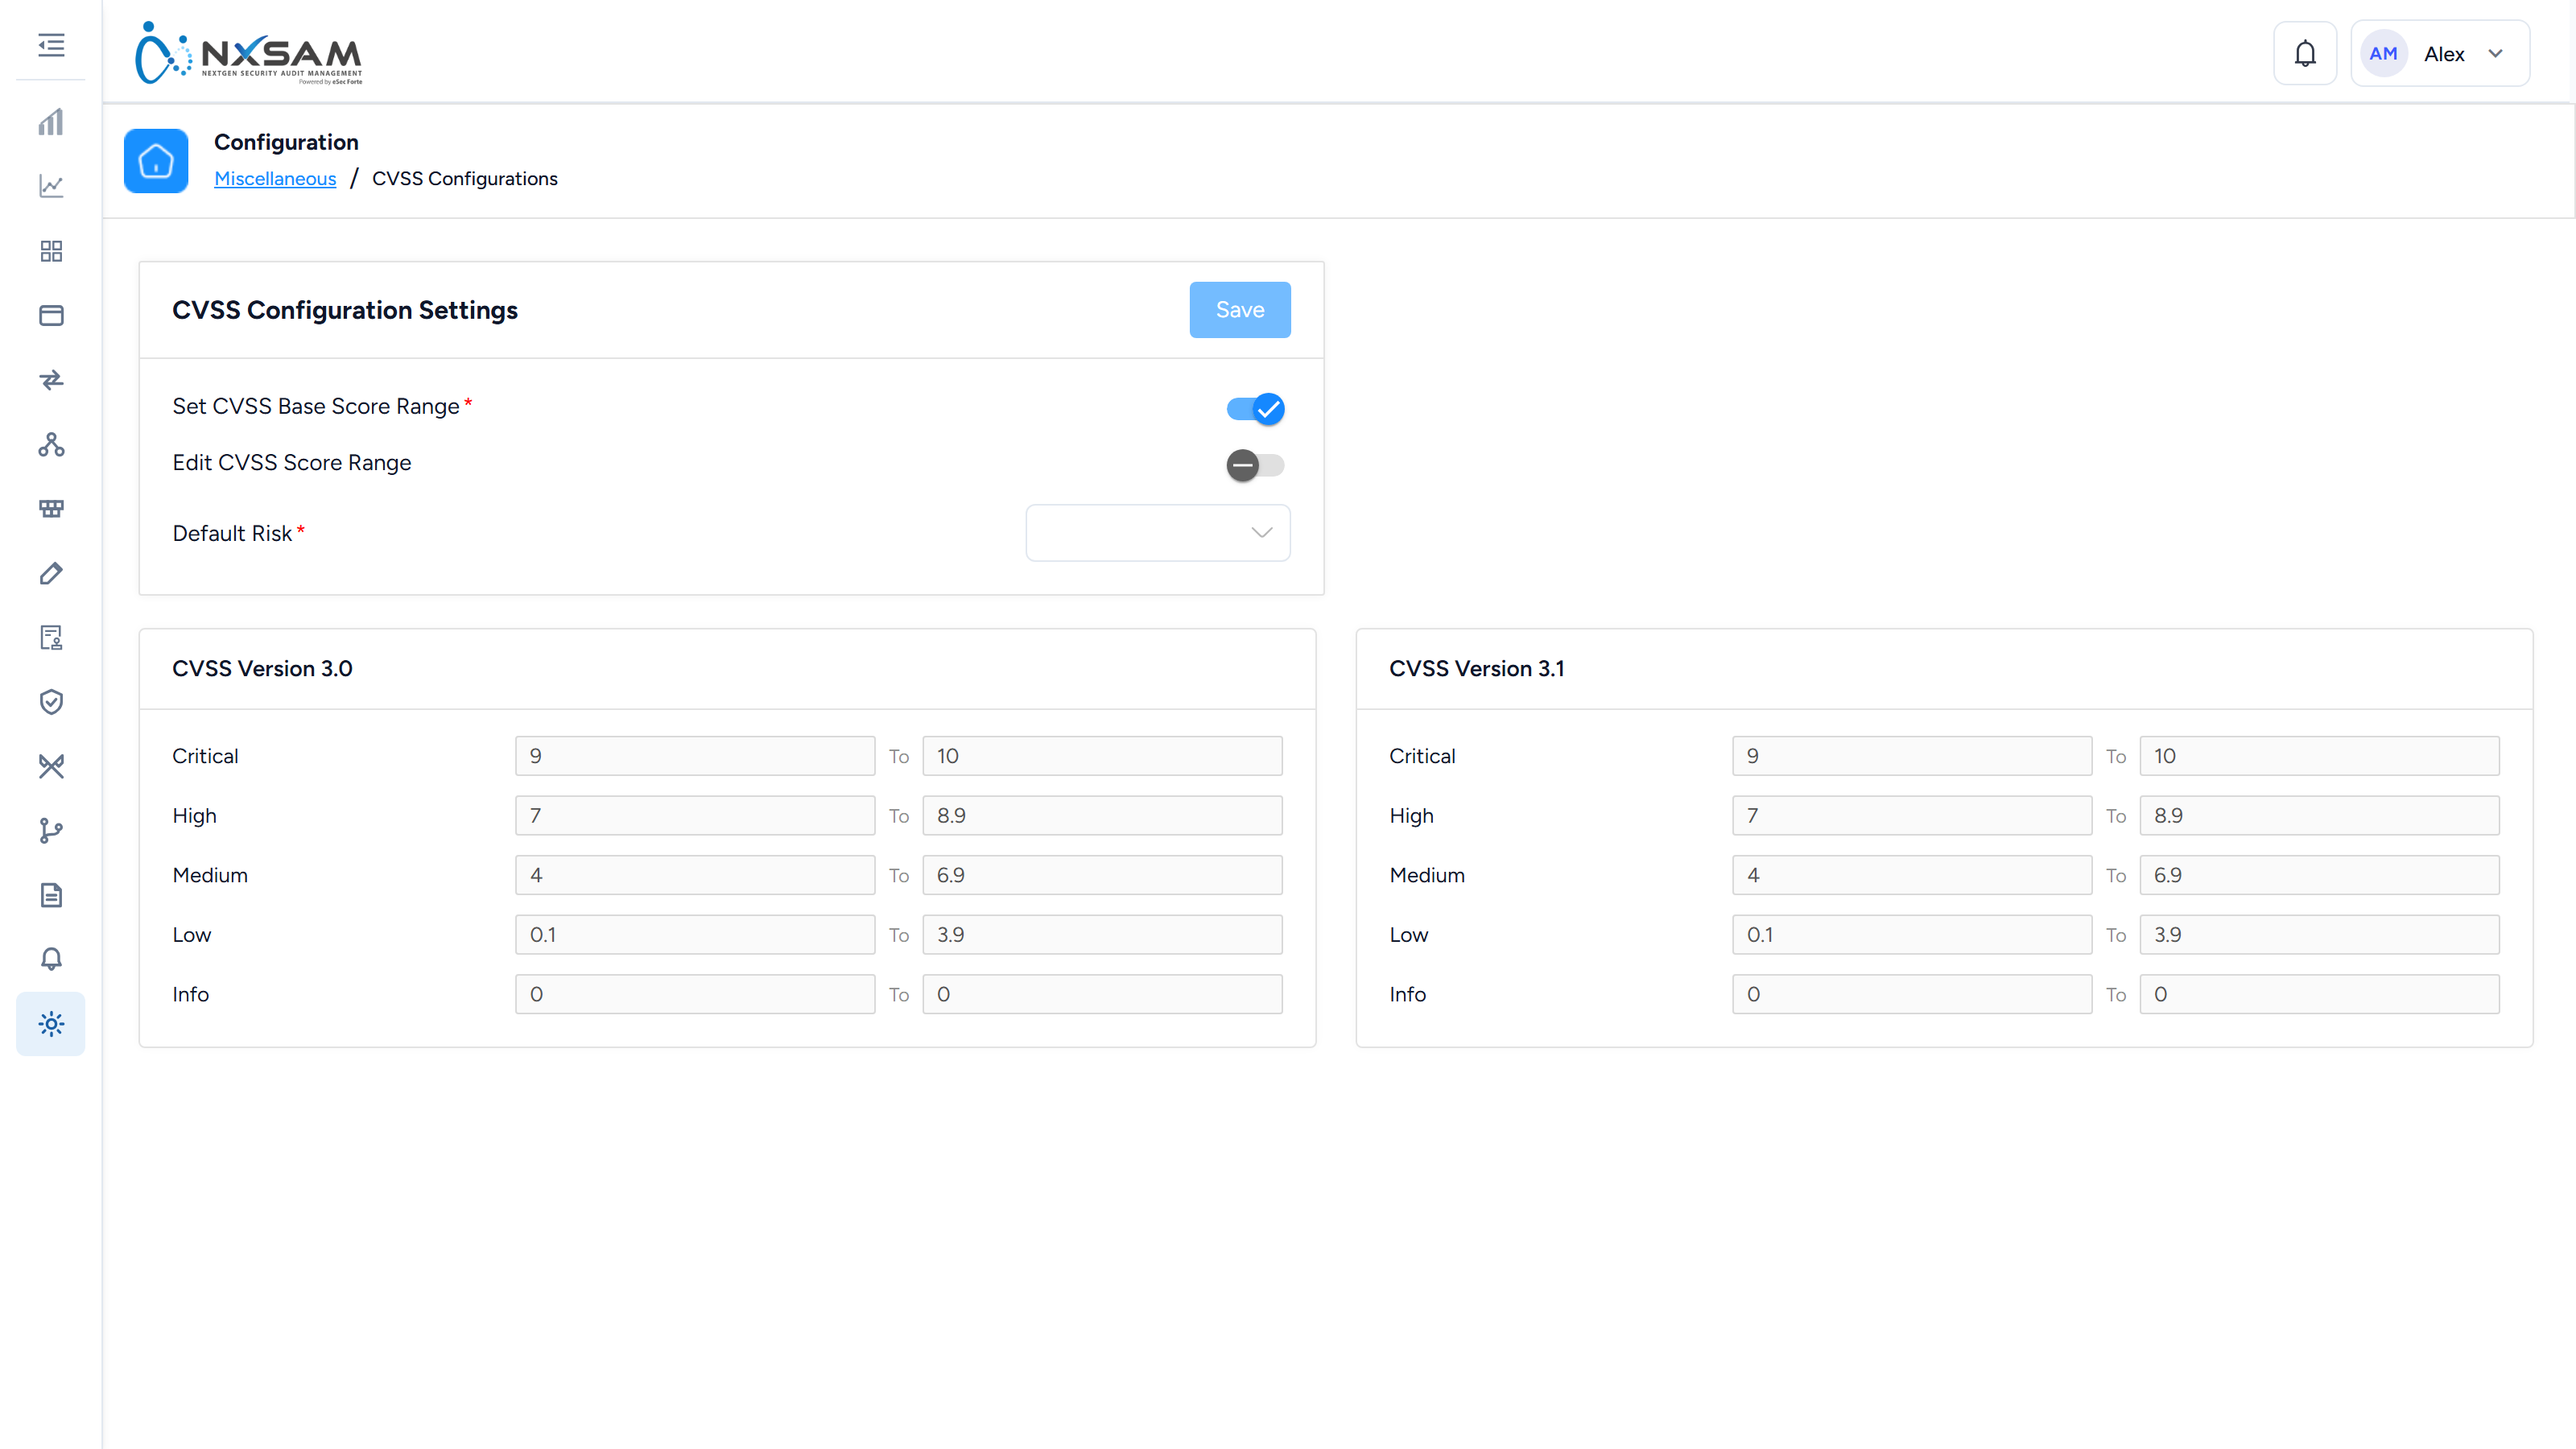
Vulnerability master and tool mapping
Two related things, easily confused:
- Vulnerability master is the catalogue of known vulnerabilities NxSAM holds for a given tool — the descriptions, remediation guidance and default severities.
- Vulnerability master mapping decides how that tool's identifiers line up with the catalogue, so the same weakness reported by two tools is recognised as one thing.
There is one of each per tool, and they are near-identical screens. Getting the mapping right is what stops the same vulnerability being counted twice under two names.
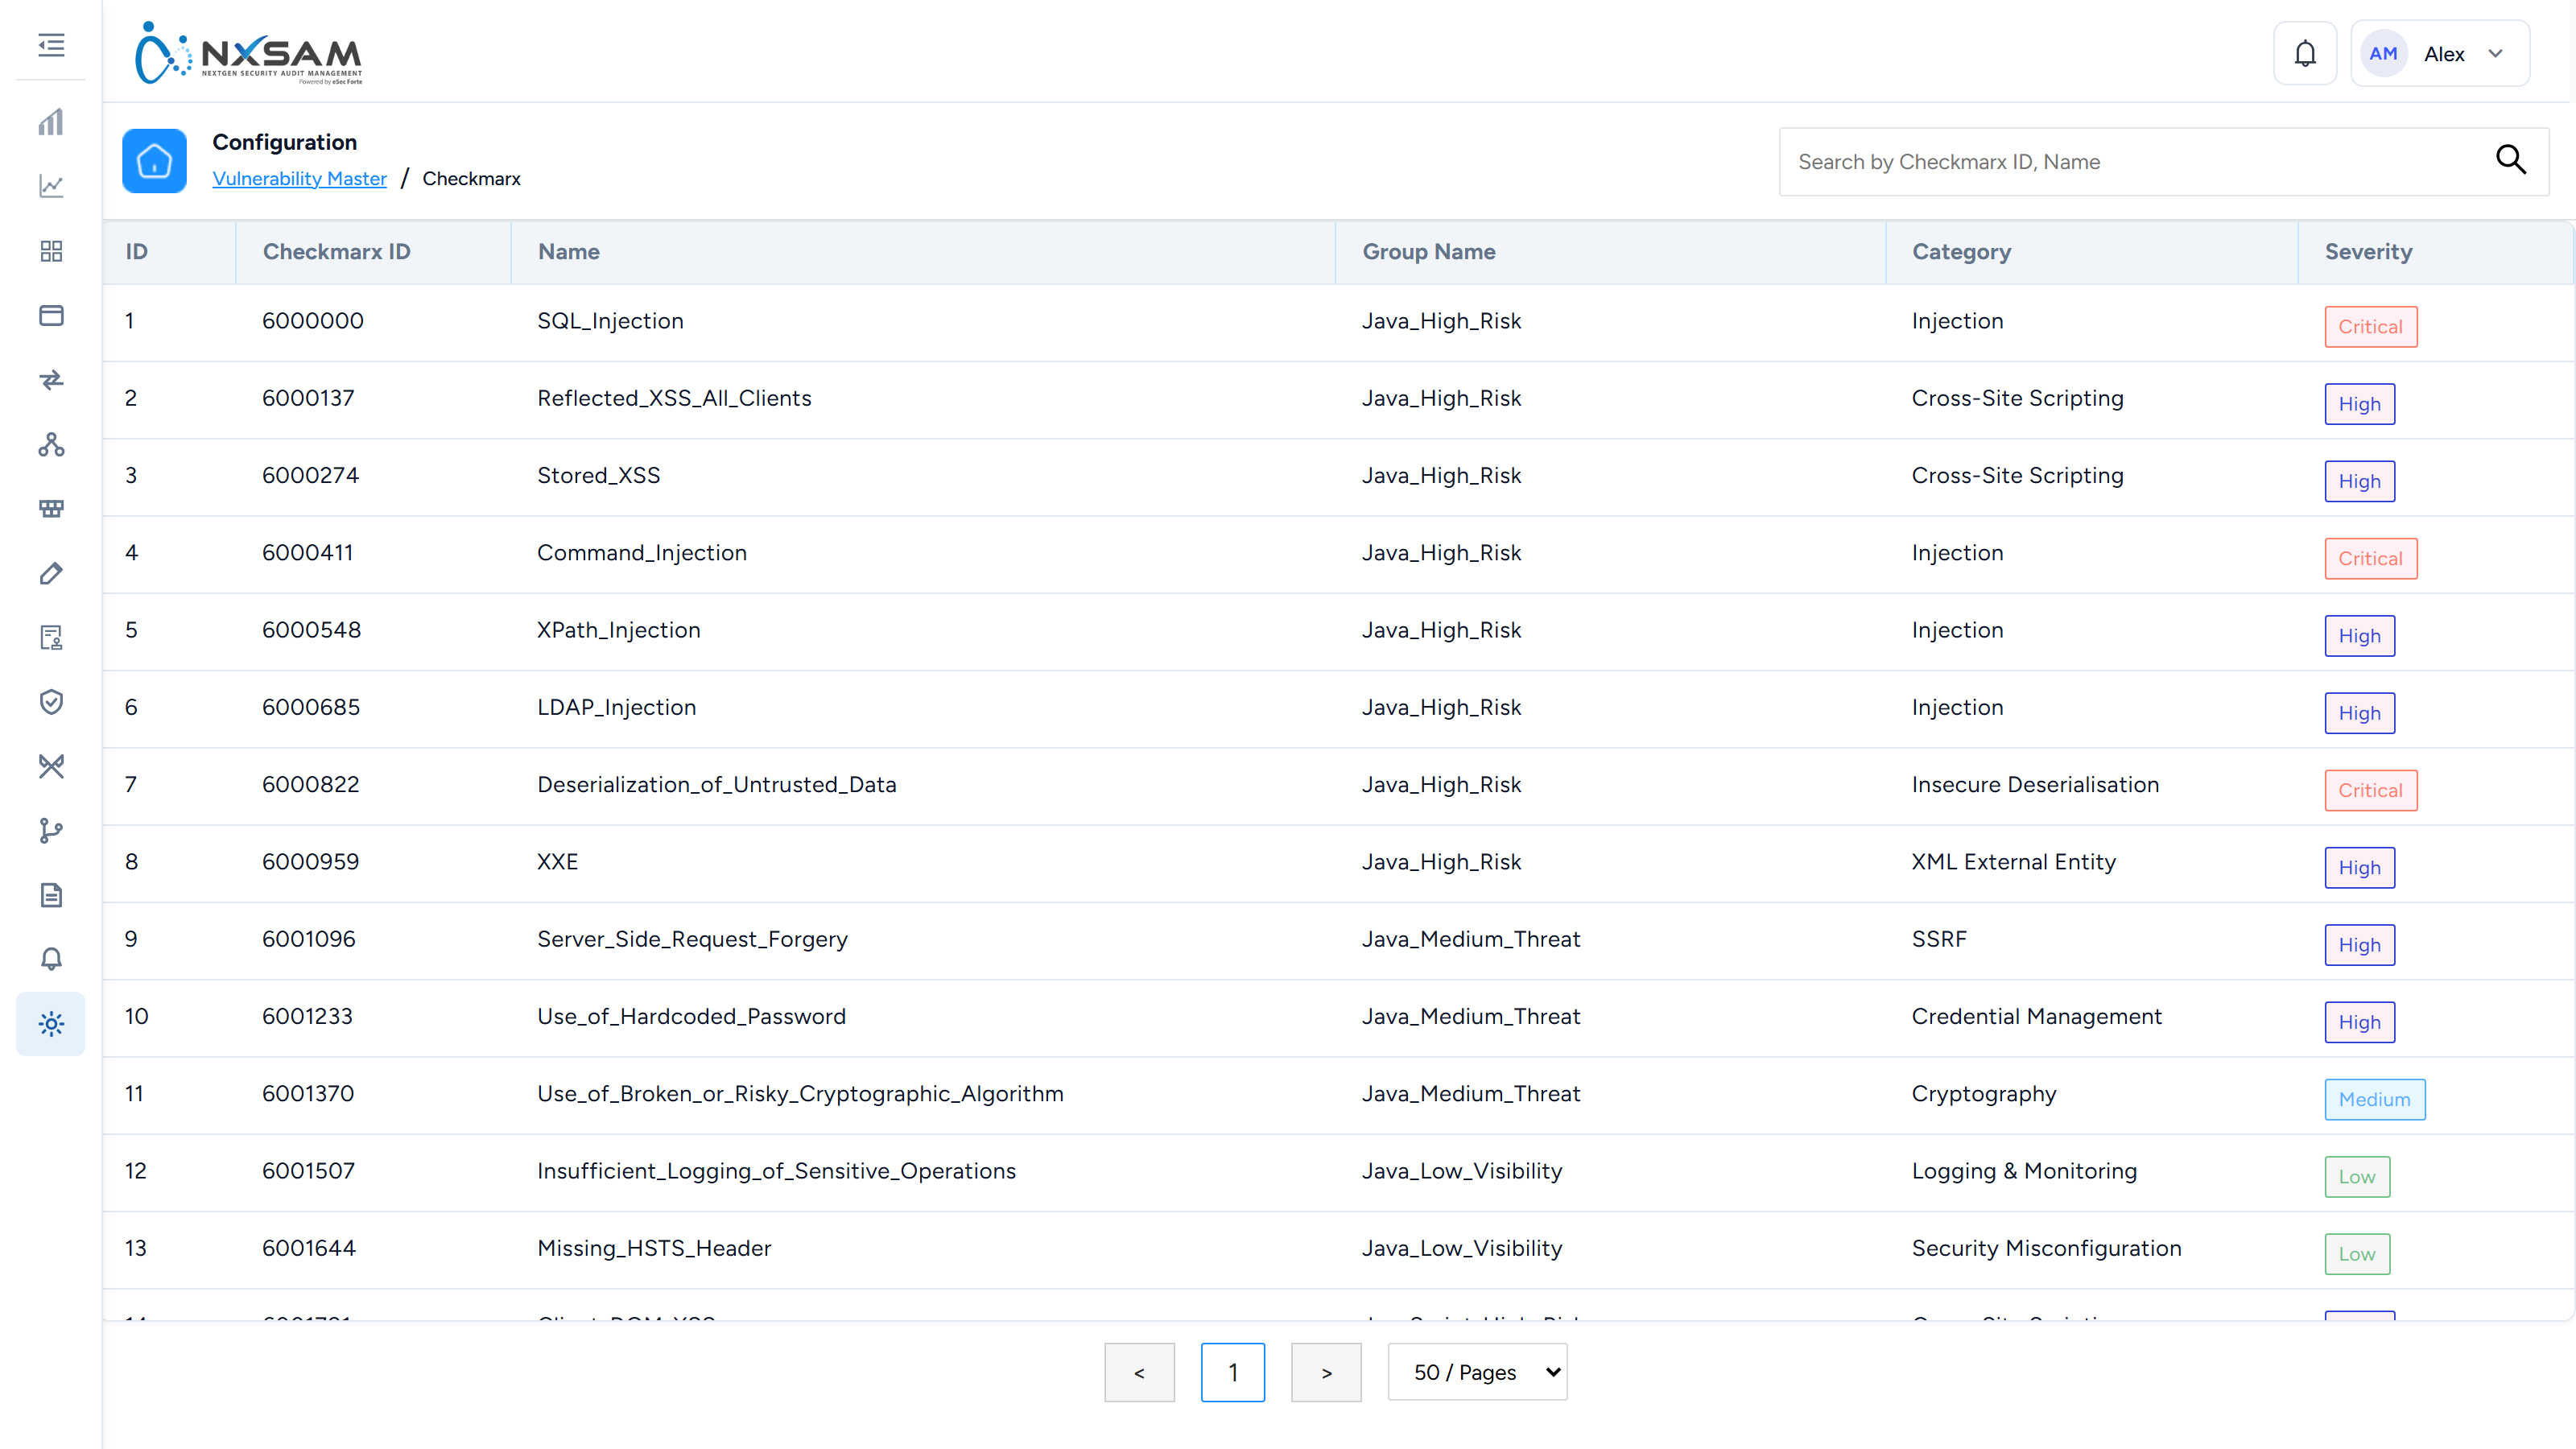
Risk scoring rules
Risk score combines severity with context — asset criticality, exposure, exploitability — into a single number used for ranking. Every weight in that combination is configurable, including which likelihood signals participate at all.
Ranking is only as good as the context feeding it. If asset criticality is unset across the estate, risk score degrades to severity with extra steps, and the "top risky assets" list stops being informative.
The rules live at Setting → System → Analytics Risk Scoring, and are covered in full under System, in Tune the risk scoring rules — the two axes, remediation health, the thresholds the charts draw from, and which scanners are scored under which rule set.
Network VA groups and sub-groups
Group network assets for assessment and reporting — usually by location, environment or network segment. A finding inherits the grouping of its host, so this is what makes "which site is worst" answerable.
Test cases, categories and plans
For manual assessment work. A test plan is a set of test cases, organised into categories, that a tester works through during an audit.
This is what makes manual testing repeatable and reviewable: two testers running the same plan cover the same ground, and an auditor can see what was checked rather than taking it on trust. Without it, a manual audit's scope exists only in the tester's head.
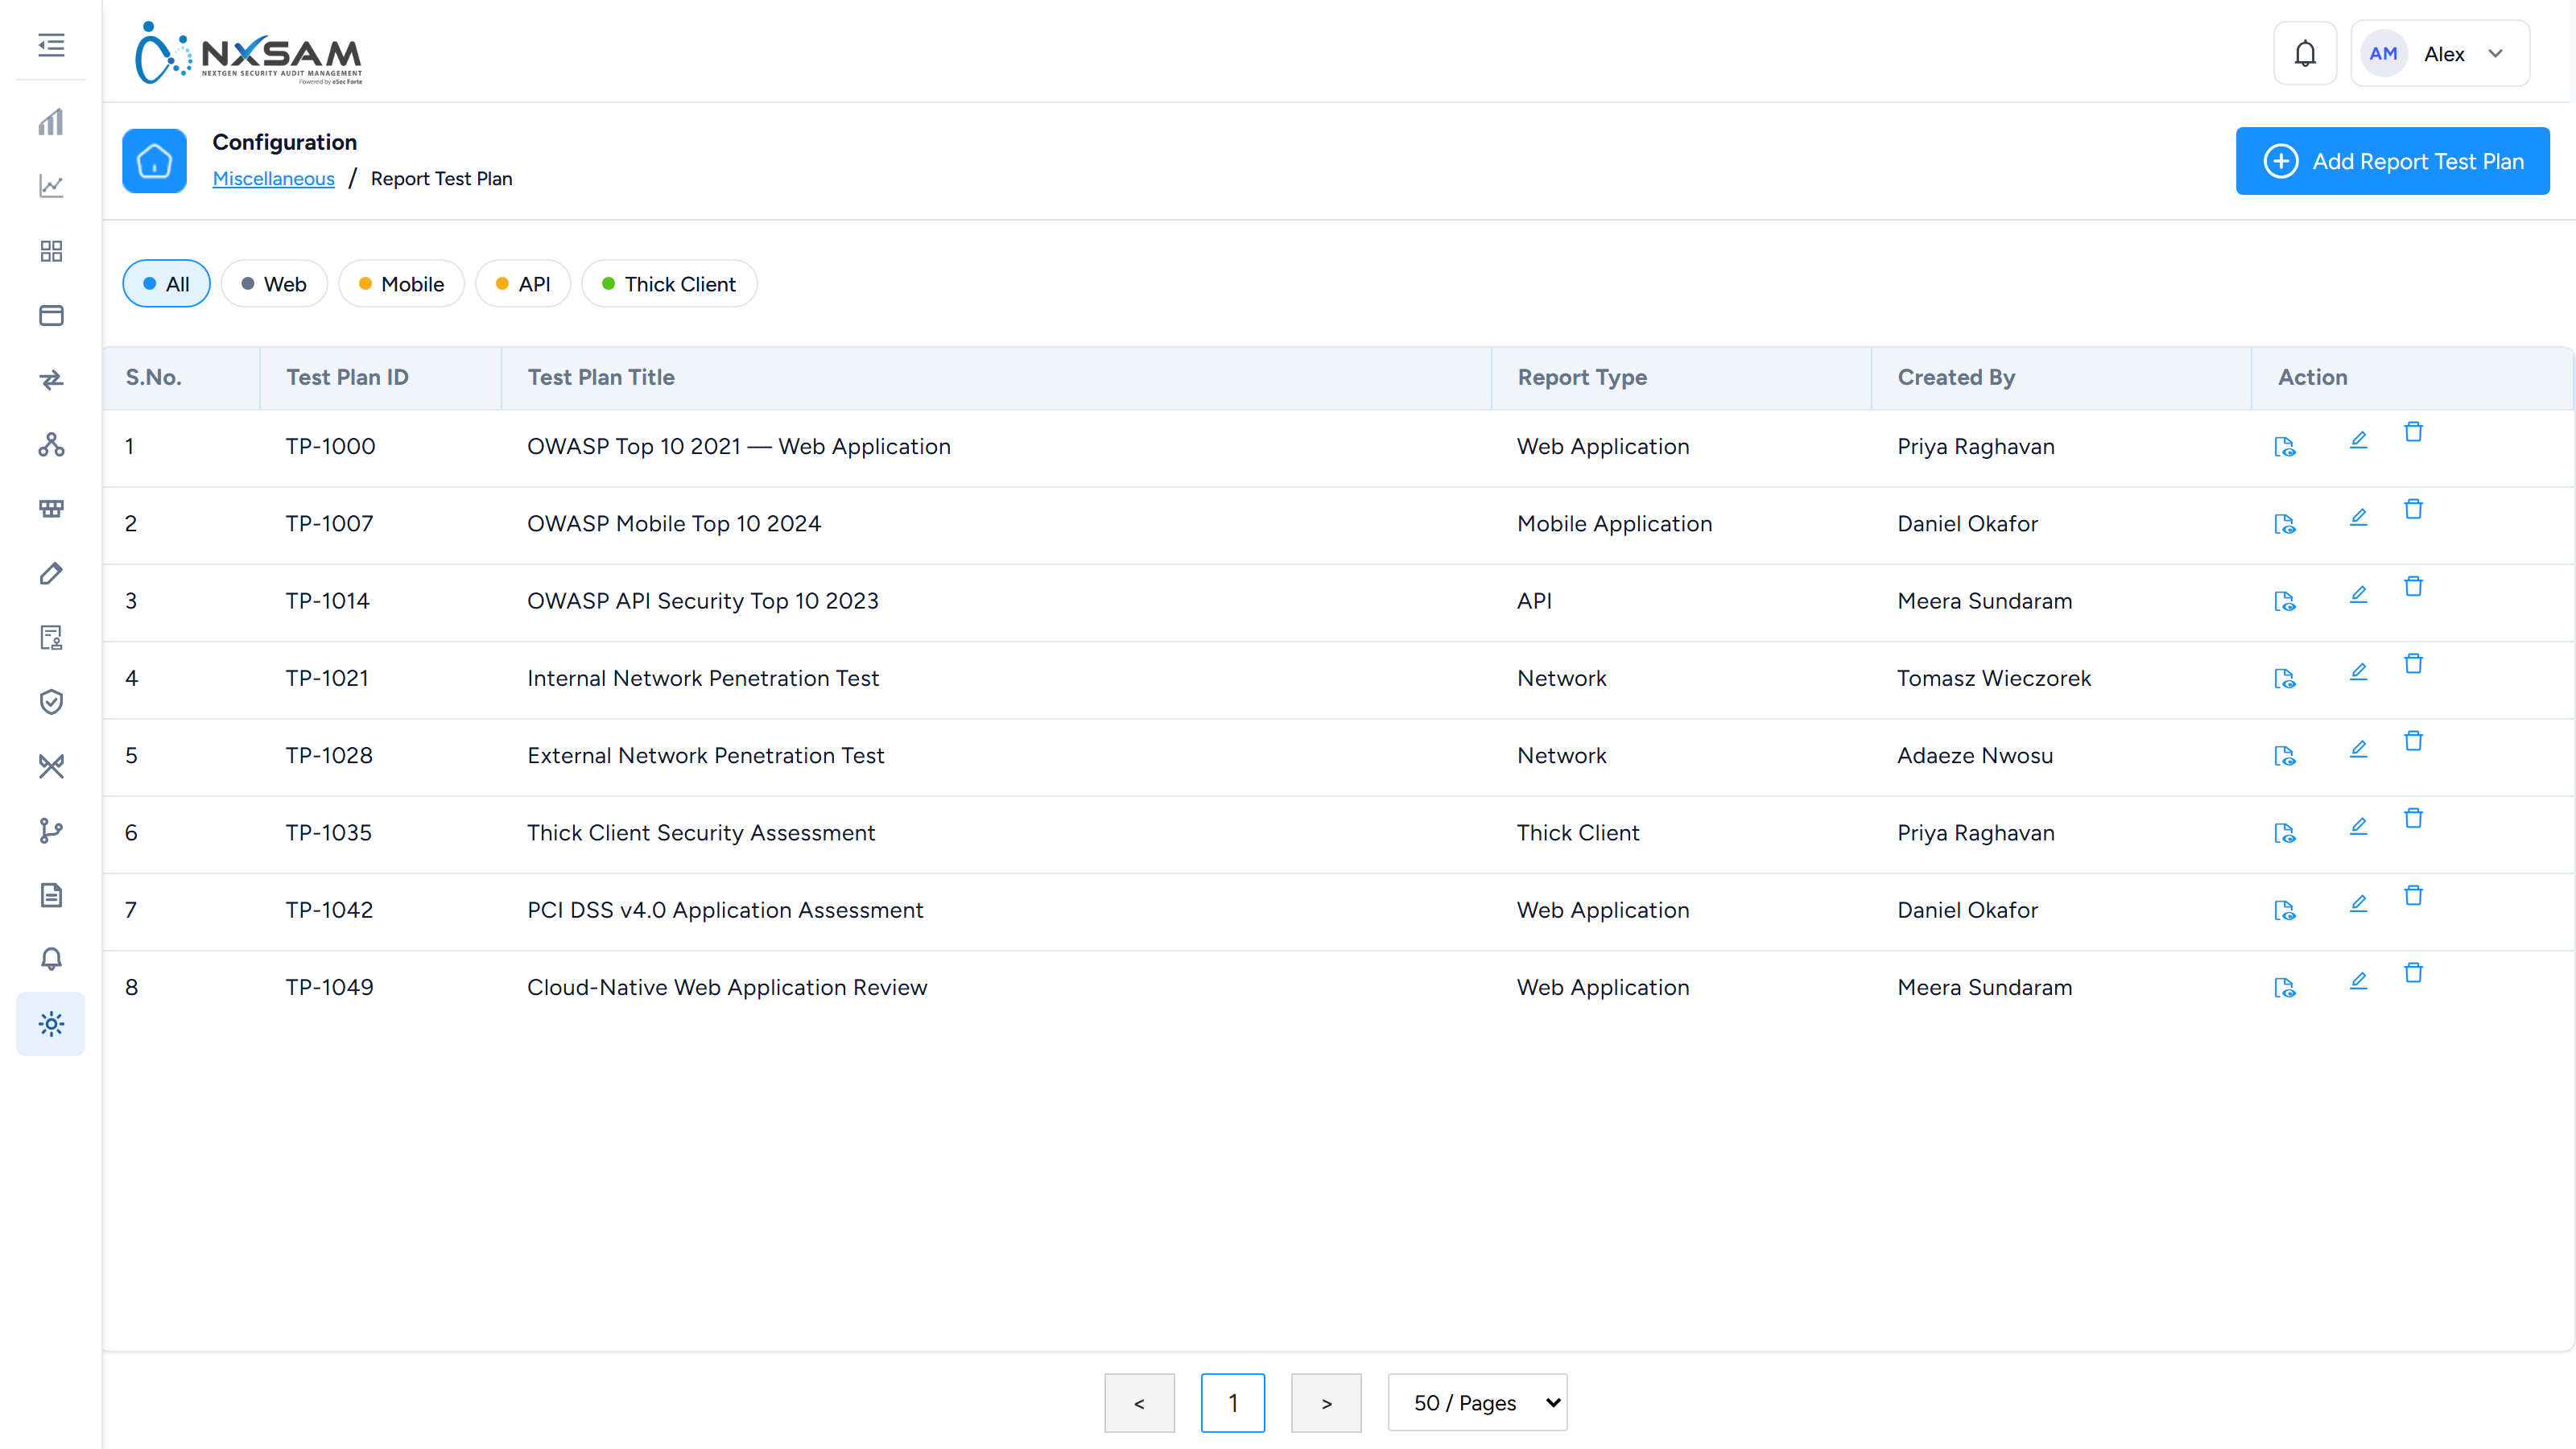
Audit status master
The set of states an audit can be in, and which transitions are permitted. Changing this affects every module that runs audits, and existing audits sitting in a state you remove have to go somewhere — so treat it as a schema change rather than a preference.
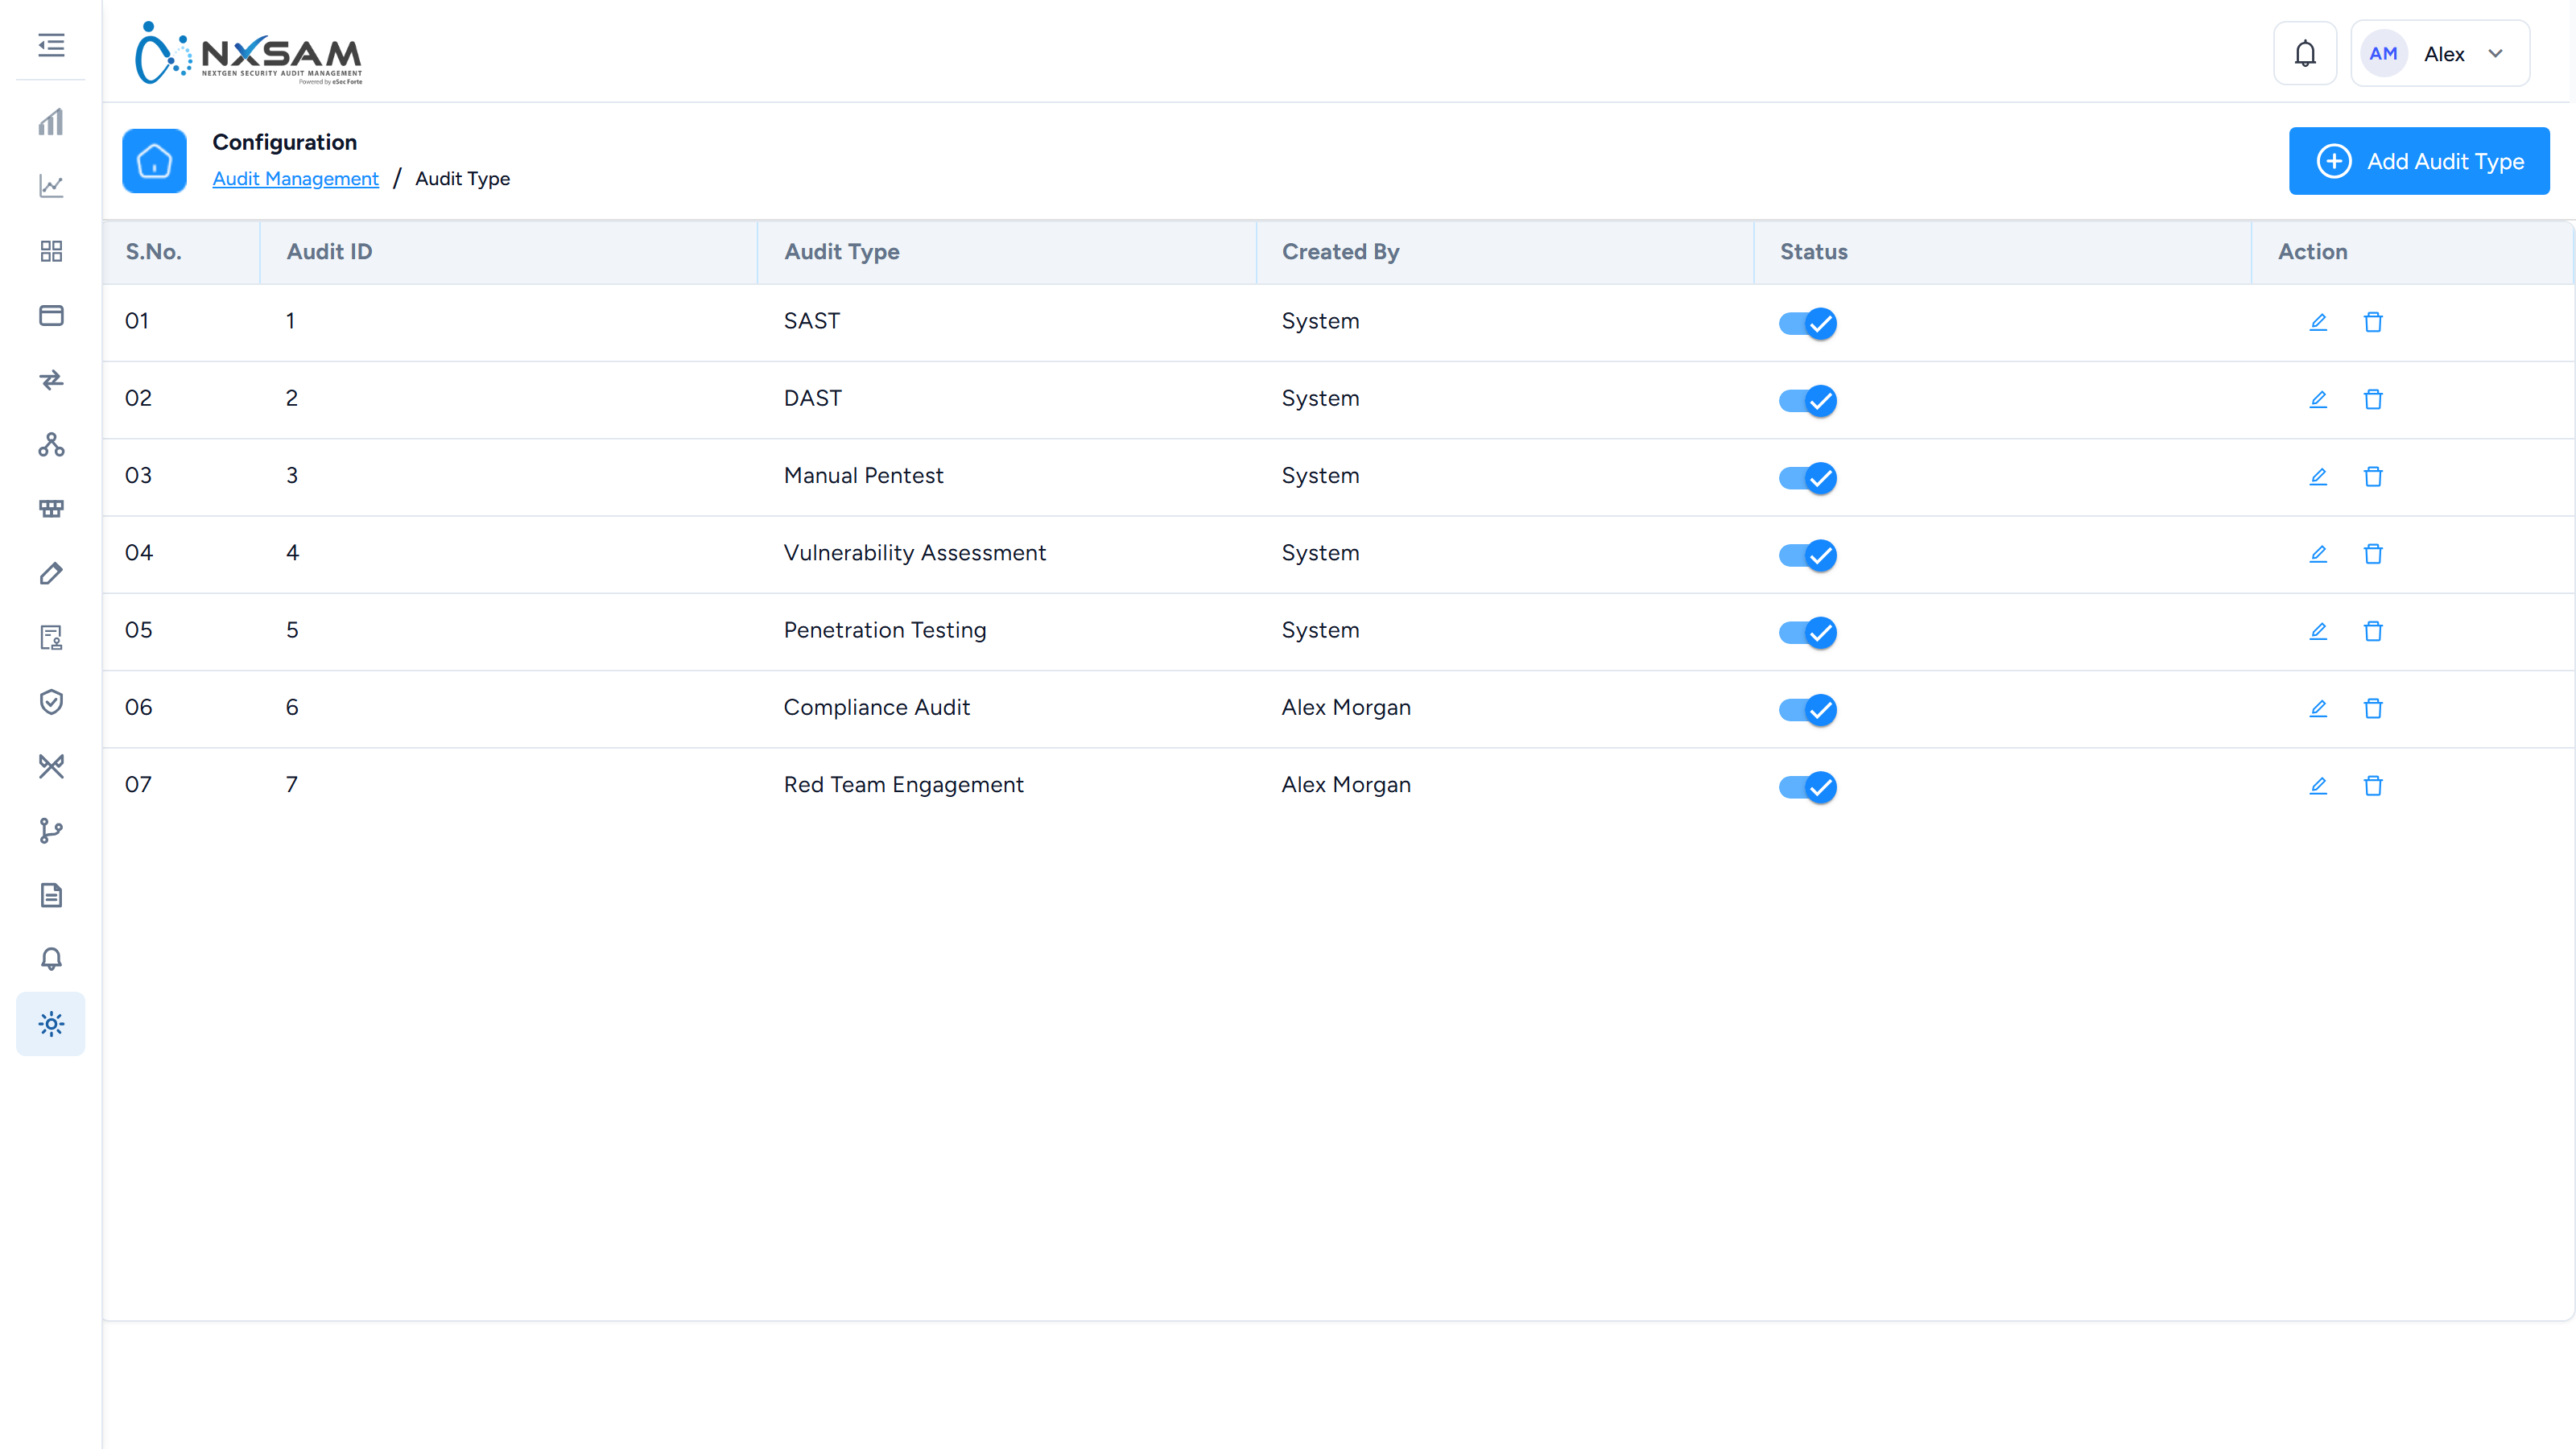
Advisories
Security advisories published to users inside the platform. Useful for a coordinated response: when a widely-exploited vulnerability is disclosed, an advisory tells everyone what is expected of them without depending on email.
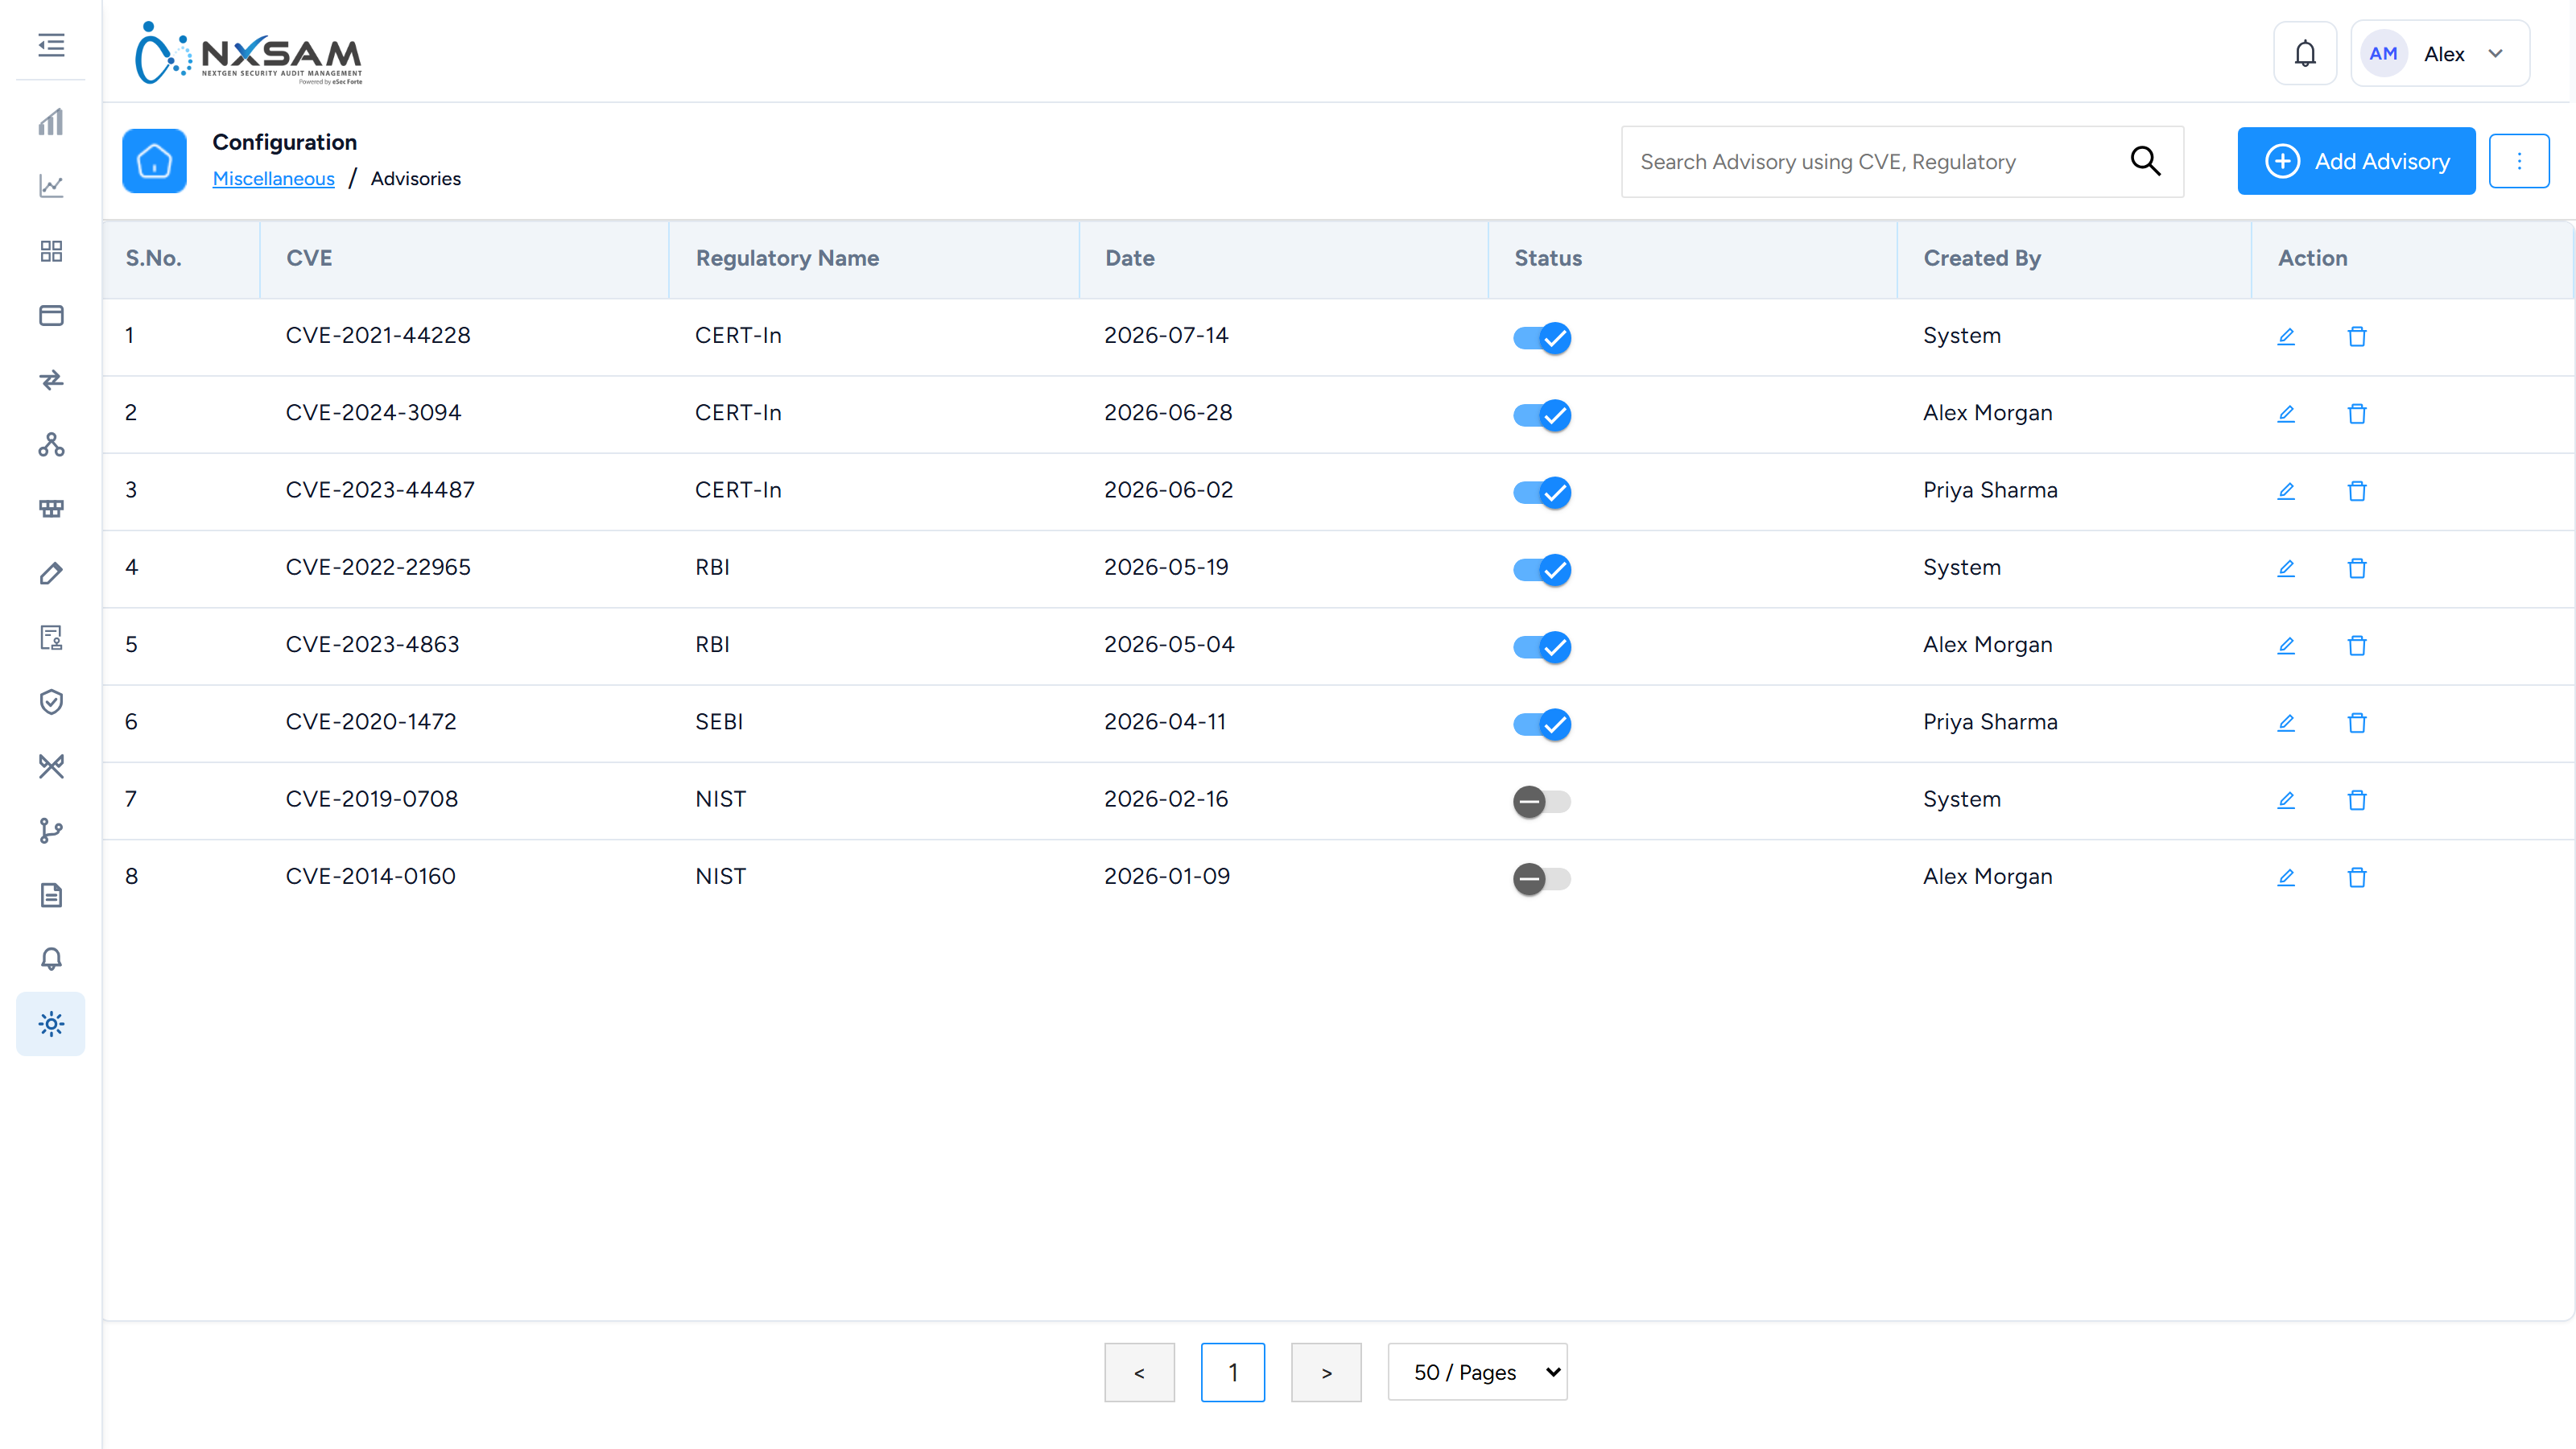
Beats configuration
Scheduled background jobs — the periodic work that keeps derived data current, such as recalculating SLA states as dates pass and refreshing pre-computed statistics.
If a screen shows figures that are stale by a fixed interval rather than randomly wrong, this is the first place to look: a beat that stopped running produces exactly that symptom, and nothing else in the product will report an error.
Administration: every screen, column and action
User access, audit configuration and the master data other modules read.
Users
| Column | What it holds |
|---|---|
| User Details | Name and contact |
| Roles | Which roles the account holds |
| Username | The sign-in name |
| User/Auditor | Whether the account performs assessments as well as using the platform |
| IP Group | Which address range they may sign in from |
| Created By | Who provisioned them |
| Last Sign-In | When they were last active |
| Status | Active, inactive or locked |
Row actions — six
| Action | What it does |
|---|---|
| Edit User | Account details and roles |
| Edit User Level | The seniority tier used in approval chains |
| Edit Asset Ownership | Which assets this person owns |
| Export Application | The applications they can see |
| Unlock User | Clears a lockout |
| Delete User | Removes the account |
Edit Asset Ownership from here, not from each asset
When someone joins or leaves, their ownership has to move. Doing it asset by asset is the slow path and the one that leaves orphans; this action reassigns everything they own in one place.
Ownership is also visibility — an owner sees their assets and the findings on them — so leaving a departed user as owner means nobody is receiving those notifications.
Directory-backed accounts
When an account is created as an Active Directory user, the form requires a Directory — which of the configured directories the account authenticates against. It is mandatory because the same username can exist in more than one directory, and the pairing of the two is what identifies the person.
Choosing the wrong directory produces an account that looks correct in the list and fails at sign-in with an invalid-credentials message. Correcting it is an edit, not a re-create.
User/Auditor matters because auditors appear in assignment lists across every assessment module. An account not flagged as an auditor cannot be assigned to an audit, which is a common "why can't I select this person" question.
Last Sign-In is the column for an access review. Accounts with no sign-in for months are the ones to question first.
Page-level actions
Export Users, Download all users with assets, Upload CSV, View Bulk Update Logs.
Download all users with assets is the access-review export: every user with everything they can reach, which is what an auditor asks for and what nothing else in the product produces.
The bulk update queue reports Status, Summary, Initiated By, Initiated At and a
Download Log File — the per-row outcome of a CSV upload.
Roles, groups and levels
| Screen | Columns |
|---|---|
| Roles | Roles, Created By, and the members — User Id, User Name |
| User Groups | User Group Name, Organisation, No of Users, Created By |
| User Levels | User ID, Level 1, Level 2, Level 3, Created By |
| Super Admins | User ID, User Name, Created By |
User Levels are three independent tiers, not one ladder. They are used by approval chains to decide who can approve what, and a user can hold a different level in each — which is how an organisation models someone senior in one domain and junior in another.
Super Admins deserve a periodic review of their own. The list is short by design, and anything on it has unrestricted access.
IP restriction
| Screen | Columns |
|---|---|
| IP Groups | IP Group #, IP Group Name, Additional Info, Created By |
| Assigned IPs | IP Address ID, IP Address, Remarks, Created By |
Actions: Assign IP, View Assigned IPs.
Sign-in can be restricted to an address range per user. Remarks is where the justification goes — "site VPN egress", "vendor jump host" — and an entry without one is impossible to review later, because an IP address alone tells you nothing about why it was permitted.
Audit configuration
| Screen | Columns |
|---|---|
| Audit Types | Audit ID, Audit Type, Created By, Status |
| Audit Properties | Property Name, Property Type, Created By |
| Property management | Asset Type, Audit Type, Properties |
| Manage properties (dialog) | Property Name, Property Type, Sequence, Mandatory |
Properties are mapped per asset type and audit type together, so a property meaningful for a web DAST audit need not appear on a network VA. Mandatory blocks audit creation until filled — the usual reason an audit that used to save now will not.
Master status tables
The RLCM masters are administered here rather than in the module:
| Screen | Columns |
|---|---|
| Audit status | Audit Status, Colour, Audit Status Order, Comment Required, Auditor Required, Closed Type |
| Risk status | Audit Finding, Colour, Audit Status Order, Comment Required, Evidence Required, Closed Type, Is Exception |
| Priority status | Priority Levels, Colour, Priority Order |
Four flags decide behaviour, and all four are enforced at save time rather than announced in advance:
- Comment Required — will not save without one
- Auditor Required — needs an auditor assigned before the status can be set
- Evidence Required — needs an attachment
- Closed Type — whether the status stops something counting as open
Is Exception marks a status representing an agreed exception rather than a resolution. It is what separates "we fixed it" from "we agreed not to", and reporting that conflates the two overstates remediation.
Advisories
CVE, Regulatory Name, Date, Status, Created By.
Actions: Upload Advisories, Export Advisories, Manage Regulatory Master.
Advisories publish a coordinated response inside the platform. Regulatory Name links one to the regulator that issued it, which is what makes an advisory a compliance obligation rather than an internal notice — and the reason the regulatory master is maintained separately.
Network VA grouping
Groups — Group Name, Sub Groups. Sub-groups — Sub Groups Name, Group Name.
Two levels of grouping for network assets, usually site then environment. Findings inherit the grouping of their host, so this is what makes "which site is worst" answerable.
Test cases and plans
| Screen | Columns |
|---|---|
| Categories | Category No., Category Name, Report Type, Created By |
| Test cases | The cases within a category |
Actions: Manage Test Cases, Edit Test Case, Delete.
A test plan is a set of cases grouped into categories, worked through during a manual assessment. Report Type ties a category to the report it appears in, so what the tester records and what the customer receives stay aligned.
Without a plan, a manual audit's scope exists only in the tester's memory — which is the difference between an assessment an auditor accepts and one they do not.
Test plans carry Test Plan ID, Test Plan Title, Report Type, Created By, with
View Status History showing how a plan has changed — which matters when two
assessments run against the same plan produce different coverage.
Email templates
There are two screens here, and they do different jobs.
Scheduled email reports are the recurring security reports you build yourself. Each
definition carries Name, Data Type, Dispatch, Trigger, Status, Updated.
- Dispatch is how many emails go out — Shared is one to a fixed audience, Group By is one per owner, each carrying only that owner's findings.
- Trigger is the send cadence, not an event: Daily at 06:45, Weekly, day 4 at 08:30, Monthly, day 1 at 08:00.
- Status must be
Activeto be scheduled at all. A finished definition left onDraftis the usual explanation for a report nobody receives — followed by test mode still being on, which the list flags beside the name.
Building one is covered in full in Design a scheduled email report — data sources, body blocks, attachment, recipient resolvers, branding and the safe way to go live.
Notification templates are the platform's own transactional mail — the wording sent
when an audit completes or a password reset is requested. That list shows Scenario,
Triggered On, Triggered At, Frequency, Send and Status:
- Scenario — the situation the mail covers, such as an SLA approaching expiry
- Triggered On — the event that fires it
- Triggered At — the time of day it goes, for scheduled mail
- Frequency — how often, for anything recurring
- Send — sends a scheduled template now, off-schedule, to the recipients it would resolve to at the next scheduled send. It does not move the schedule: the next scheduled send still happens when it was due
Frequency is why a notification arrives late rather than not at all
A template with a daily frequency and a fixed time sends once a day, not when the event occurs. A user reporting that an SLA warning "came a day late" has usually met exactly this — the event happened after that day's send.
Email logs
Email Type and ID, Subject, To, CC, Added On, Triggered By, Status.
Triggered By distinguishes a mail the schedule sent from one a person sent with Send — which is the first thing to check when a recipient reports receiving a report twice on one day.
The record of what was actually sent. Status distinguishes queued from sent from
failed, and To / CC show who received it — which settles "I was never told" without
involving the mail administrator.
Added On is when the mail was queued, not when it was delivered. A large gap between Added On and an absent delivery points at the mail server rather than at NxSAM.
Administration: find the right screen
Every screen in this module, what each one is for, and where it lives. Use it to find the right screen quickly, and to confirm you are on the one a colleague means — several screens in this product have similar names and different jobs.
Screenshots come from a demonstration data set, so the figures are illustrative. Click any screenshot to open it at full resolution.
Audit Properties
Additional fields recorded against an audit.
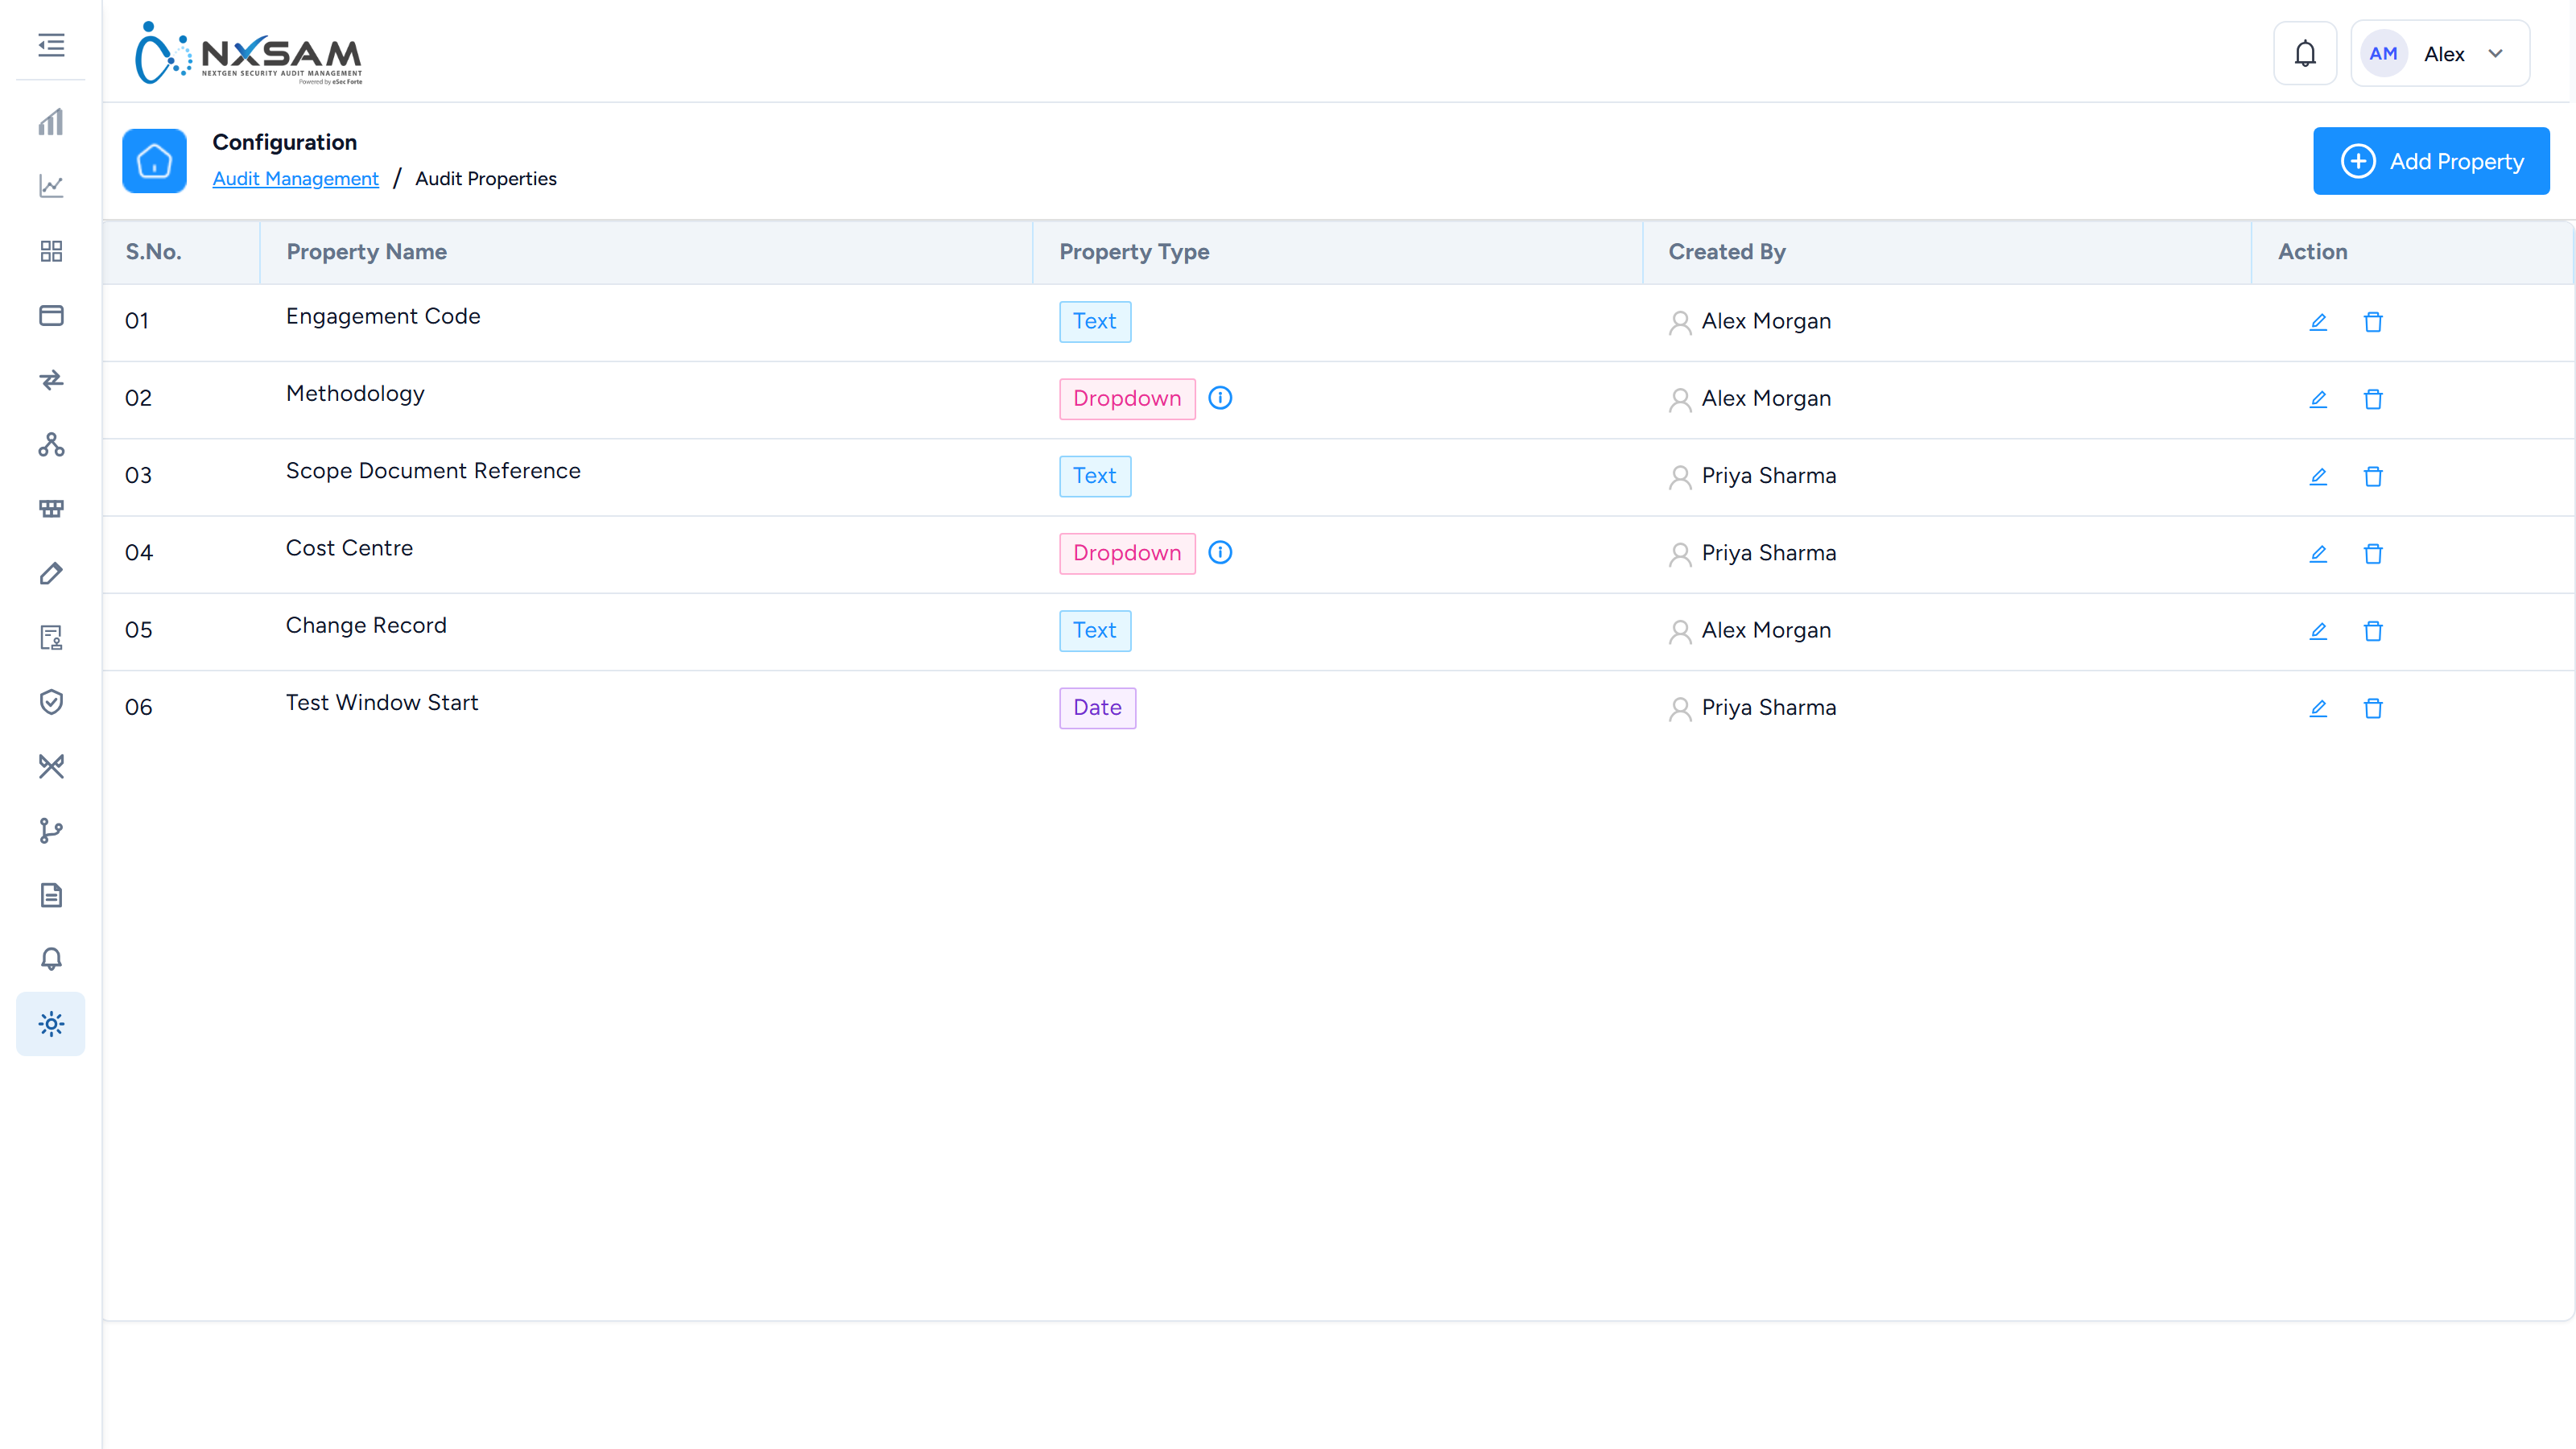
Audit Property Management
Which audit properties apply to which combination of asset type and audit type — the reason two audits can demand different fields.

Audit Status Master
The states an audit can hold, their order, and which of them demand a comment or an auditor.
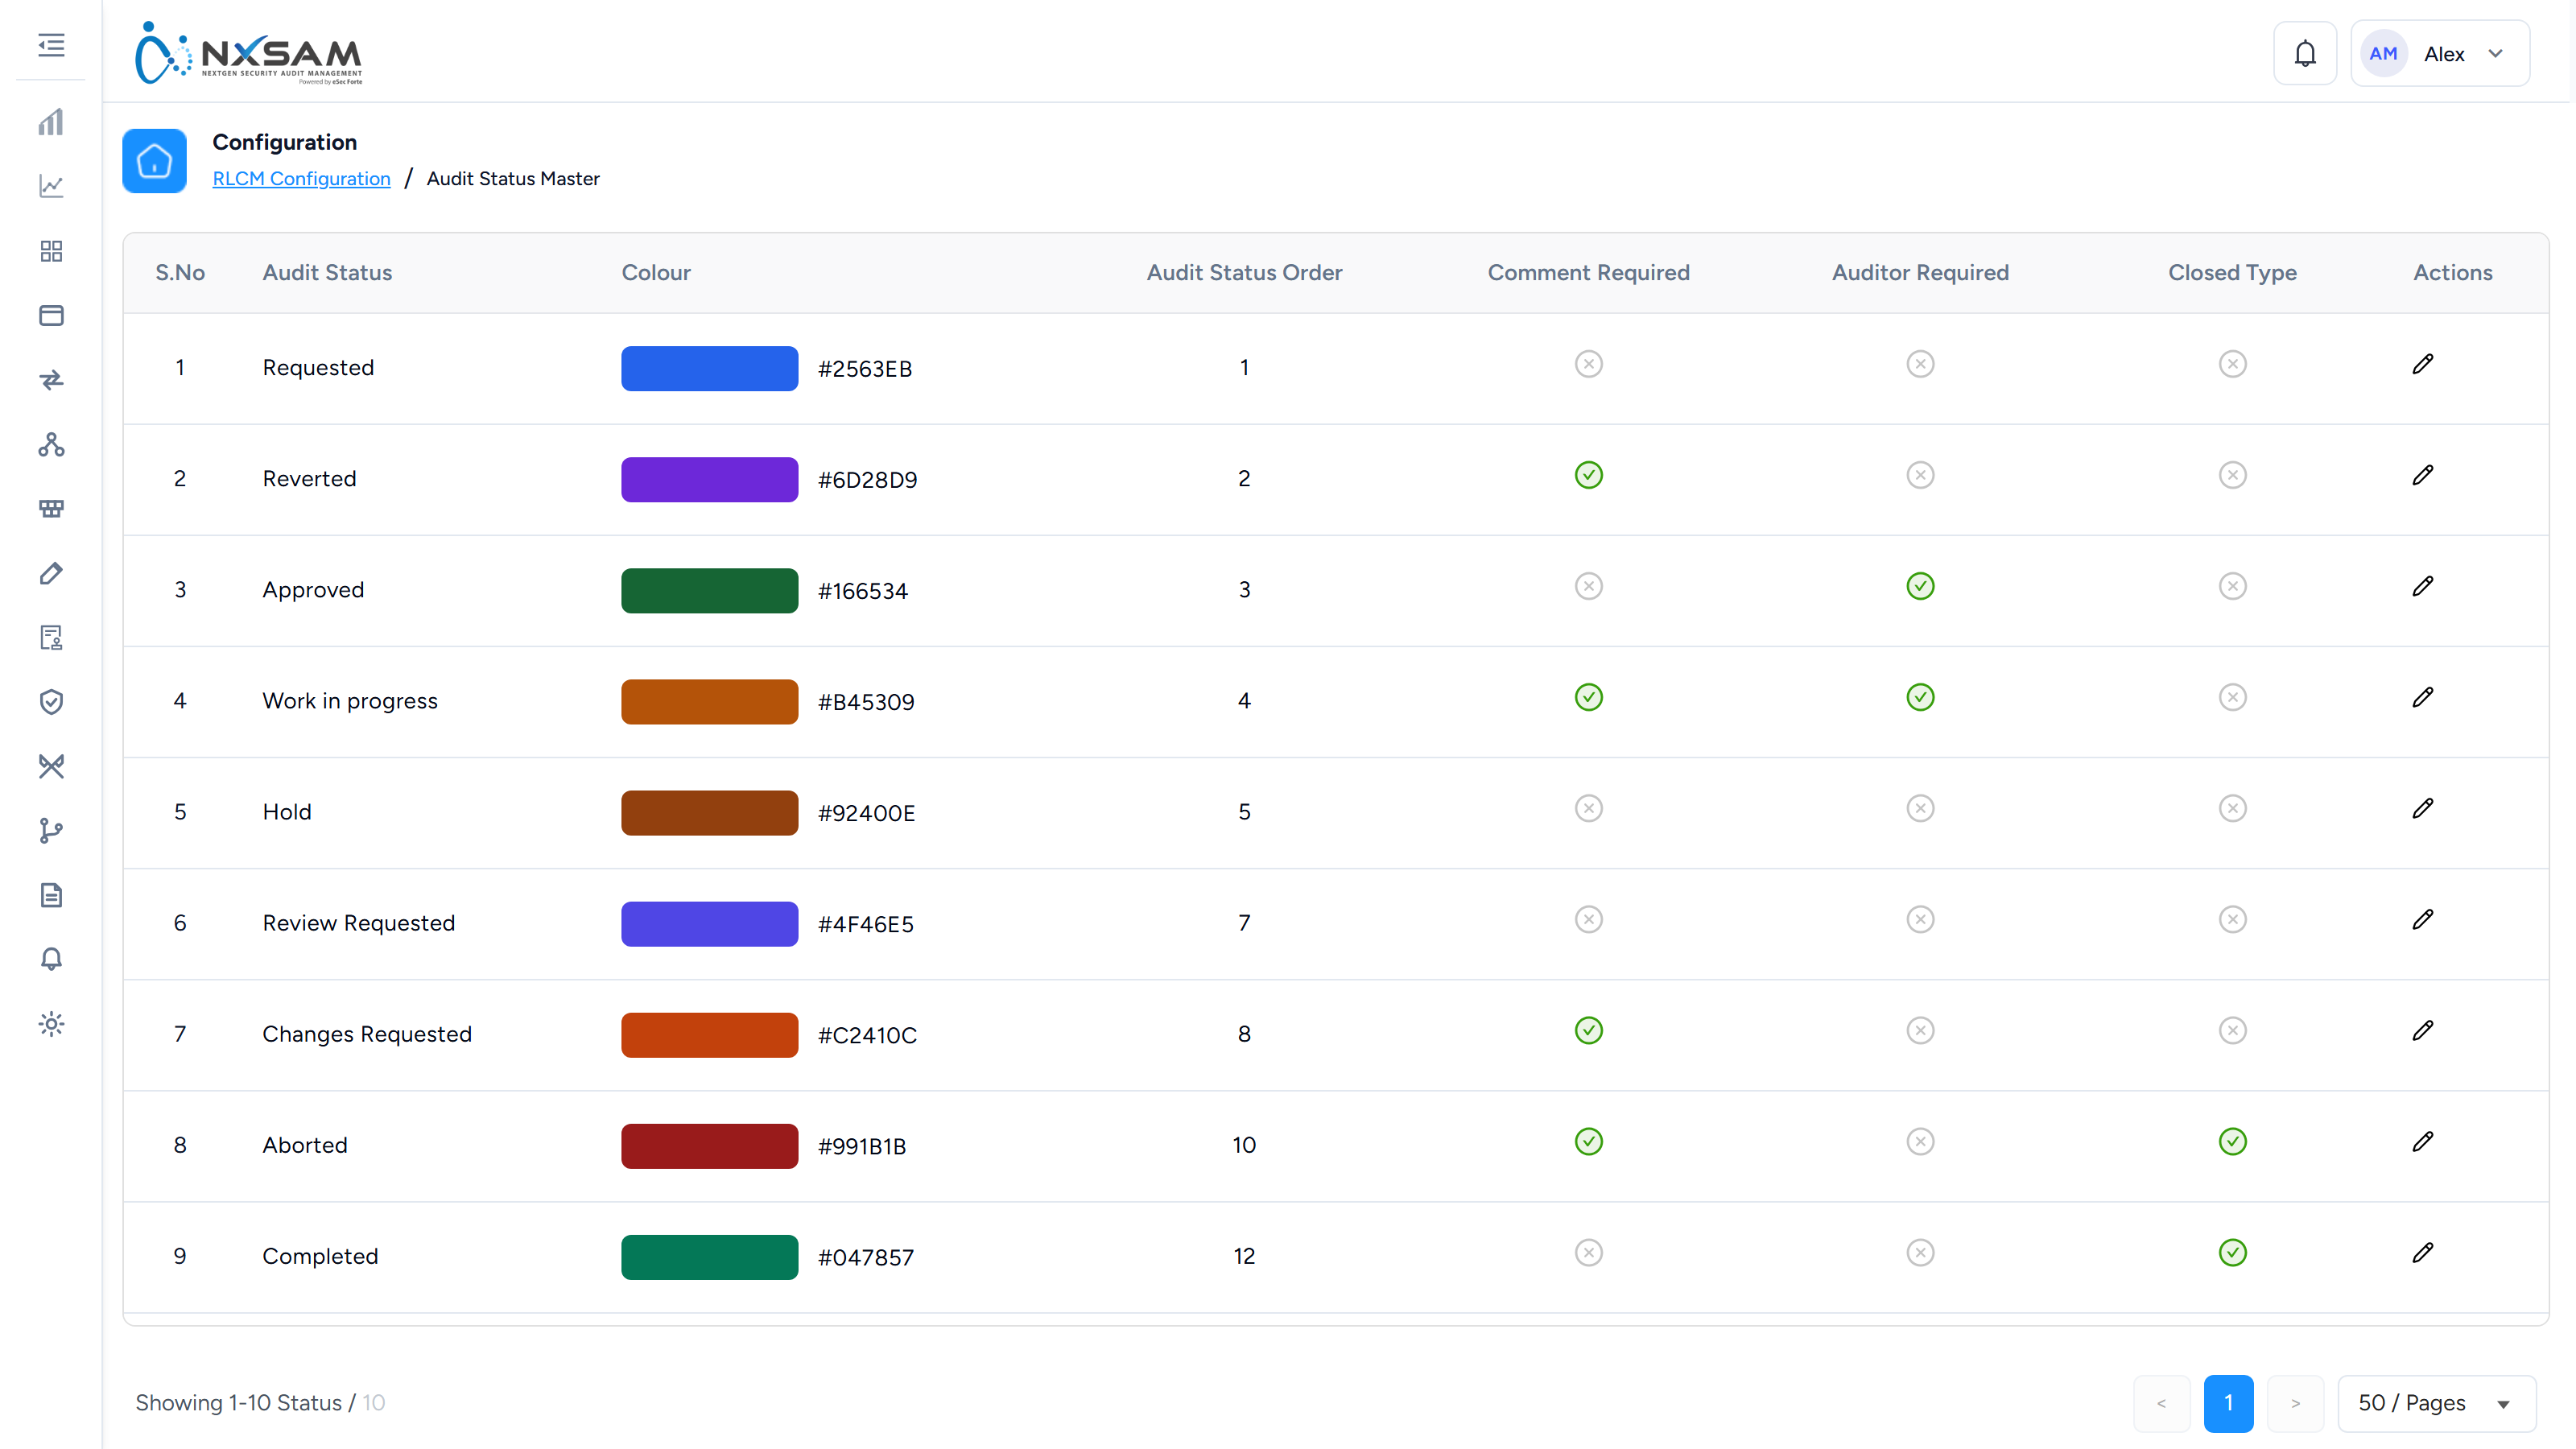
Email Log
Every message the platform tried to send and what became of it. The first place to look when someone says a notification never arrived.
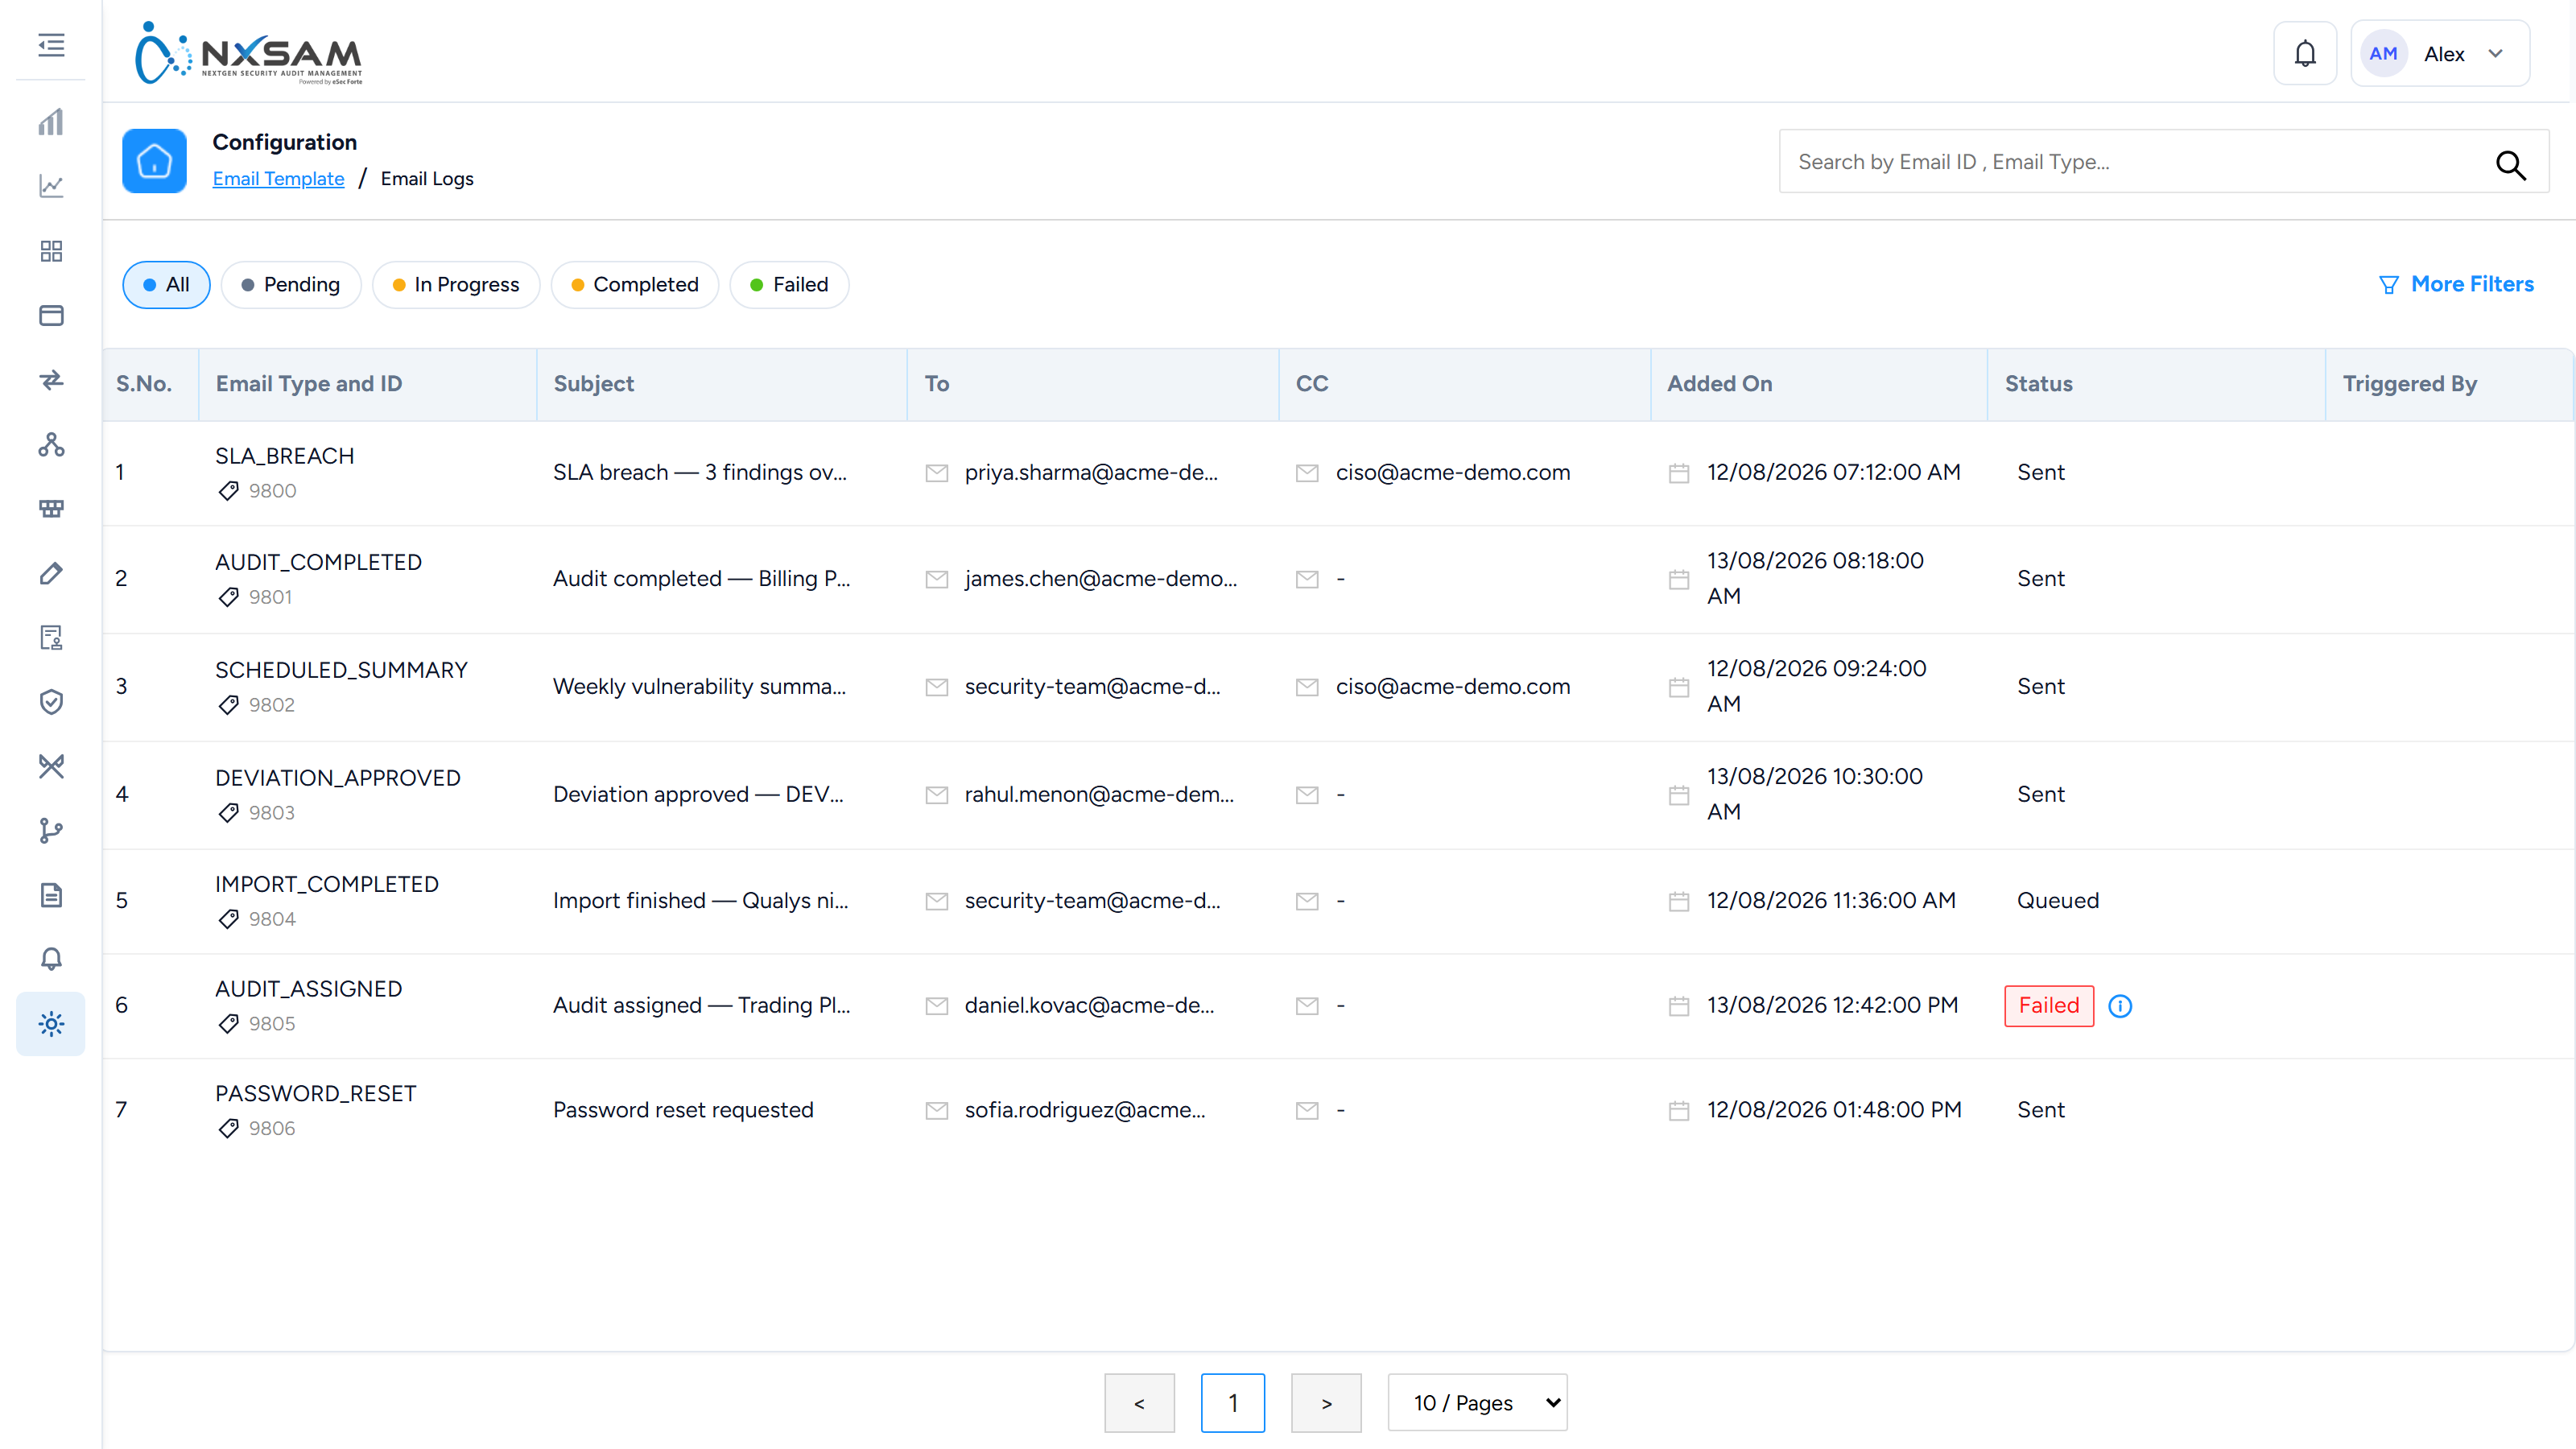
Email Templates
The wording of every notification the platform sends.
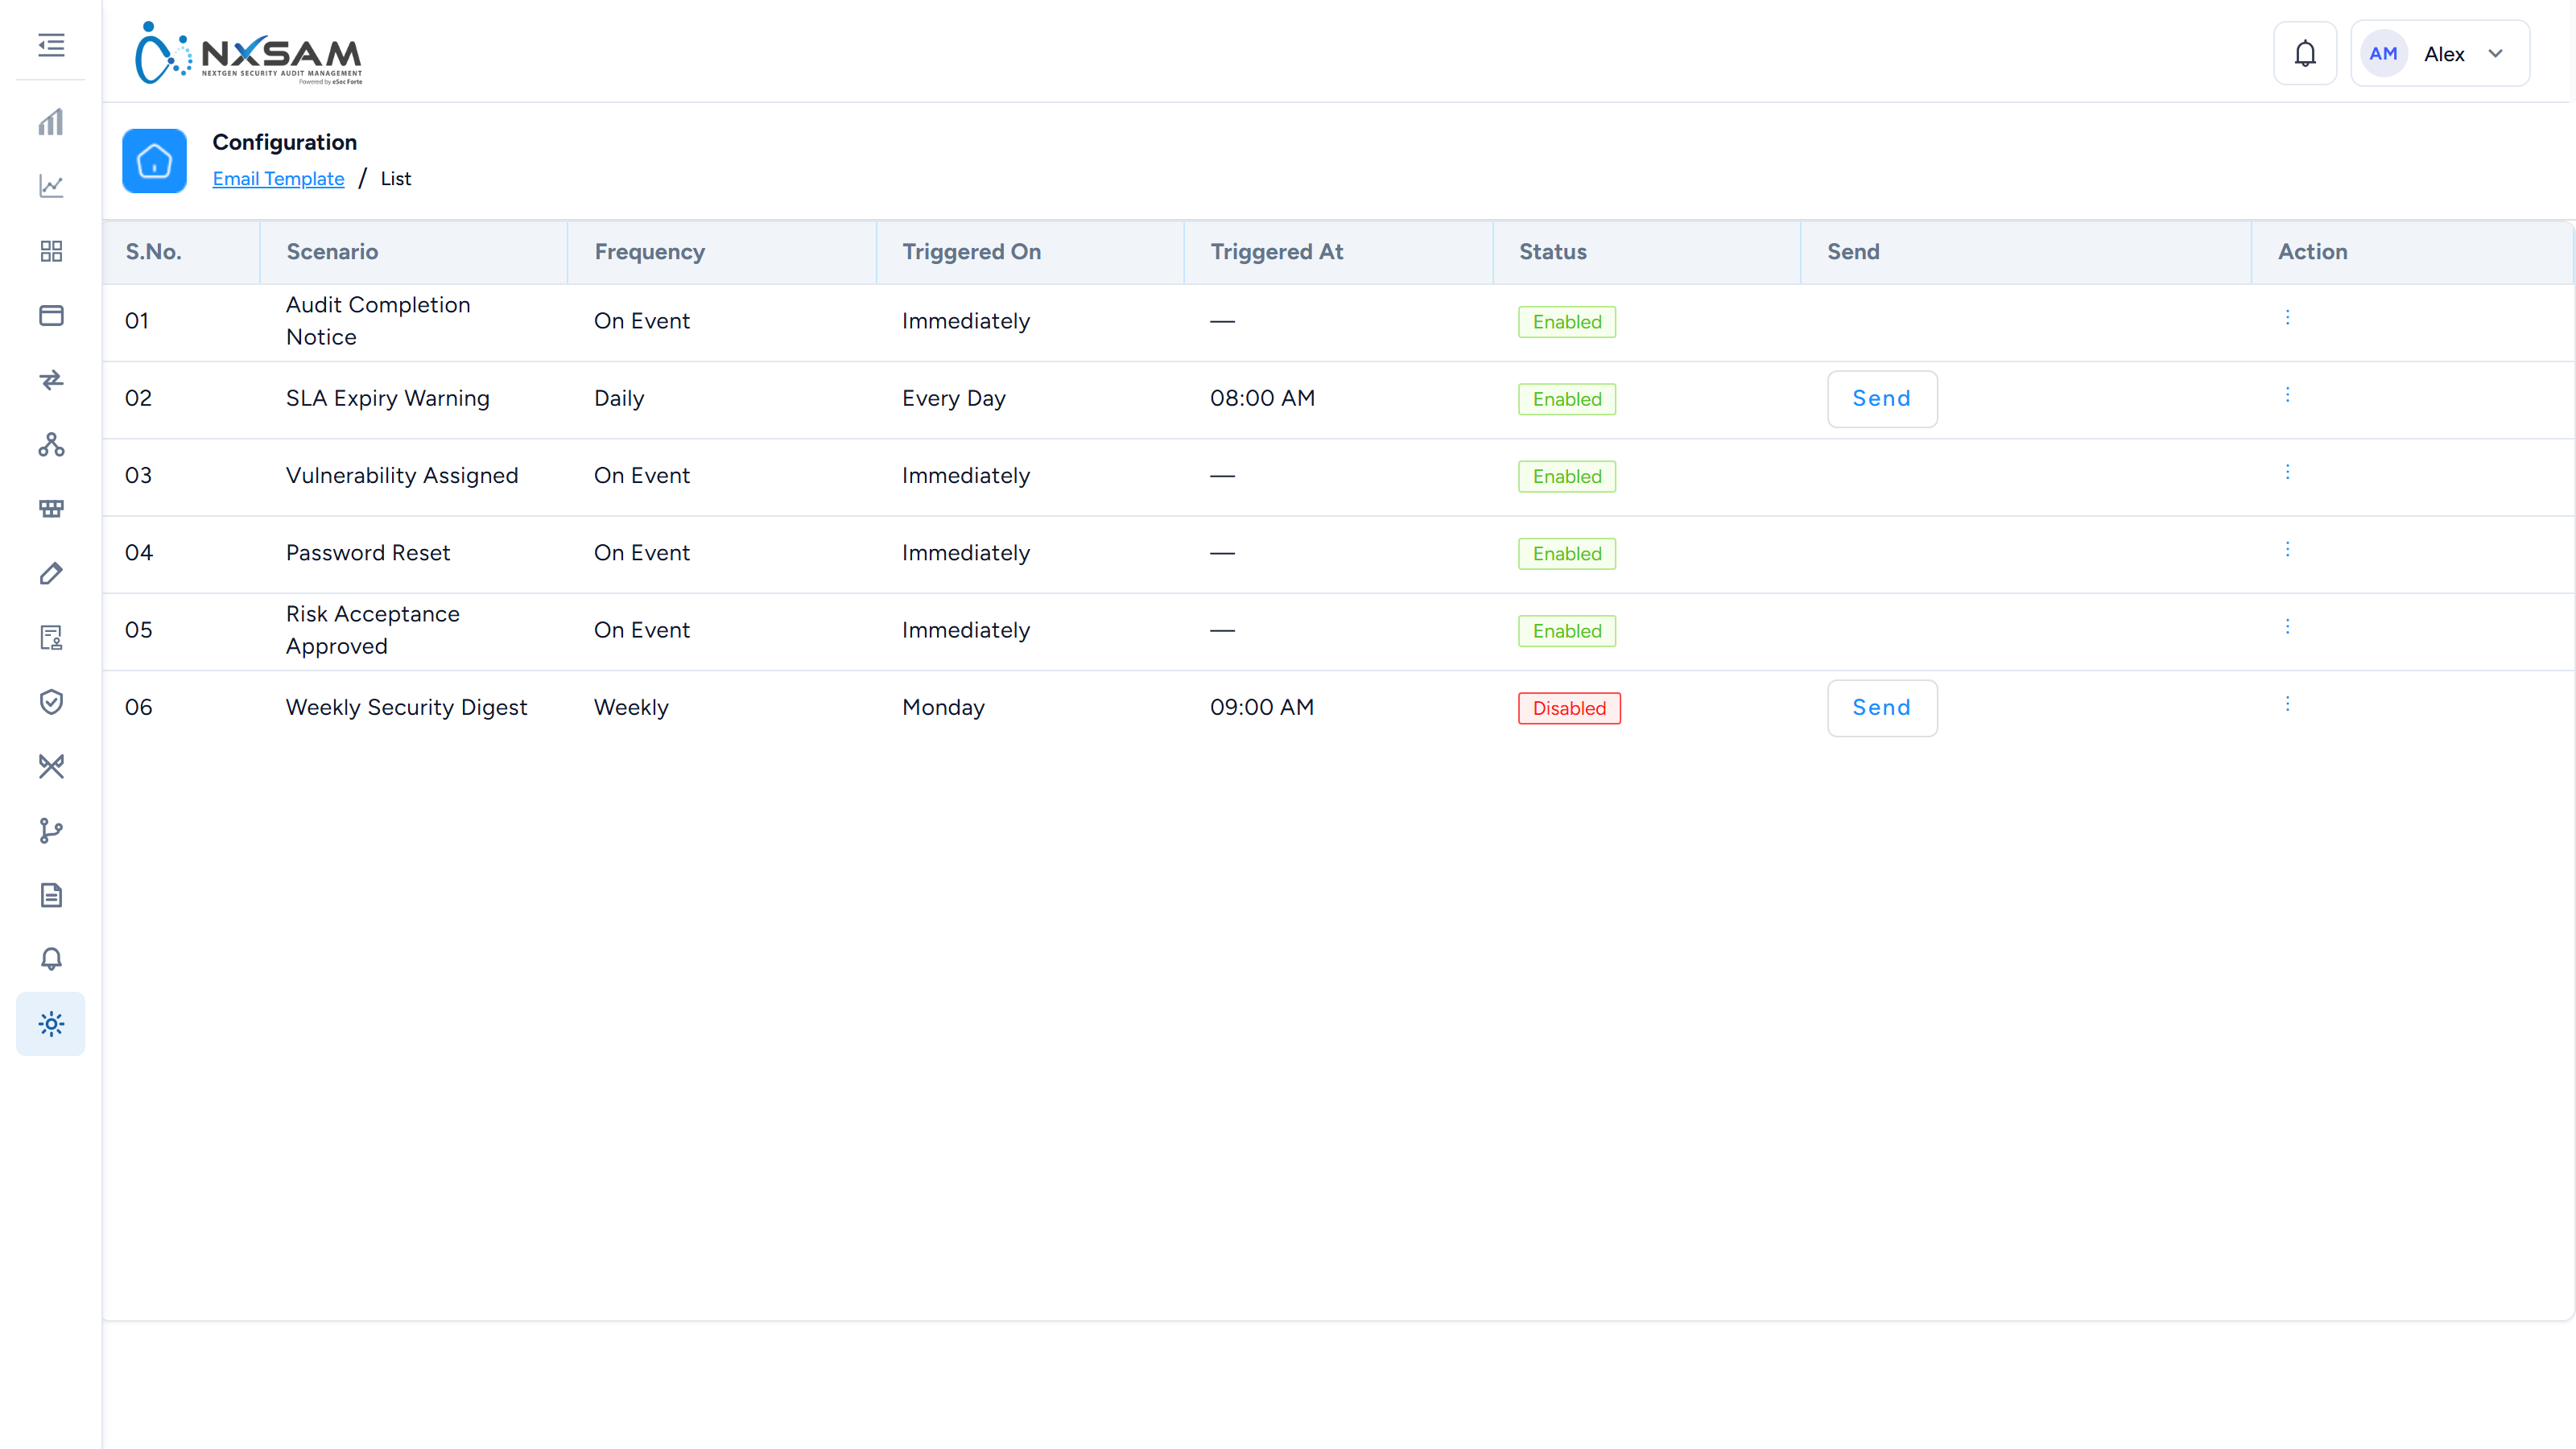
IP Groups
Address ranges sign-in can be restricted to.
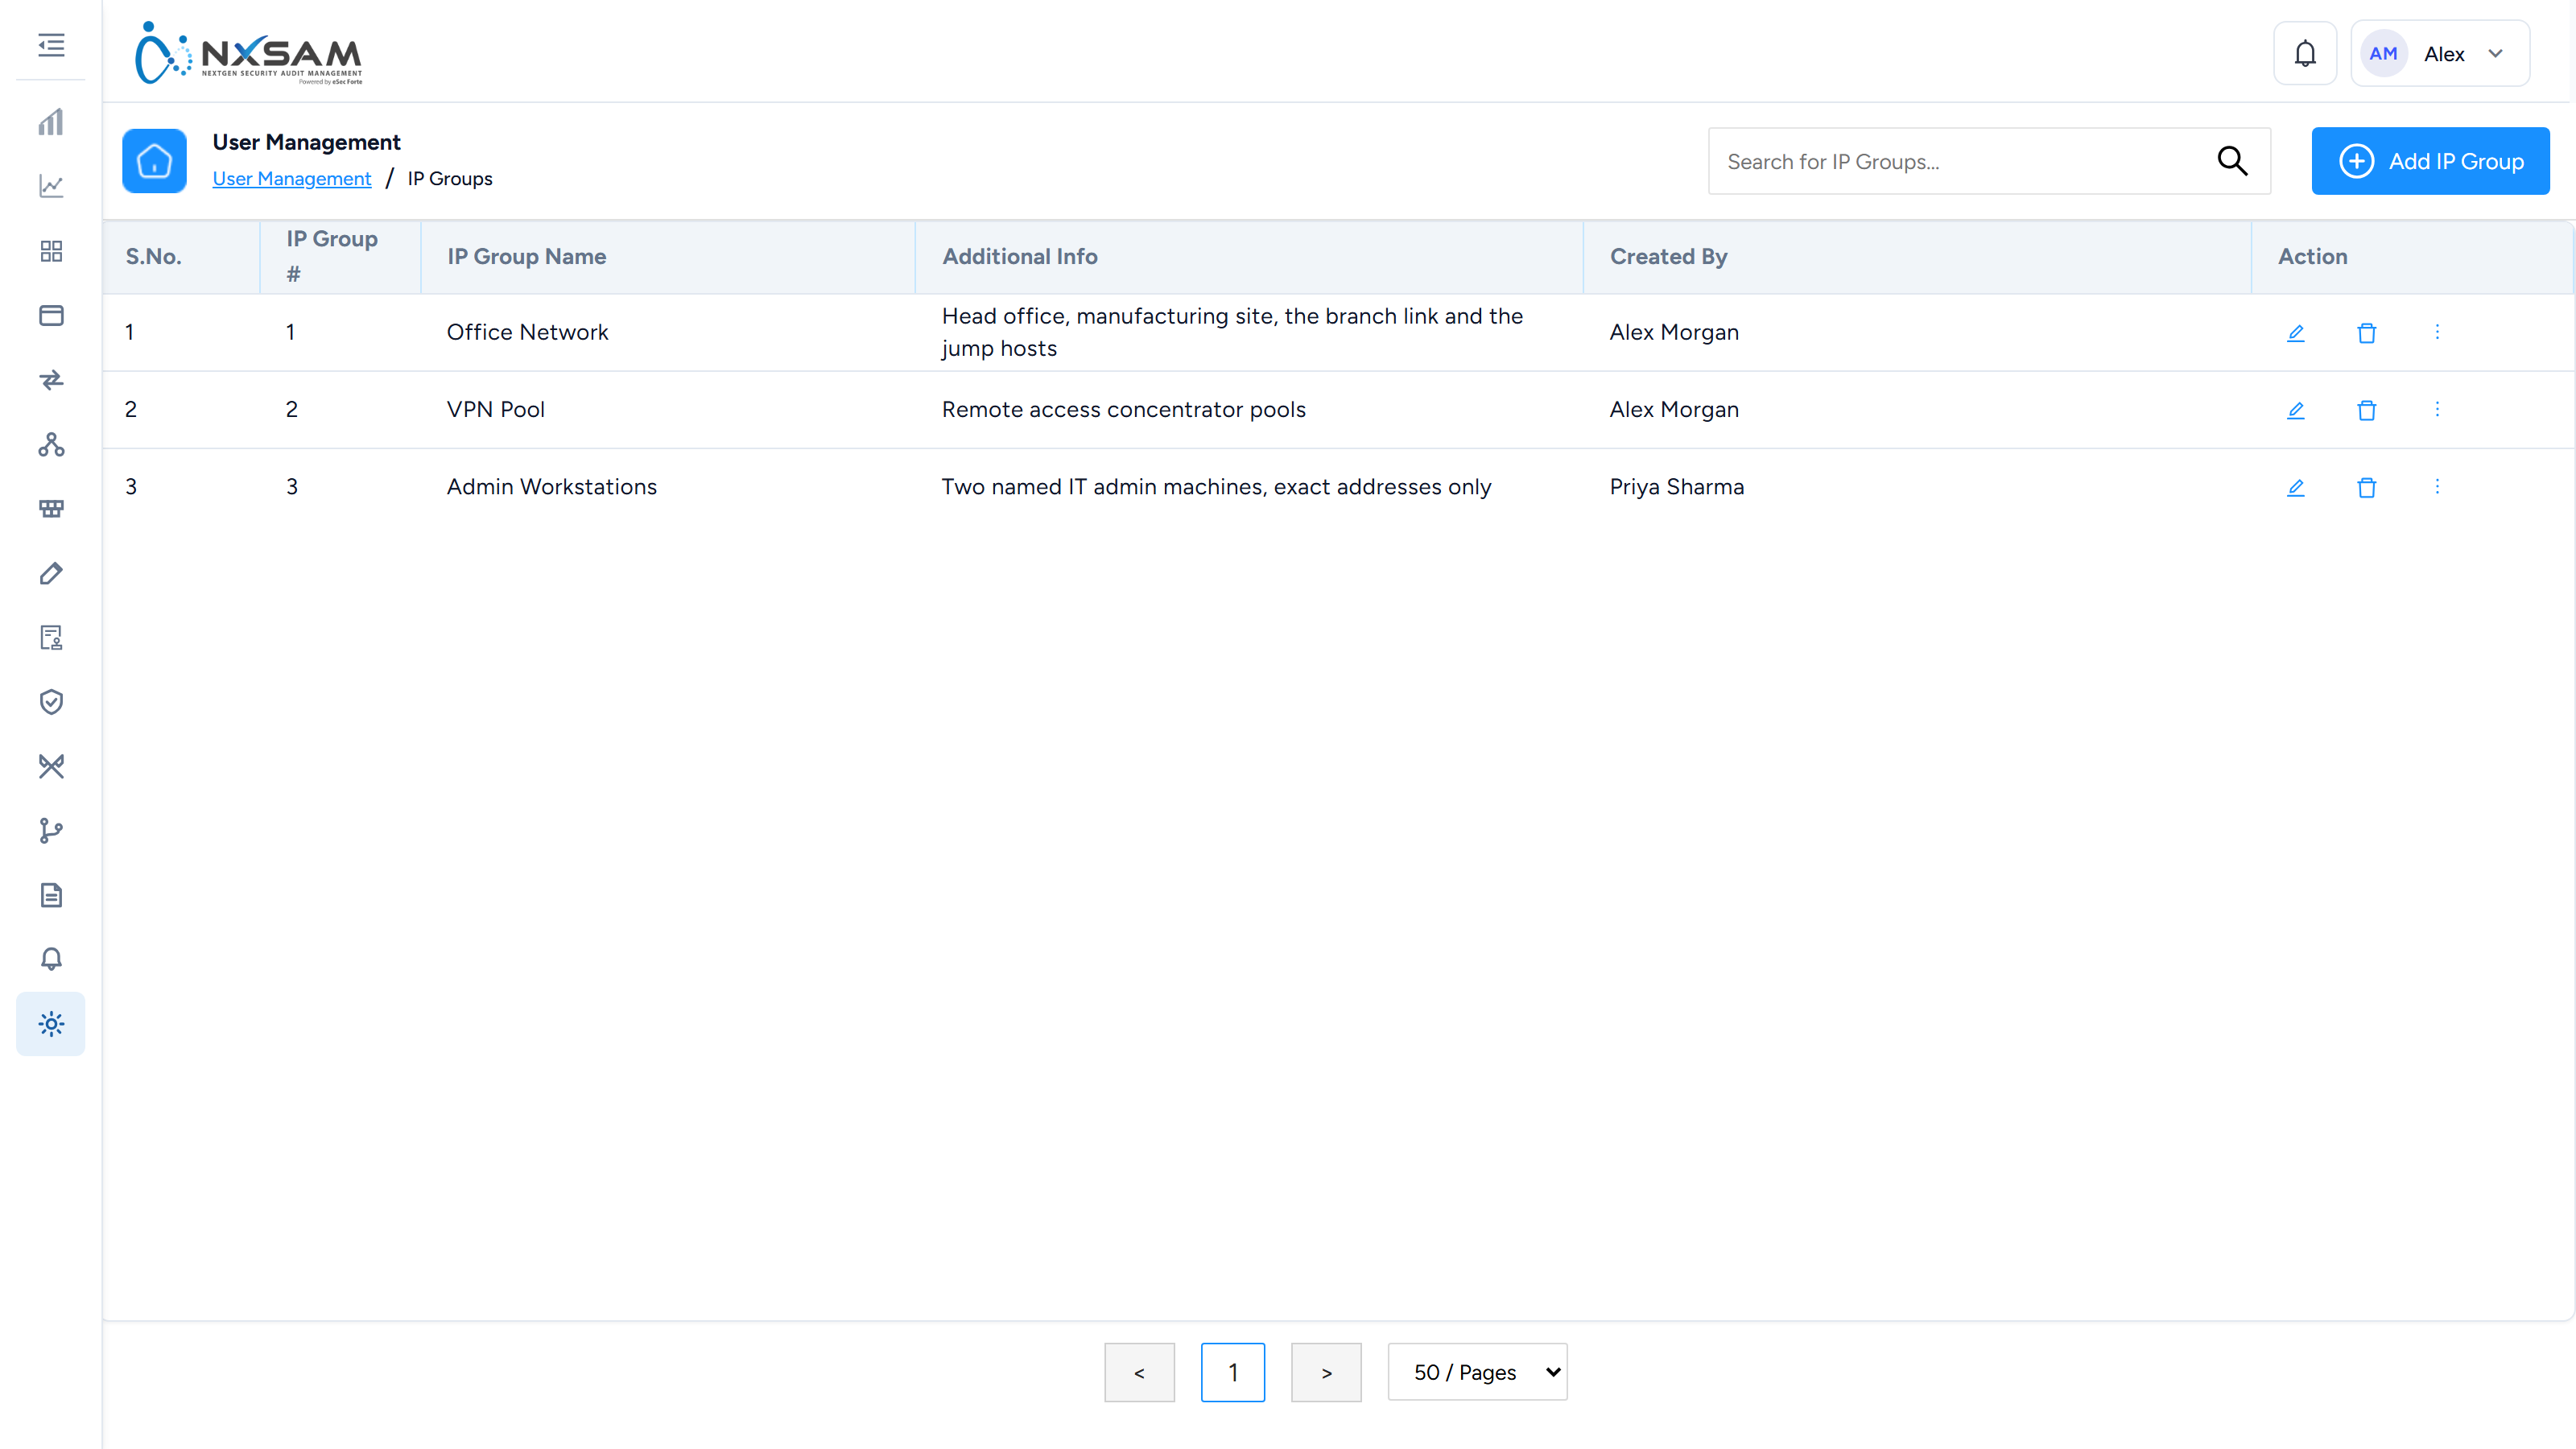
Network VA Groups
Groupings of network assets for assessment and reporting, usually by site or environment.
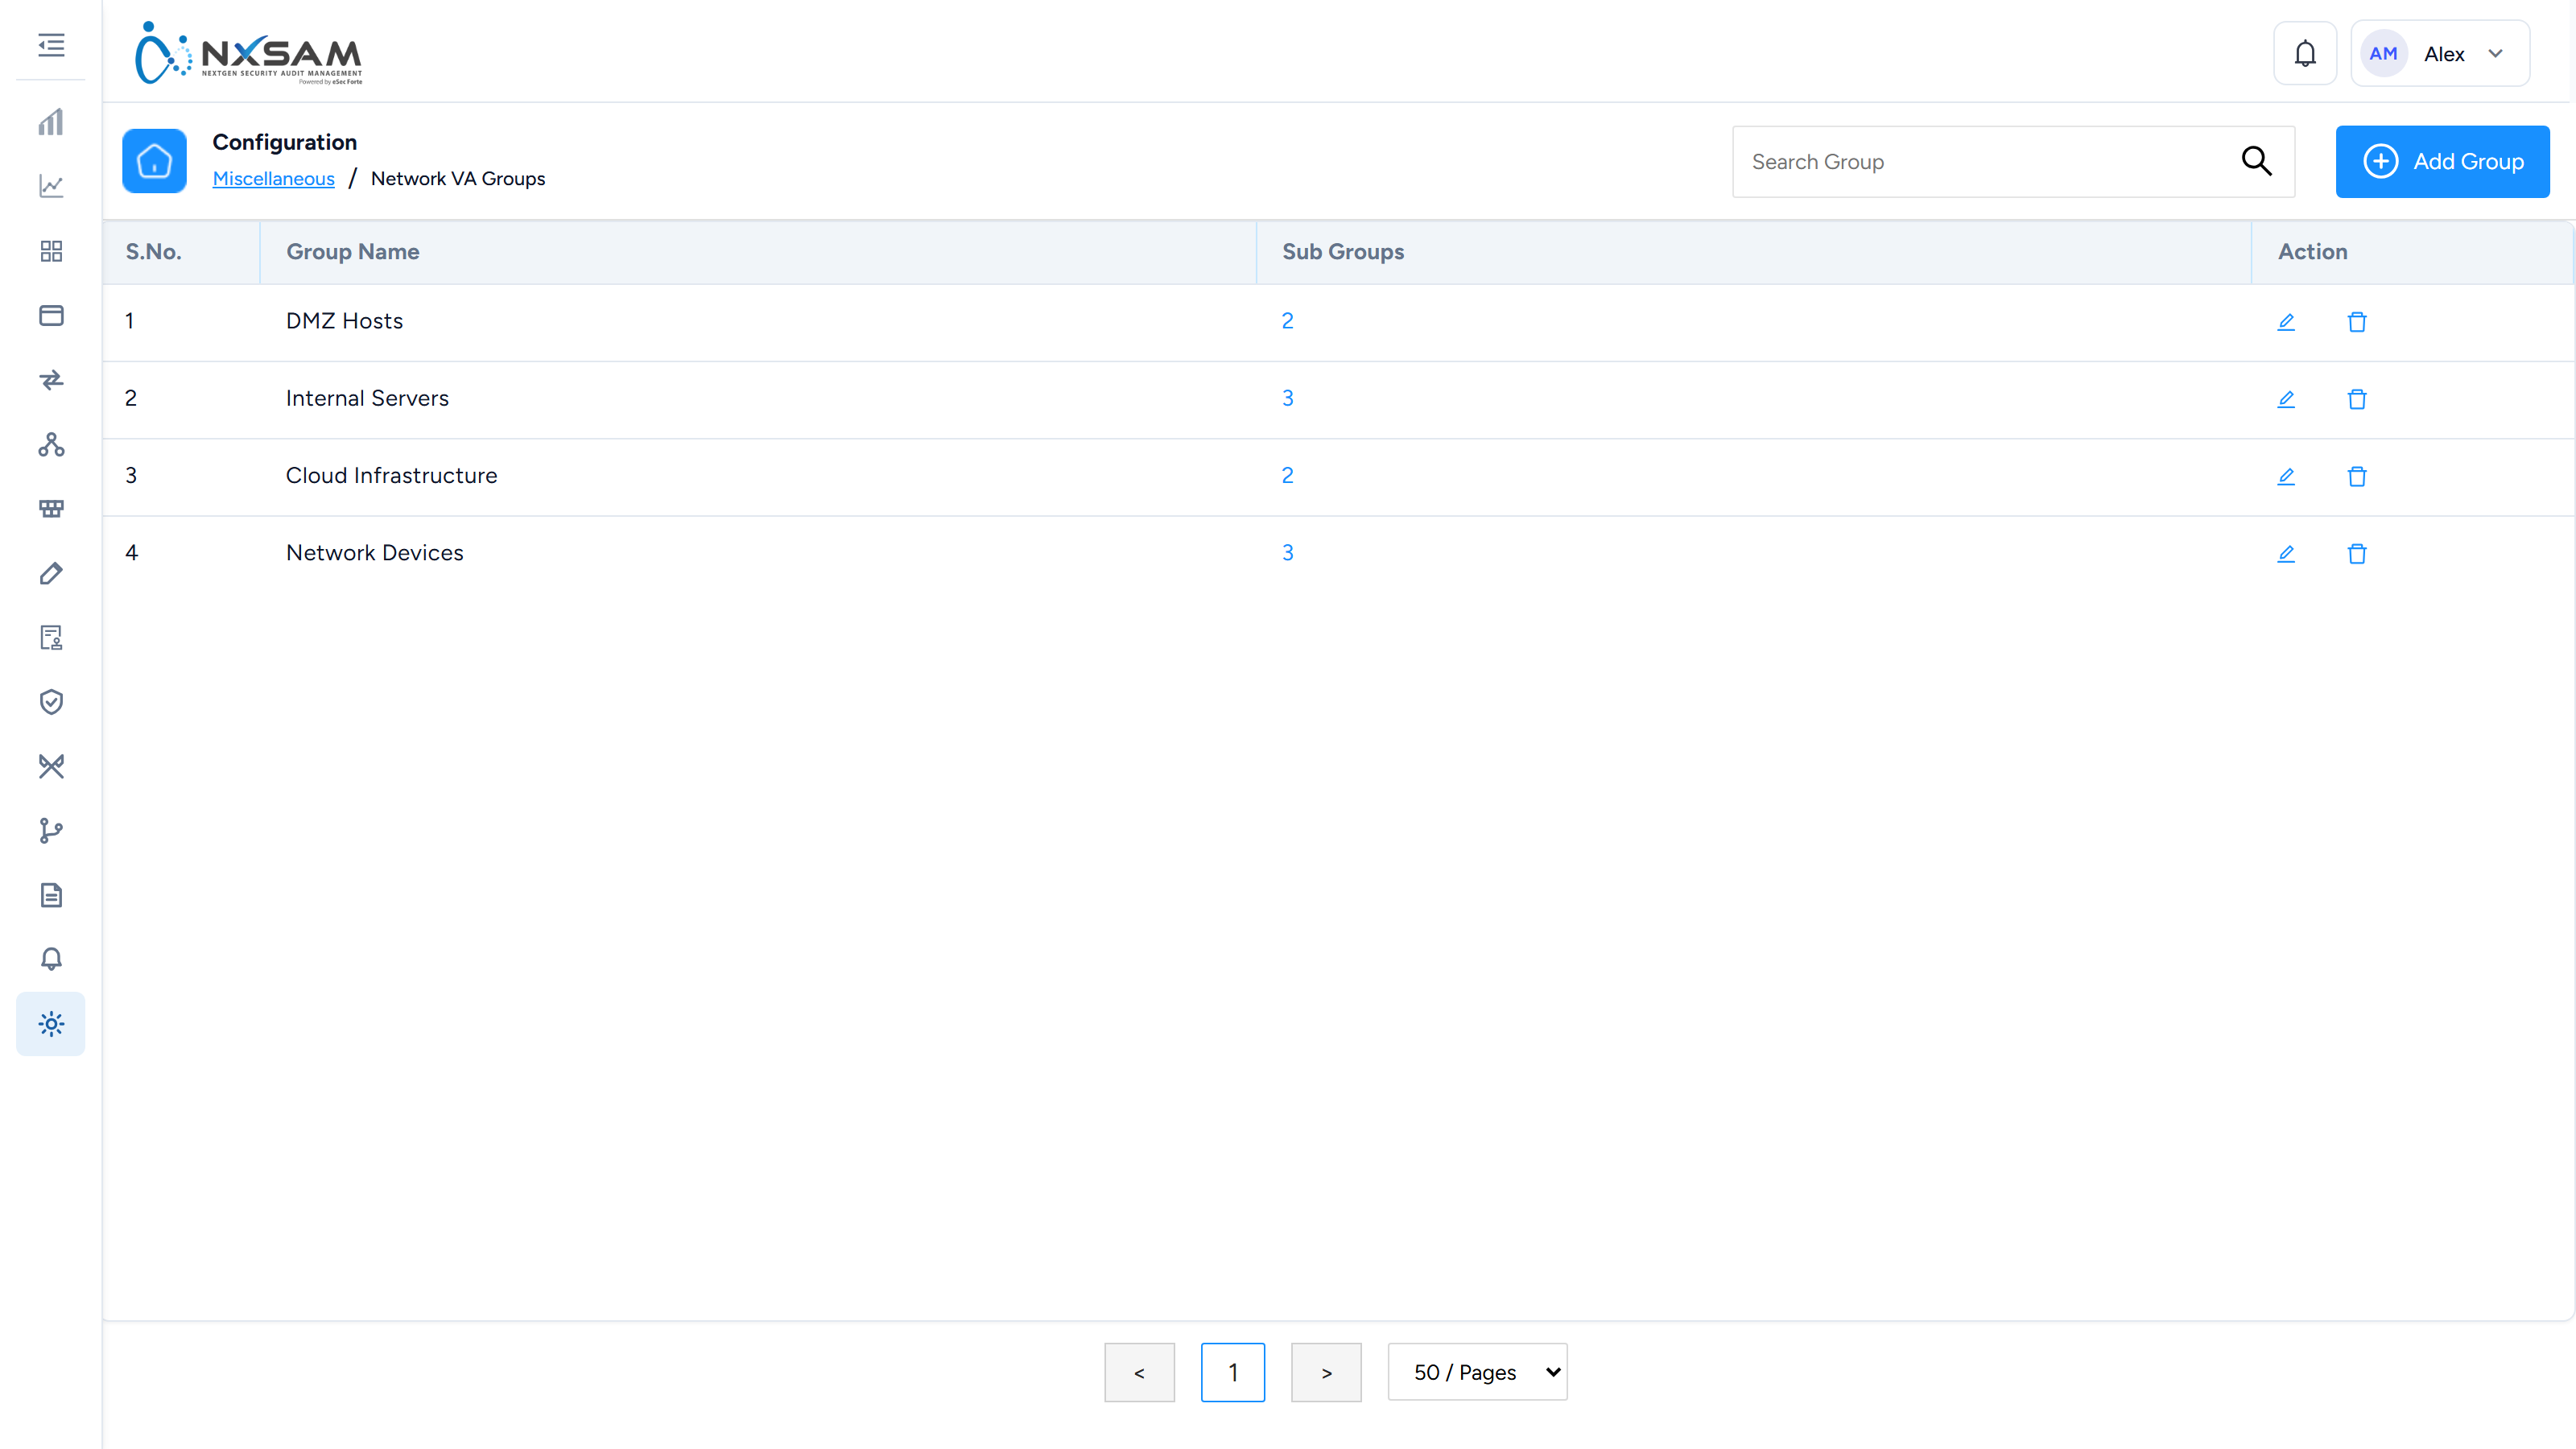
Network VA Sub-Groups
A second level of grouping within a VA group.
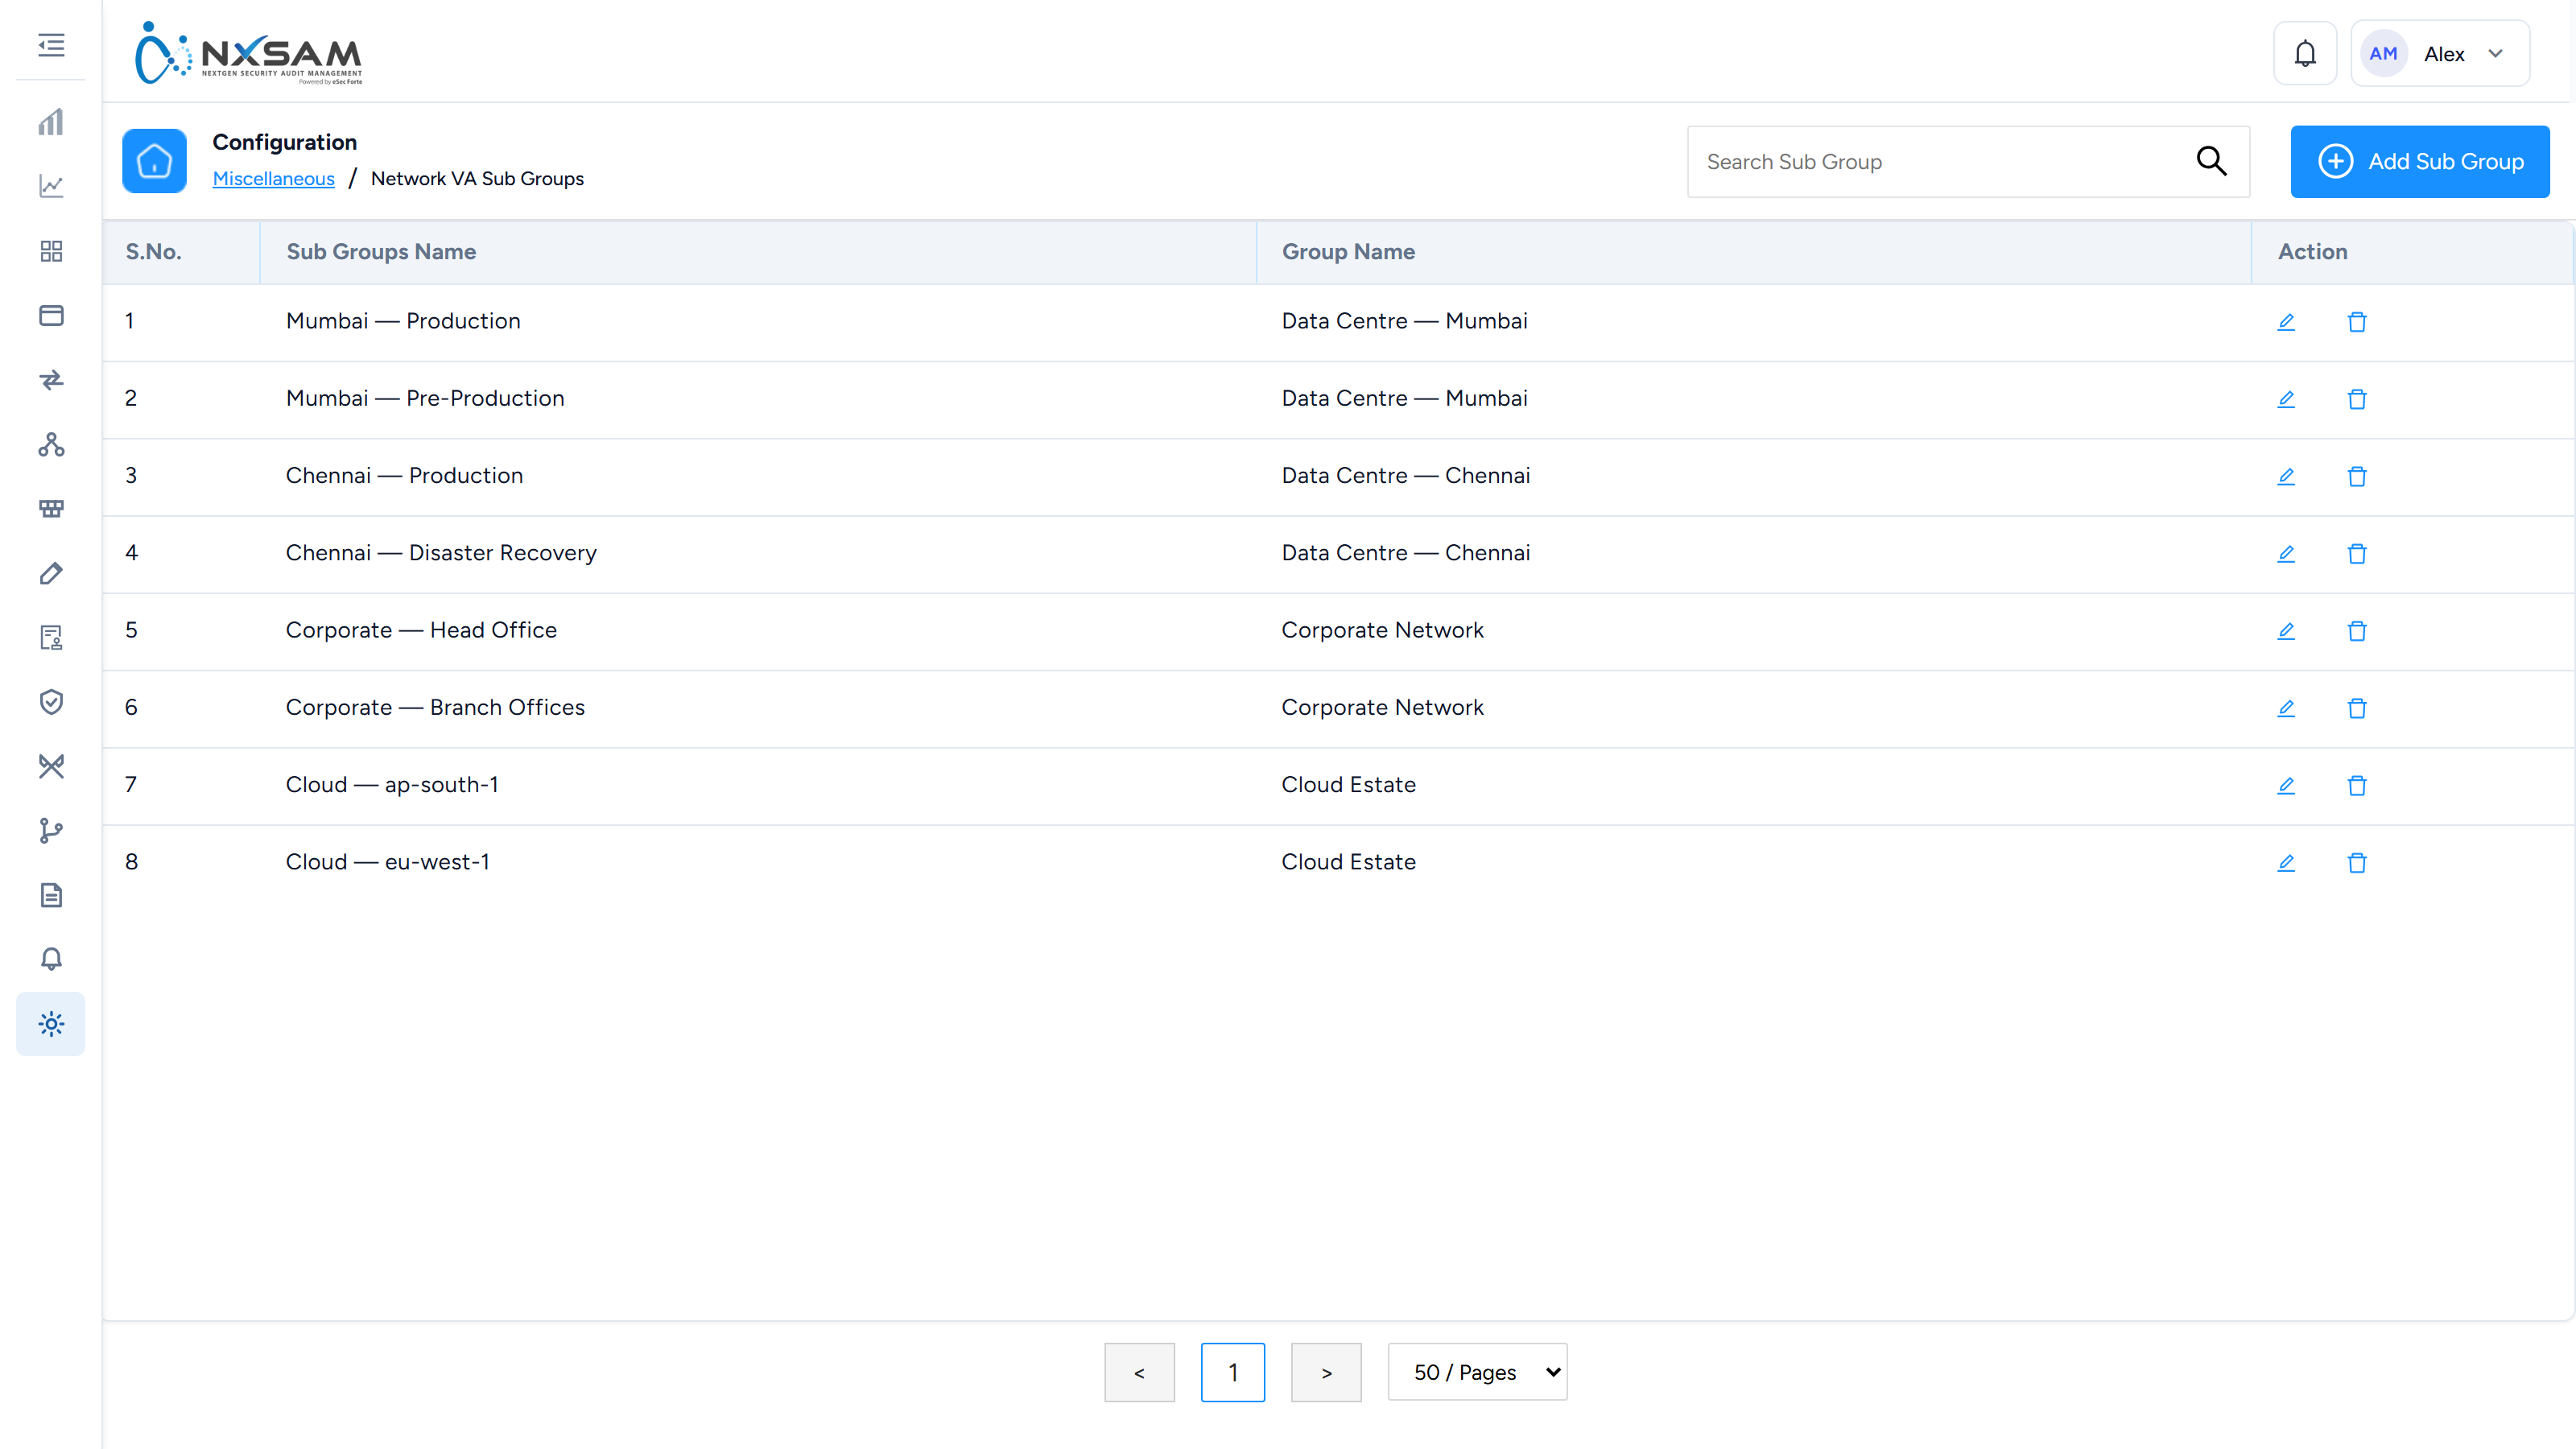
Priority Statuses
The priority values available on findings.
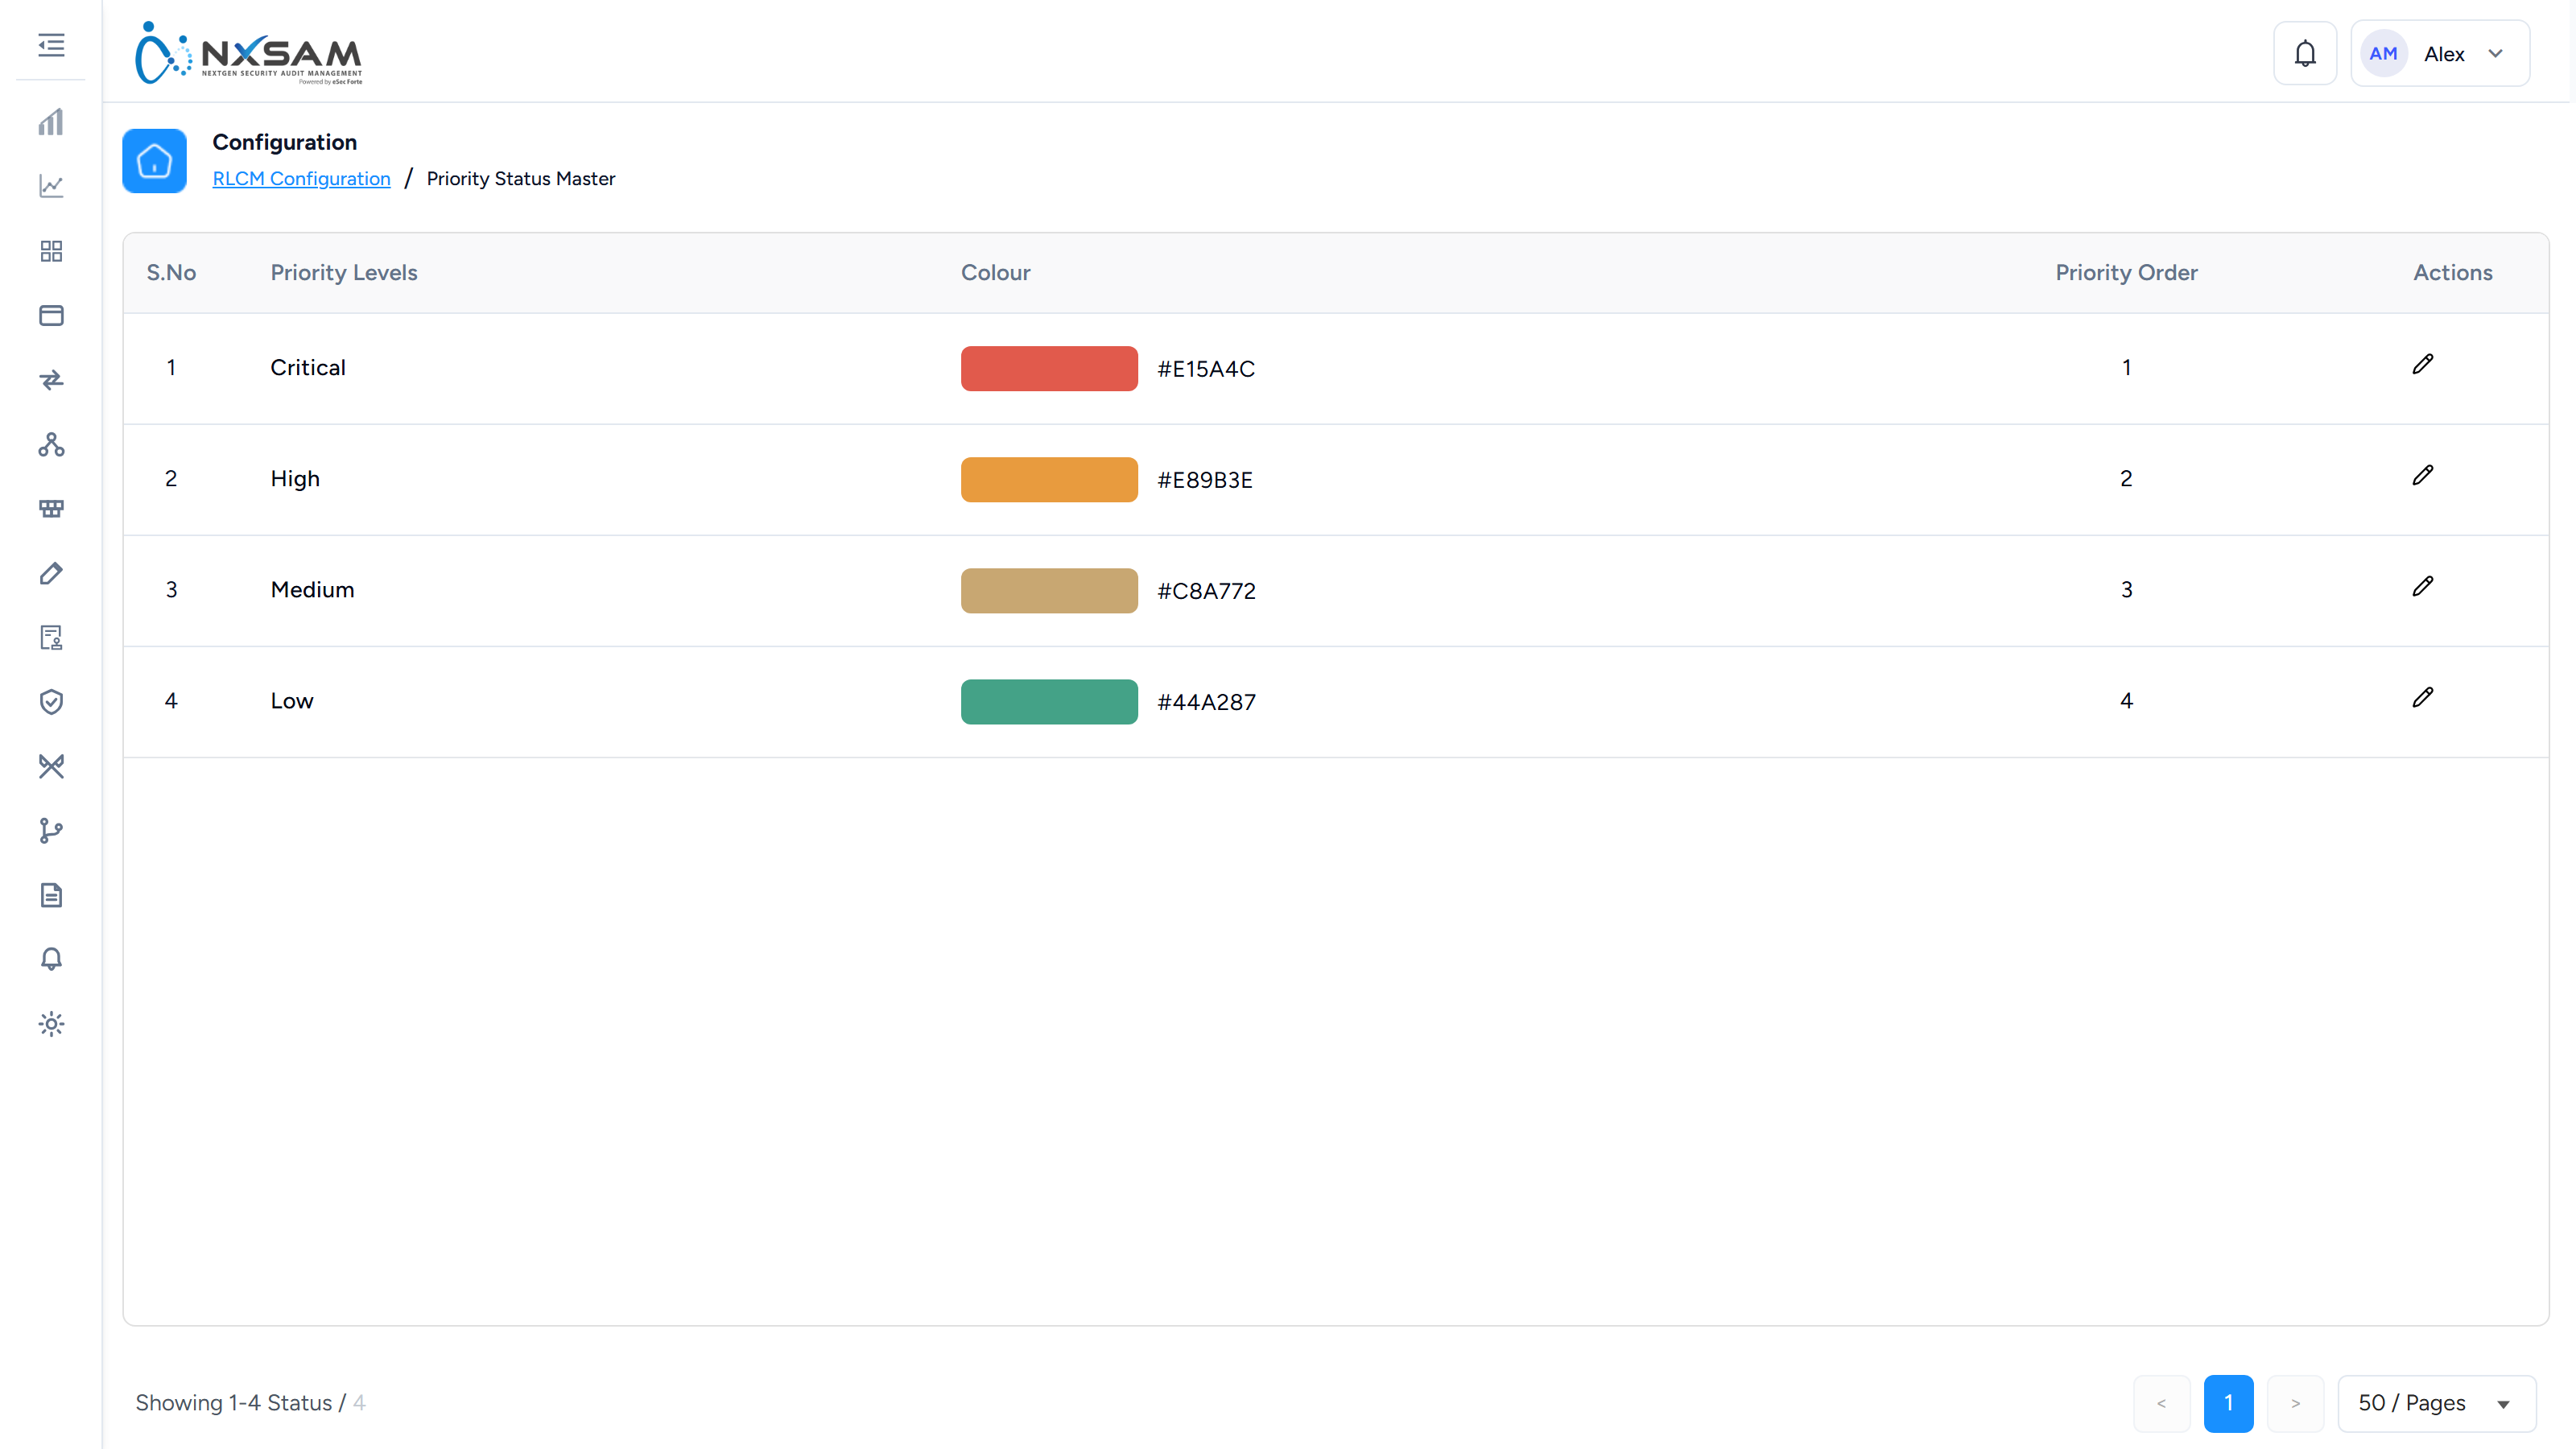
Risk Statuses
The risk states available across modules.
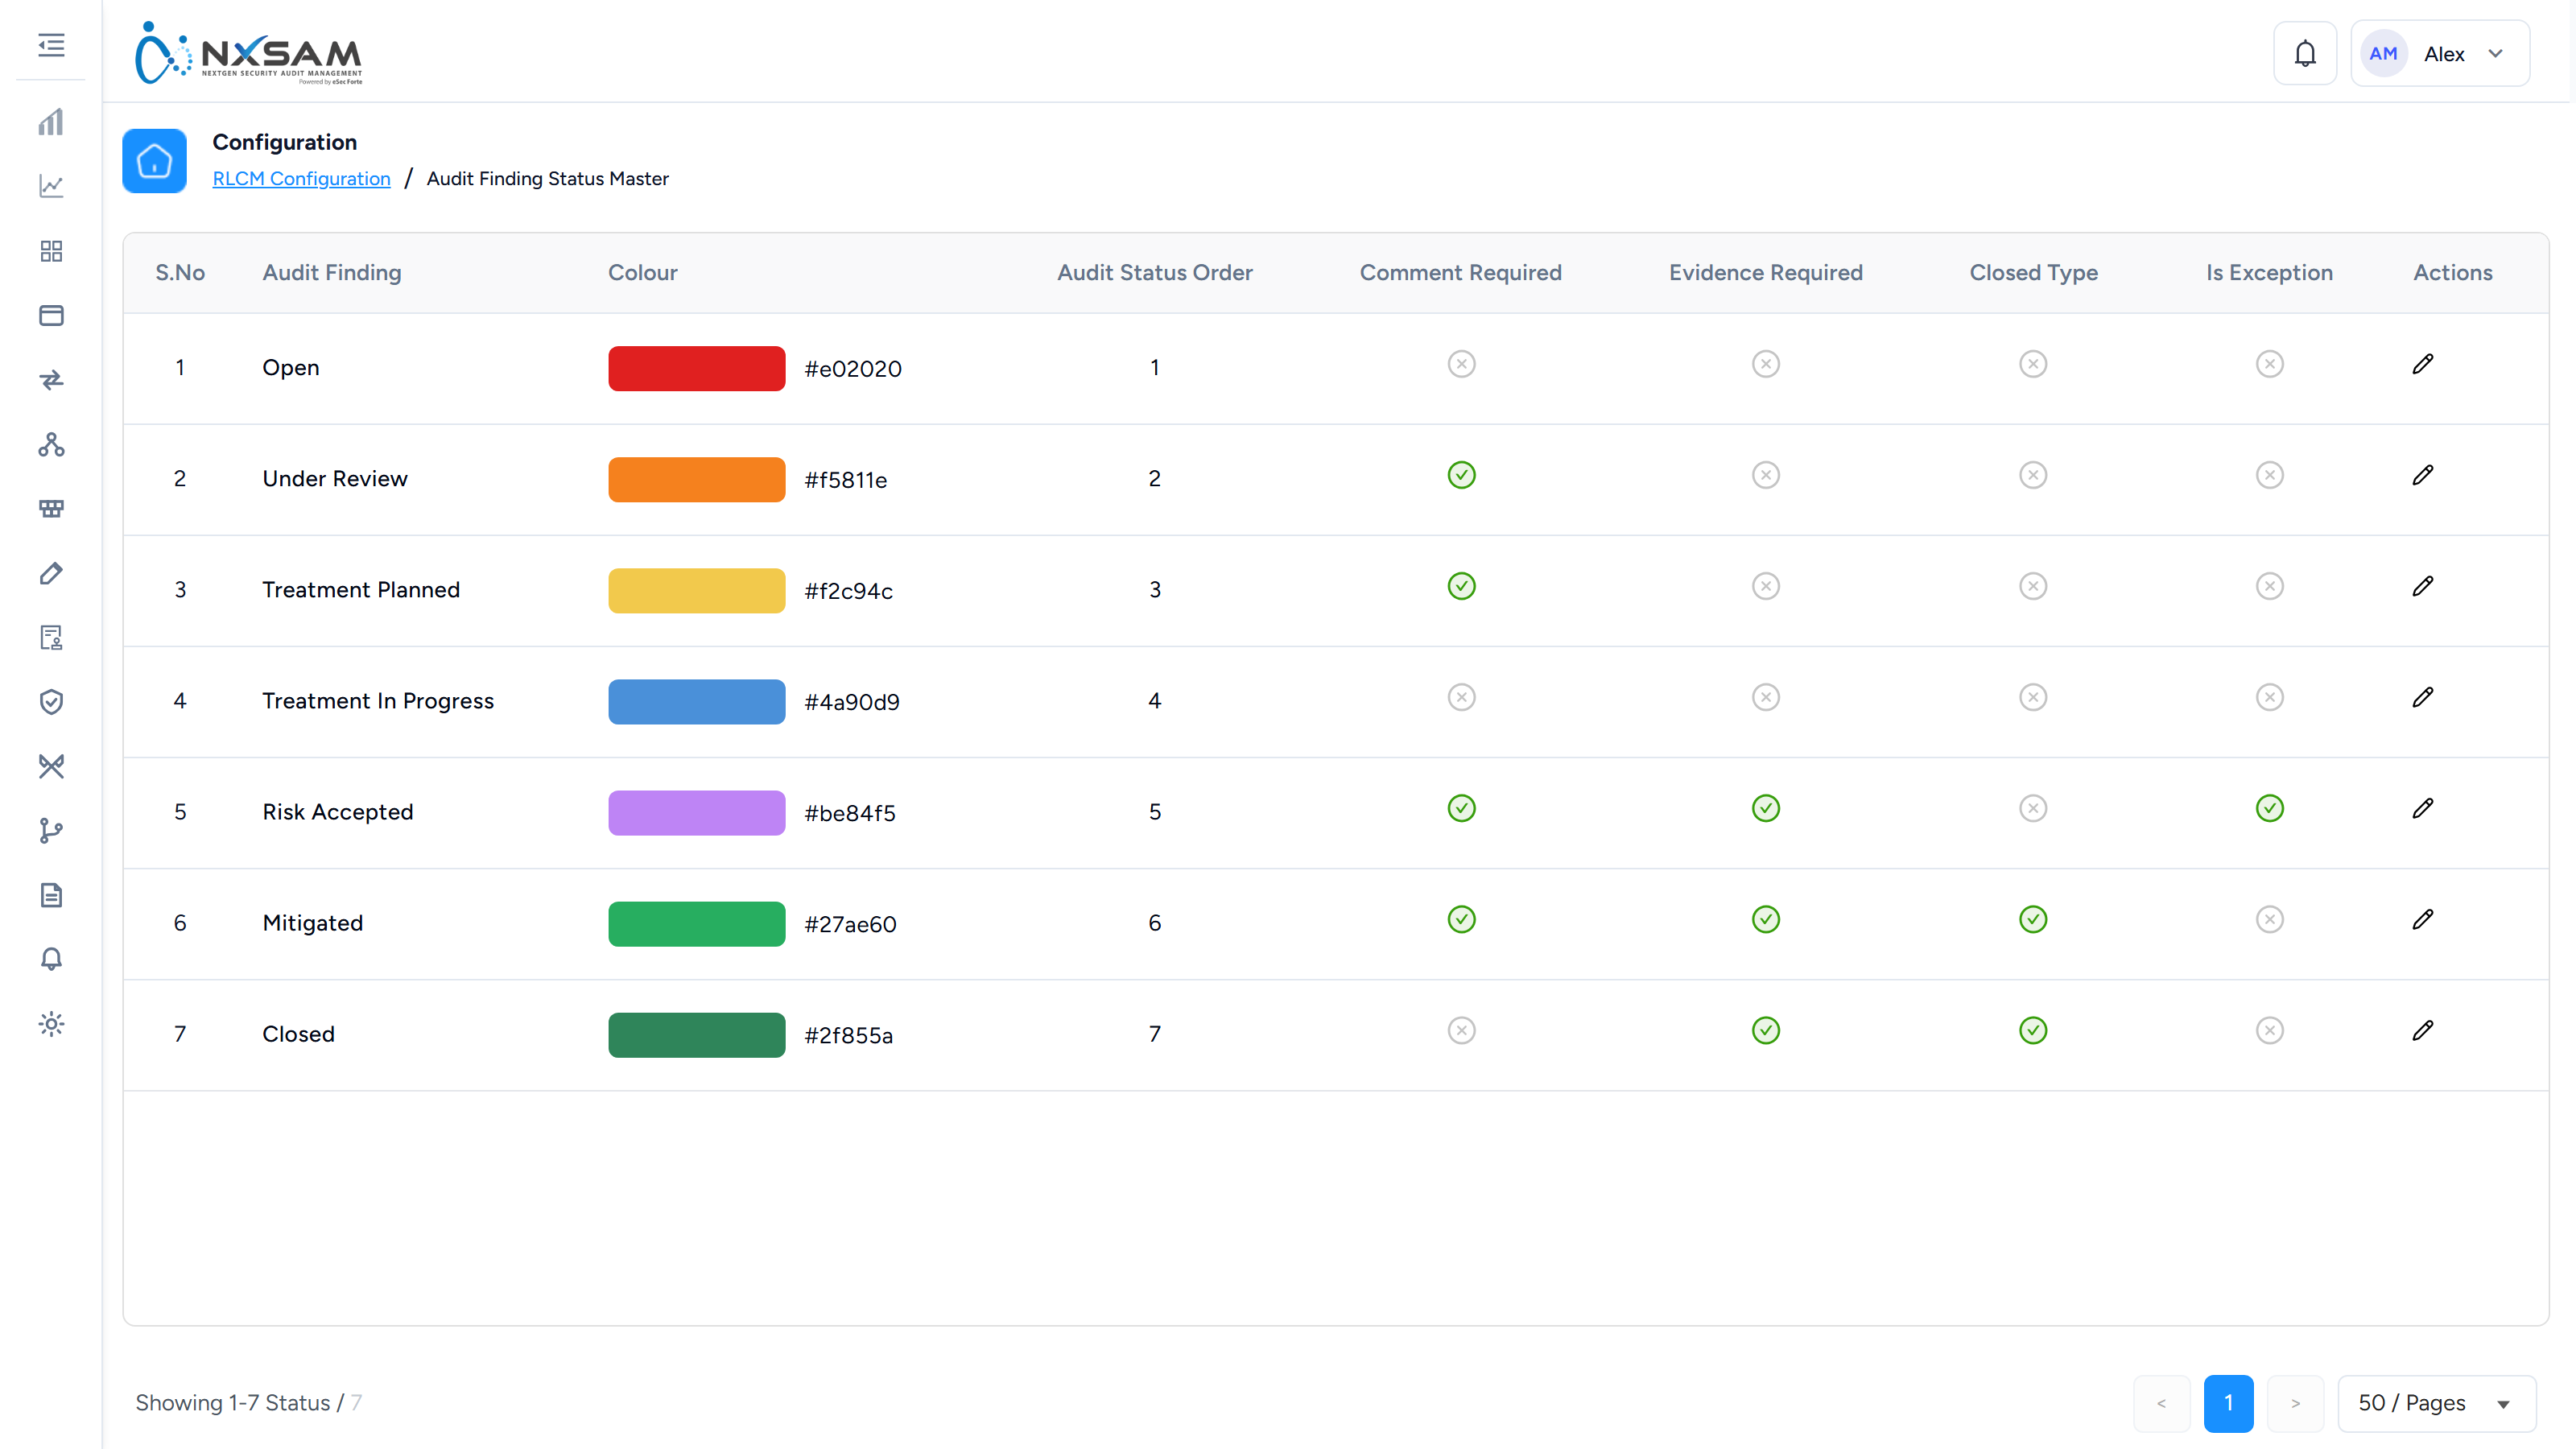
Roles
What each role can see and do. Permissions are granted to roles, never to people directly.
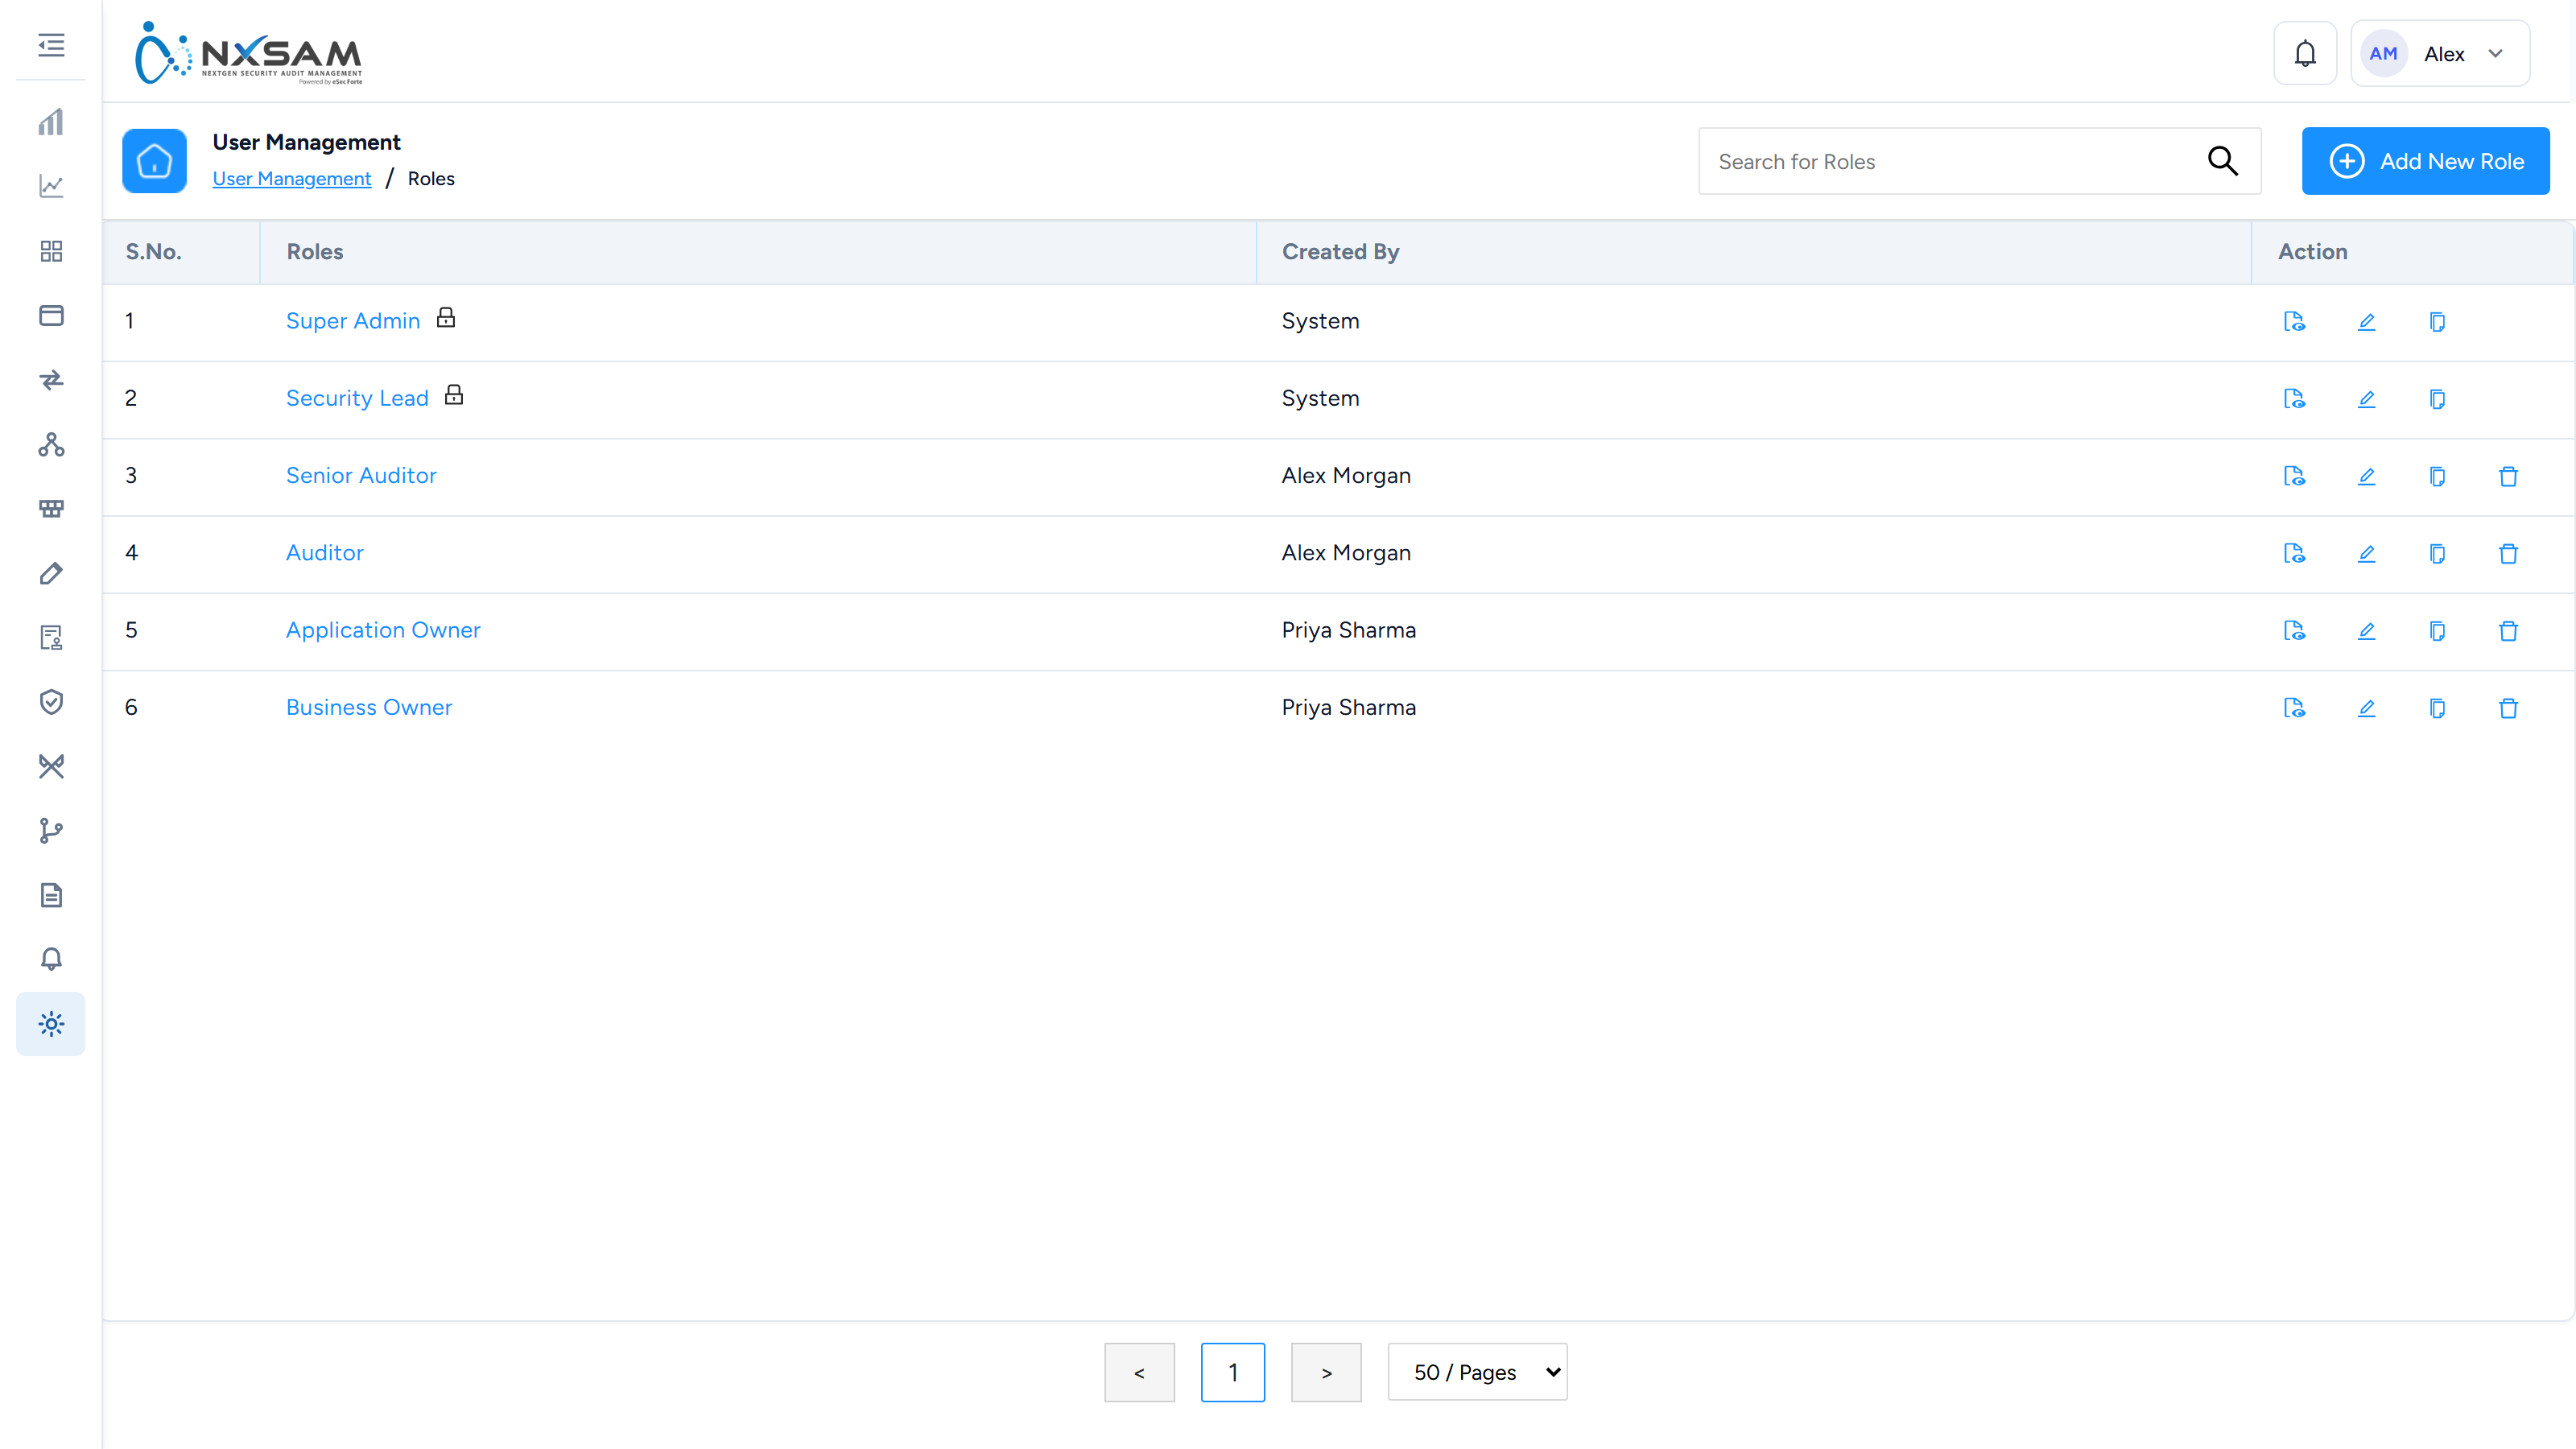
Super Administrators
Accounts with unrestricted access. Worth reviewing on a schedule.
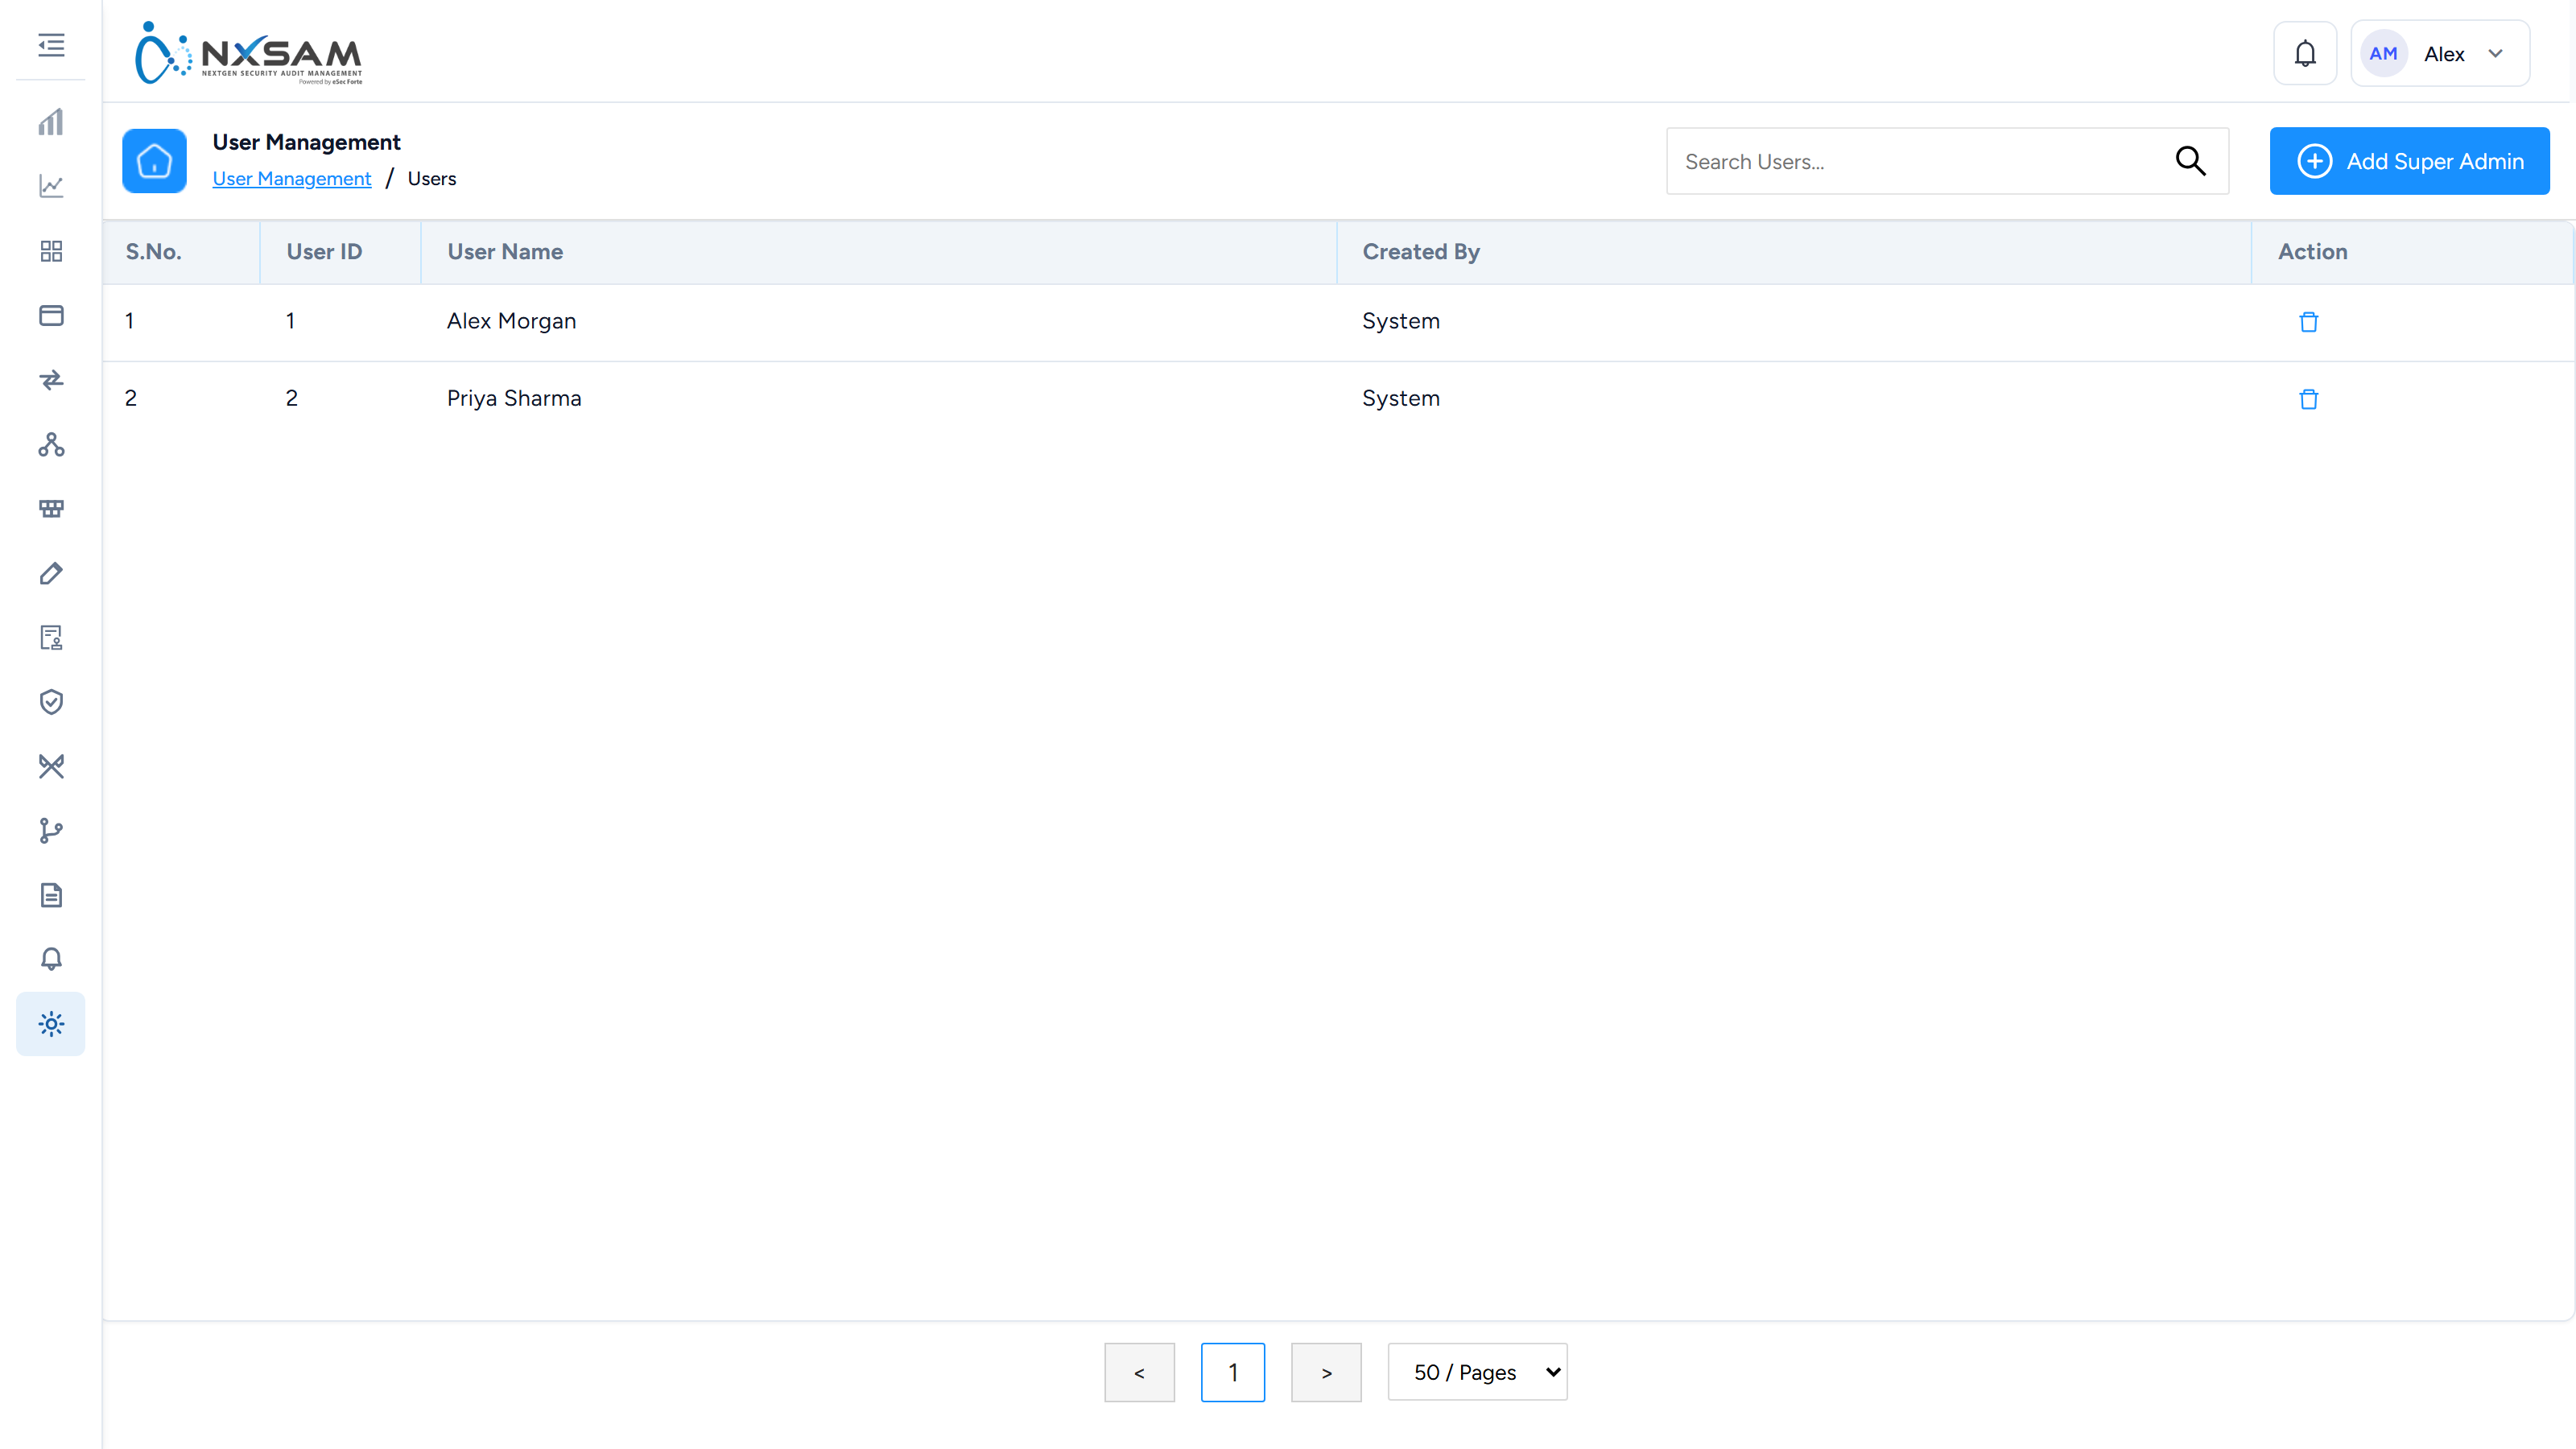
Test Case Categories
How test cases are grouped for reporting, and which report type each group belongs to.
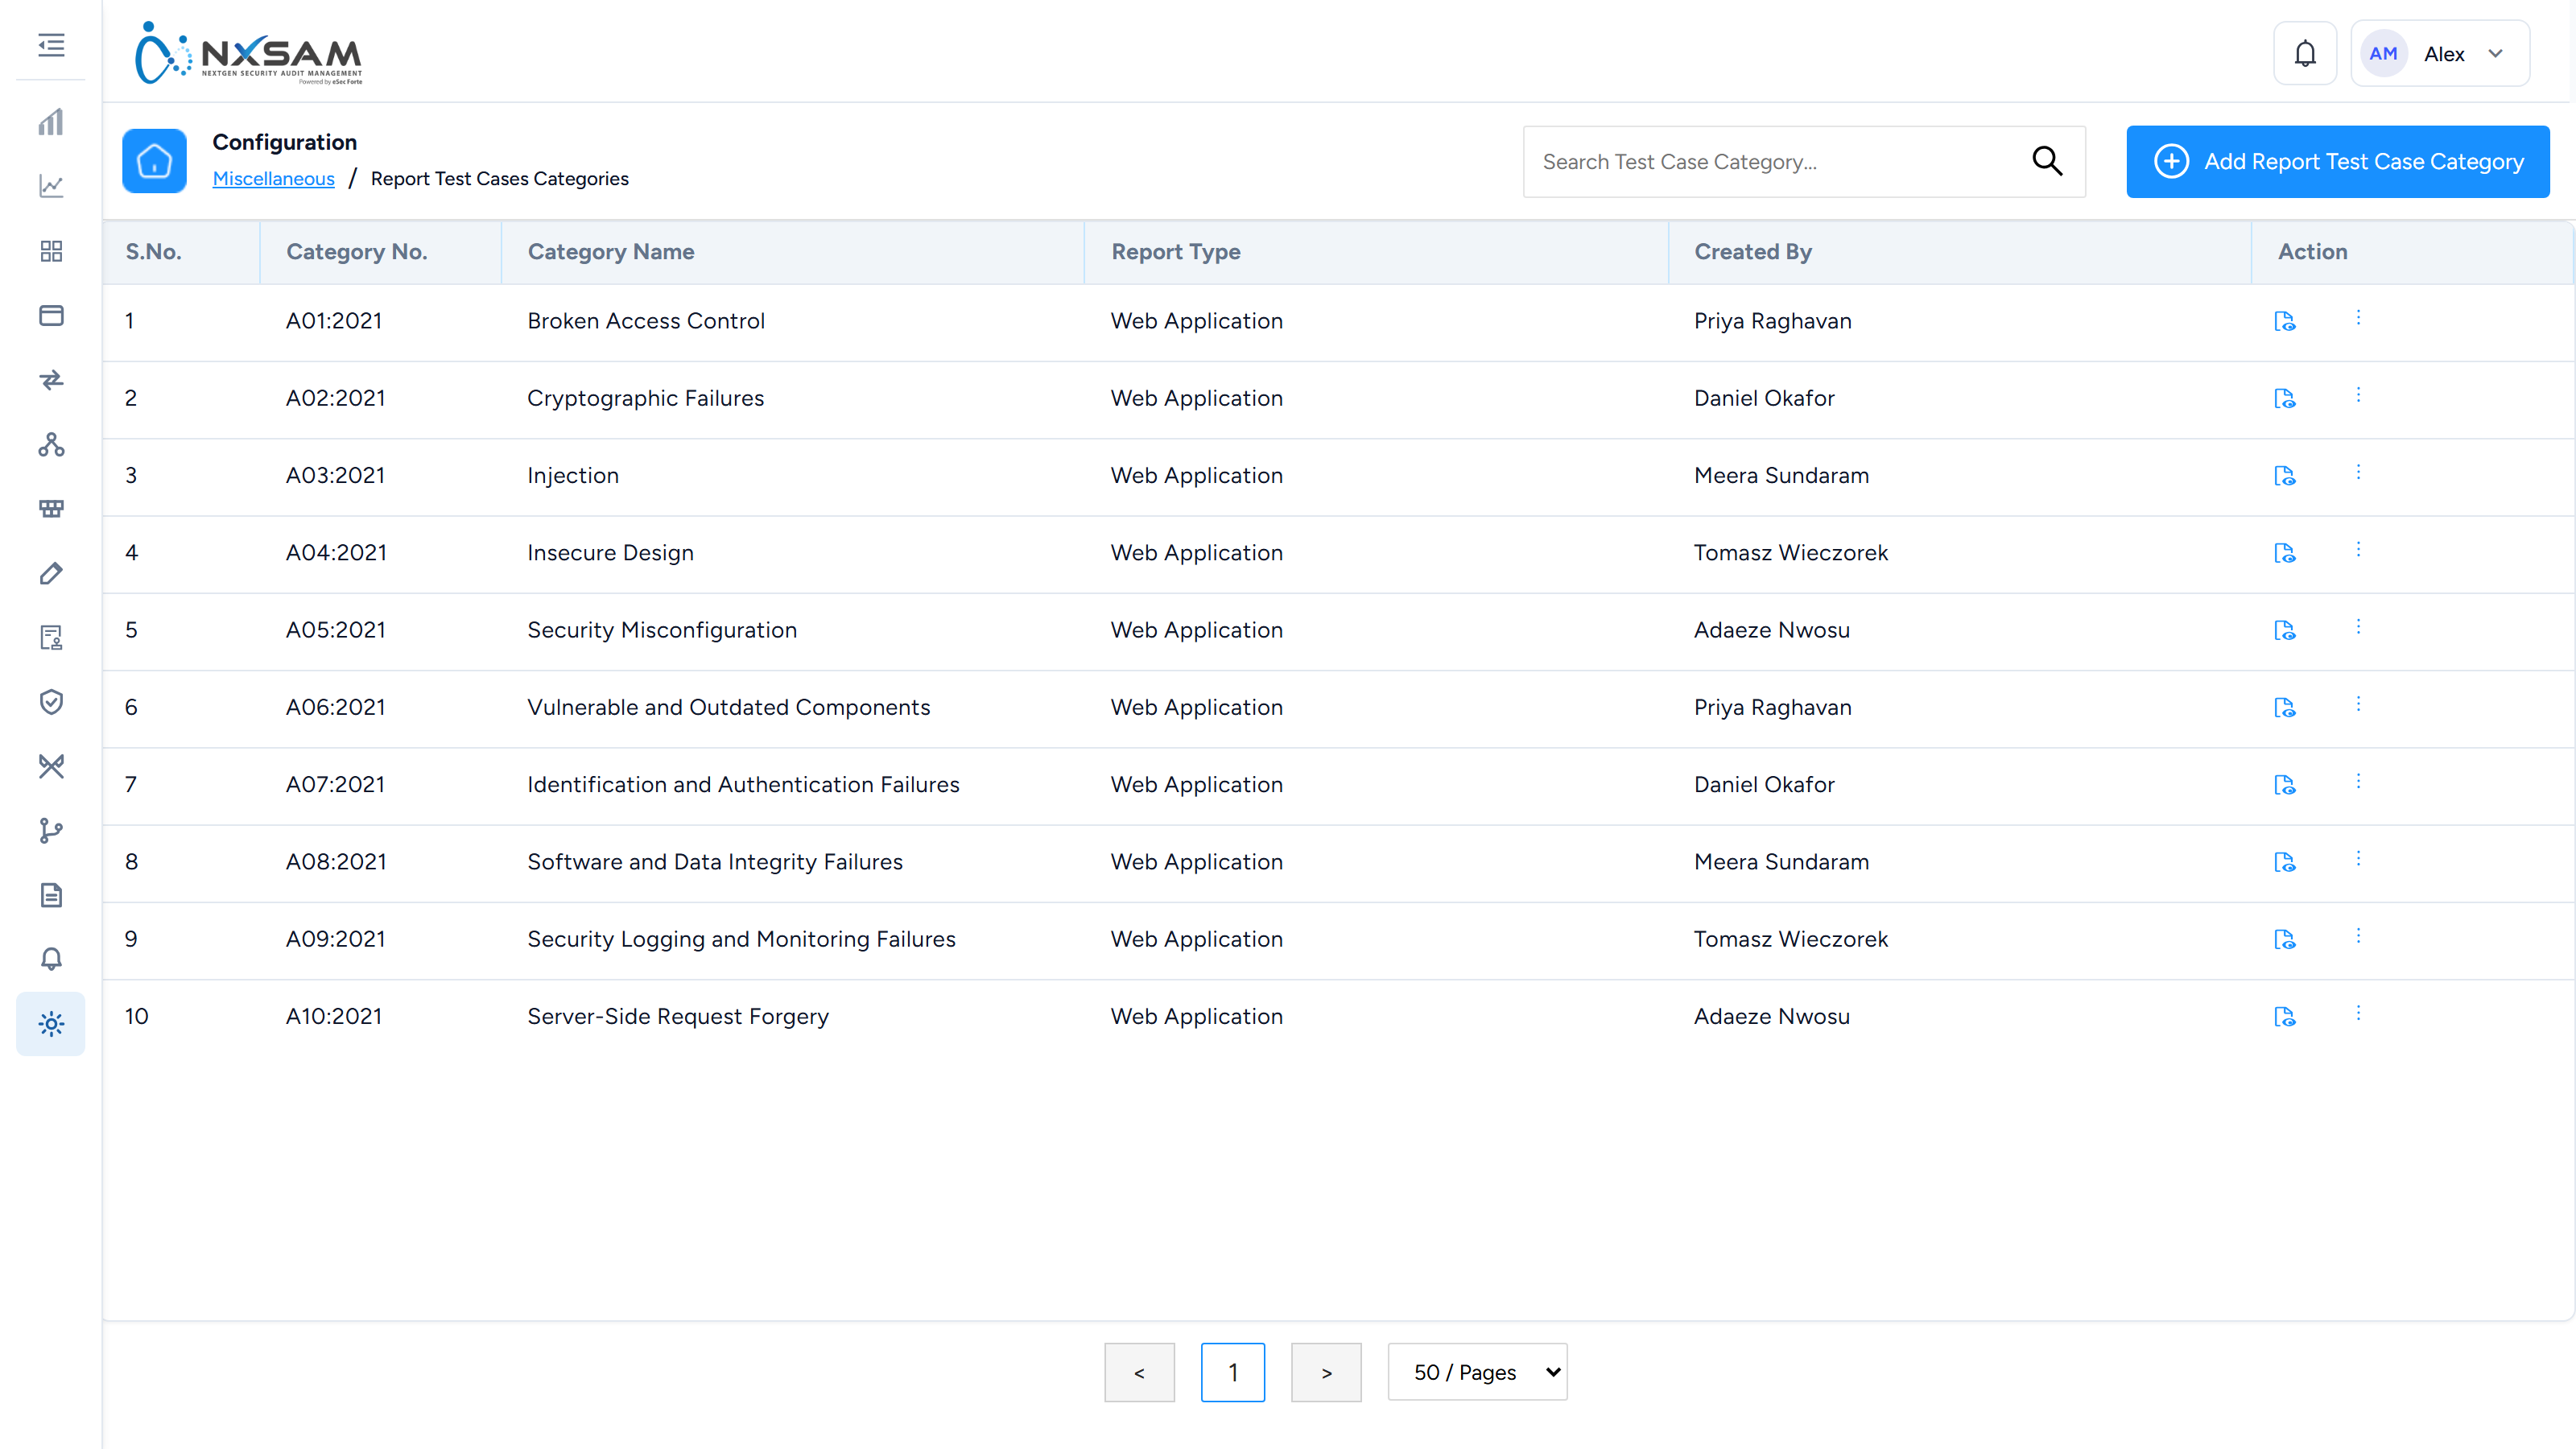
Test Cases
Individual checks a tester works through during a manual assessment.
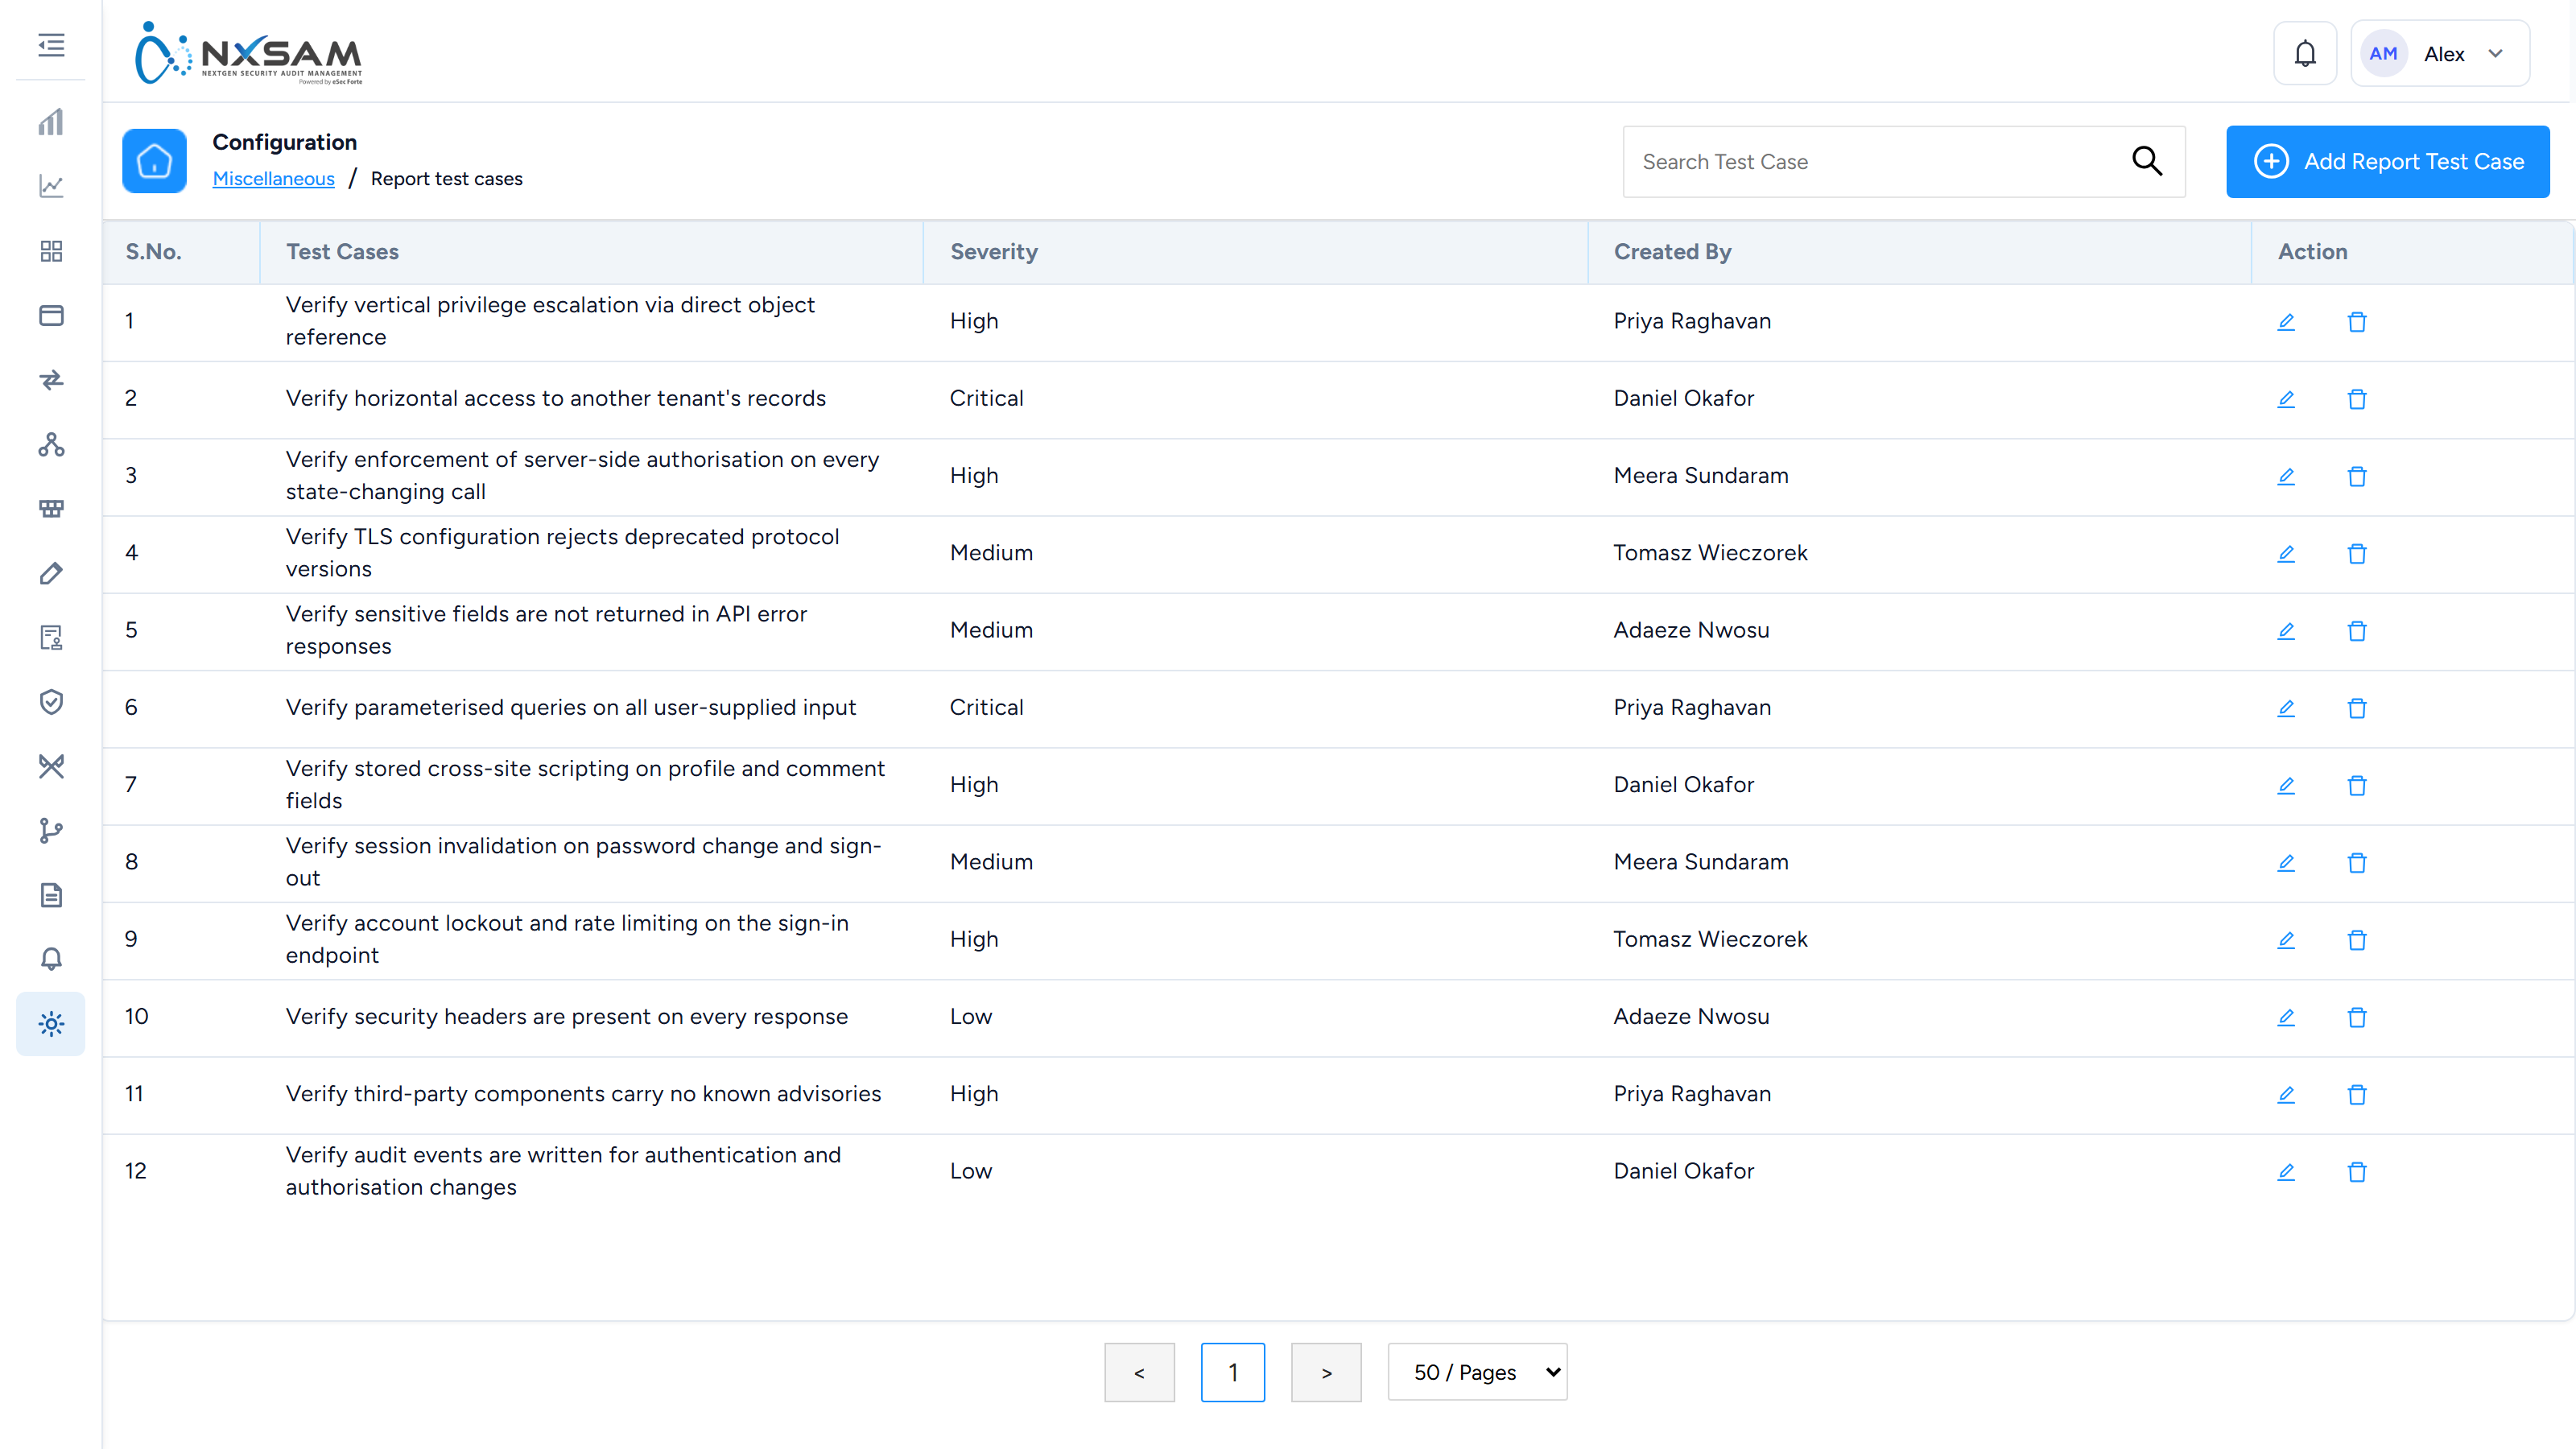
User Groups
Groups used to assign access to several people at once.
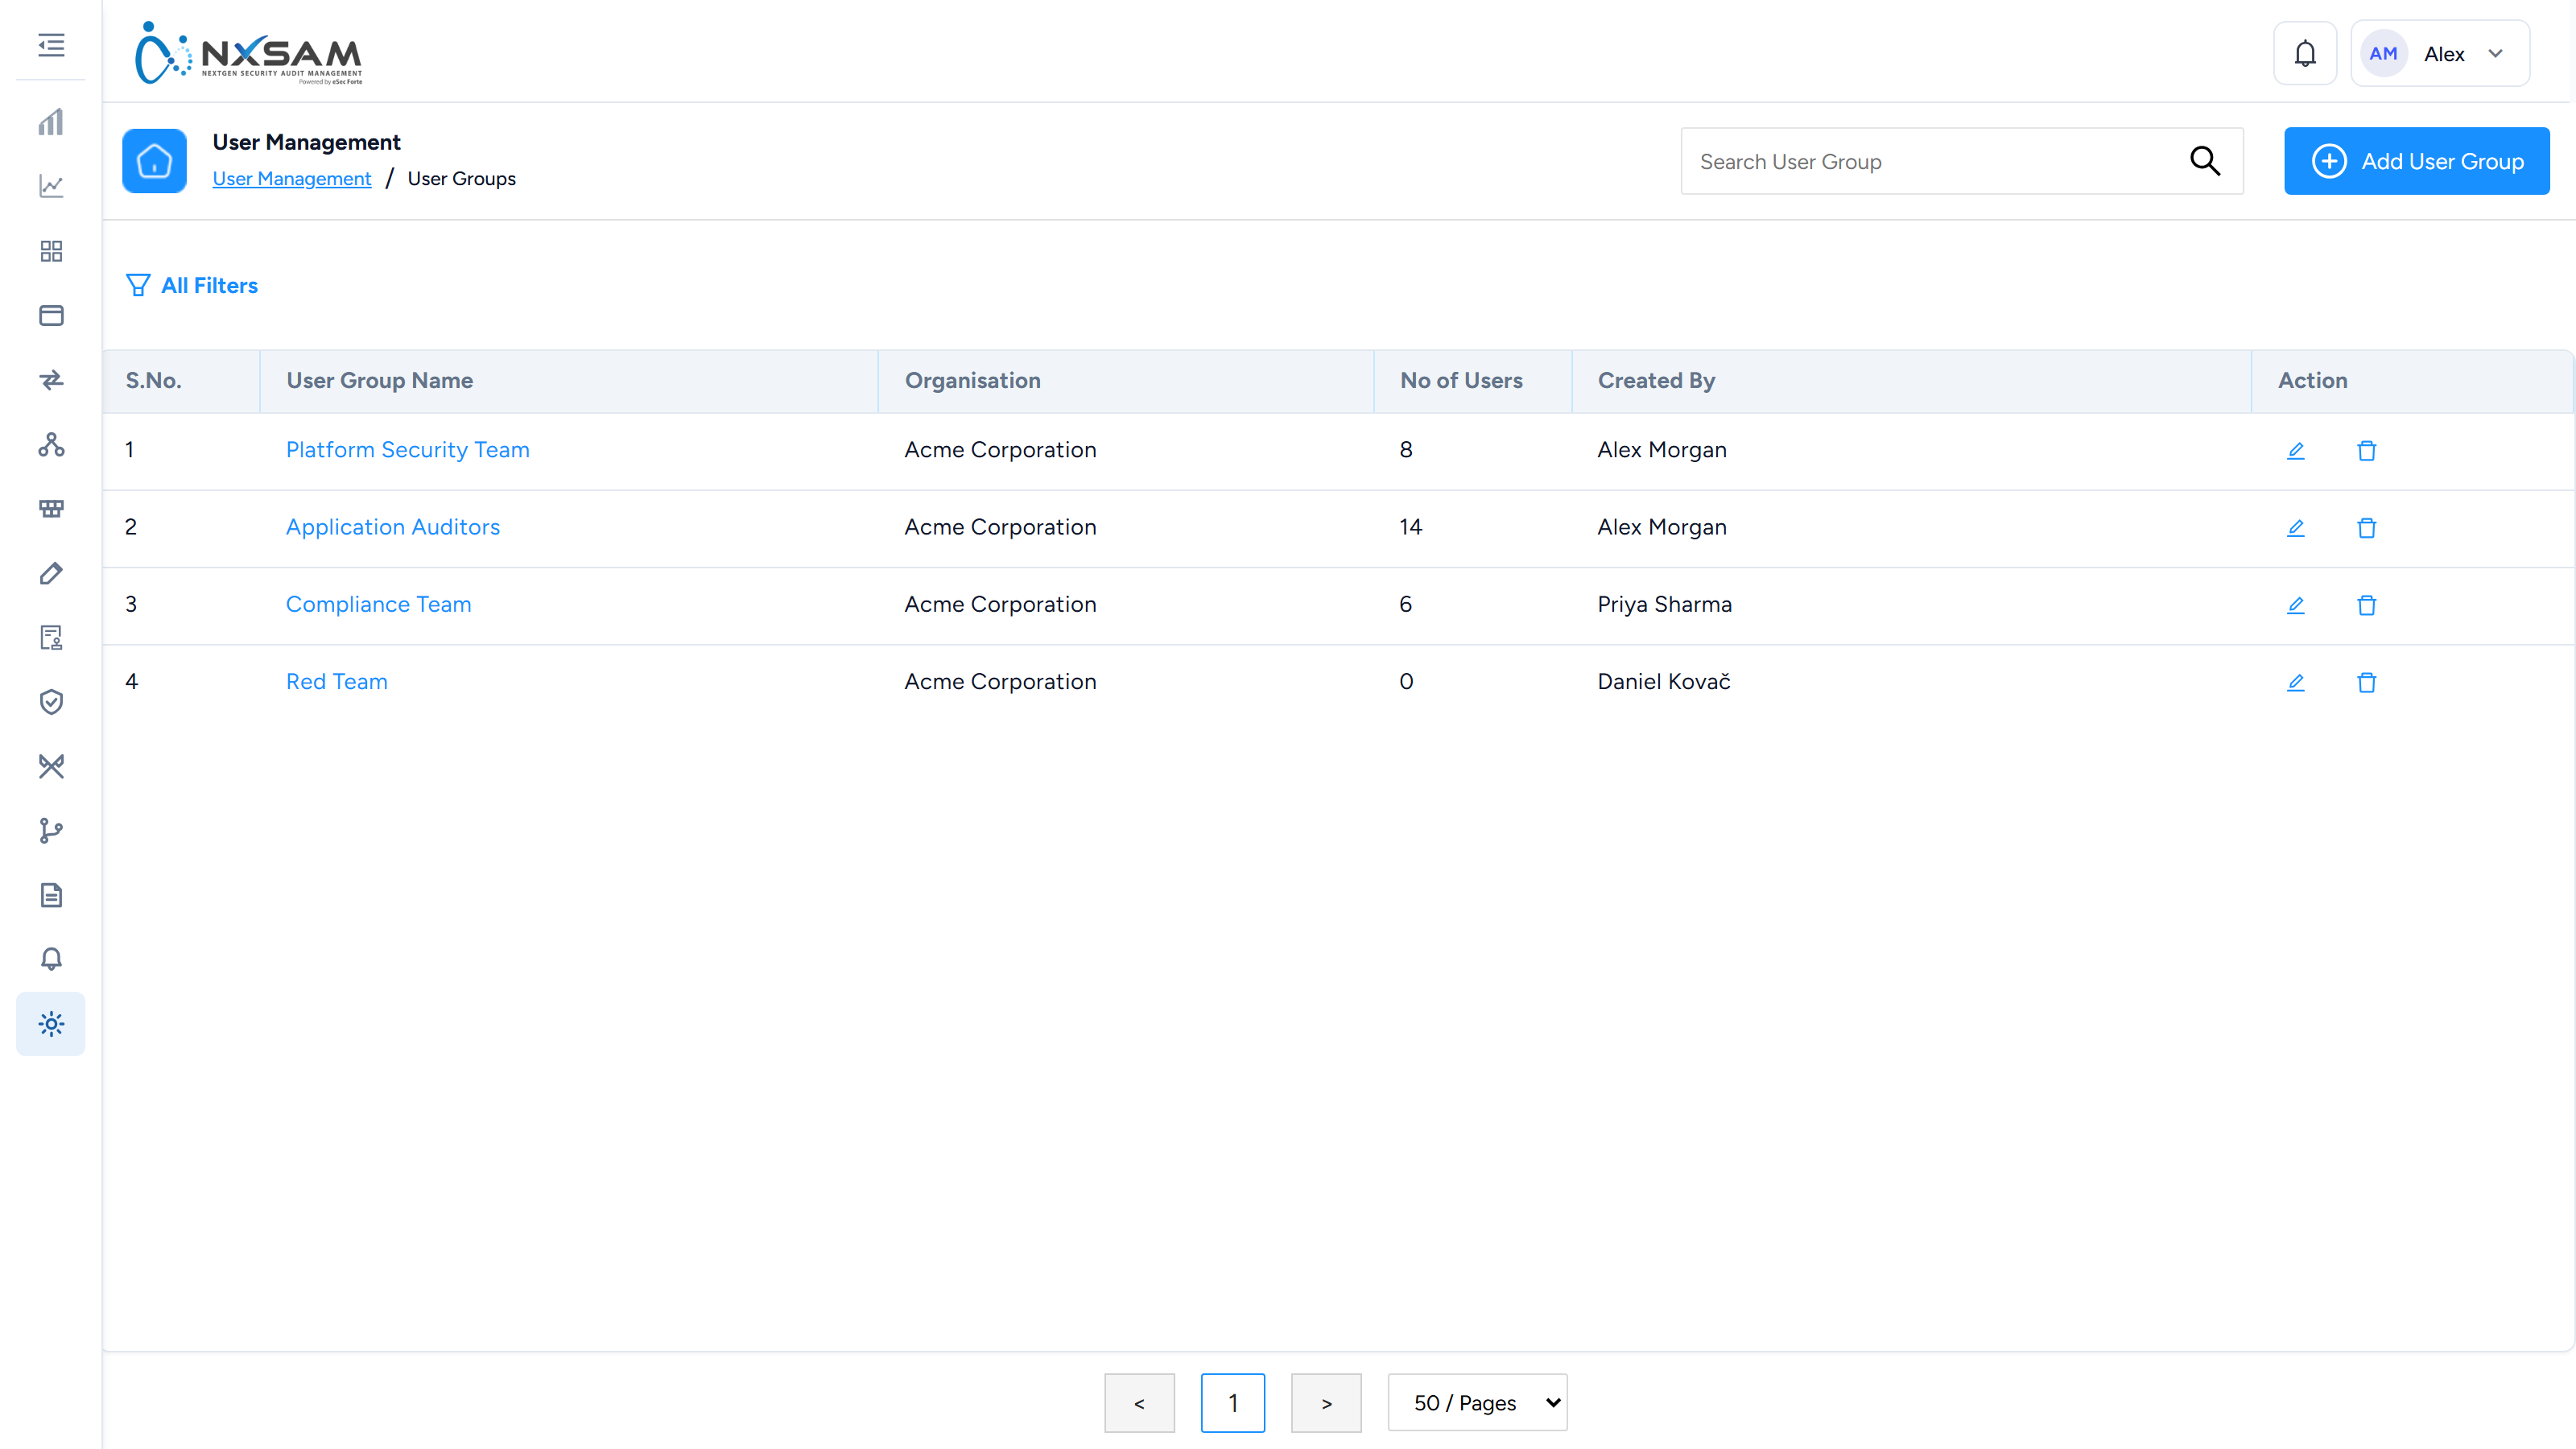
User Levels
Seniority tiers used in approval chains and escalation.
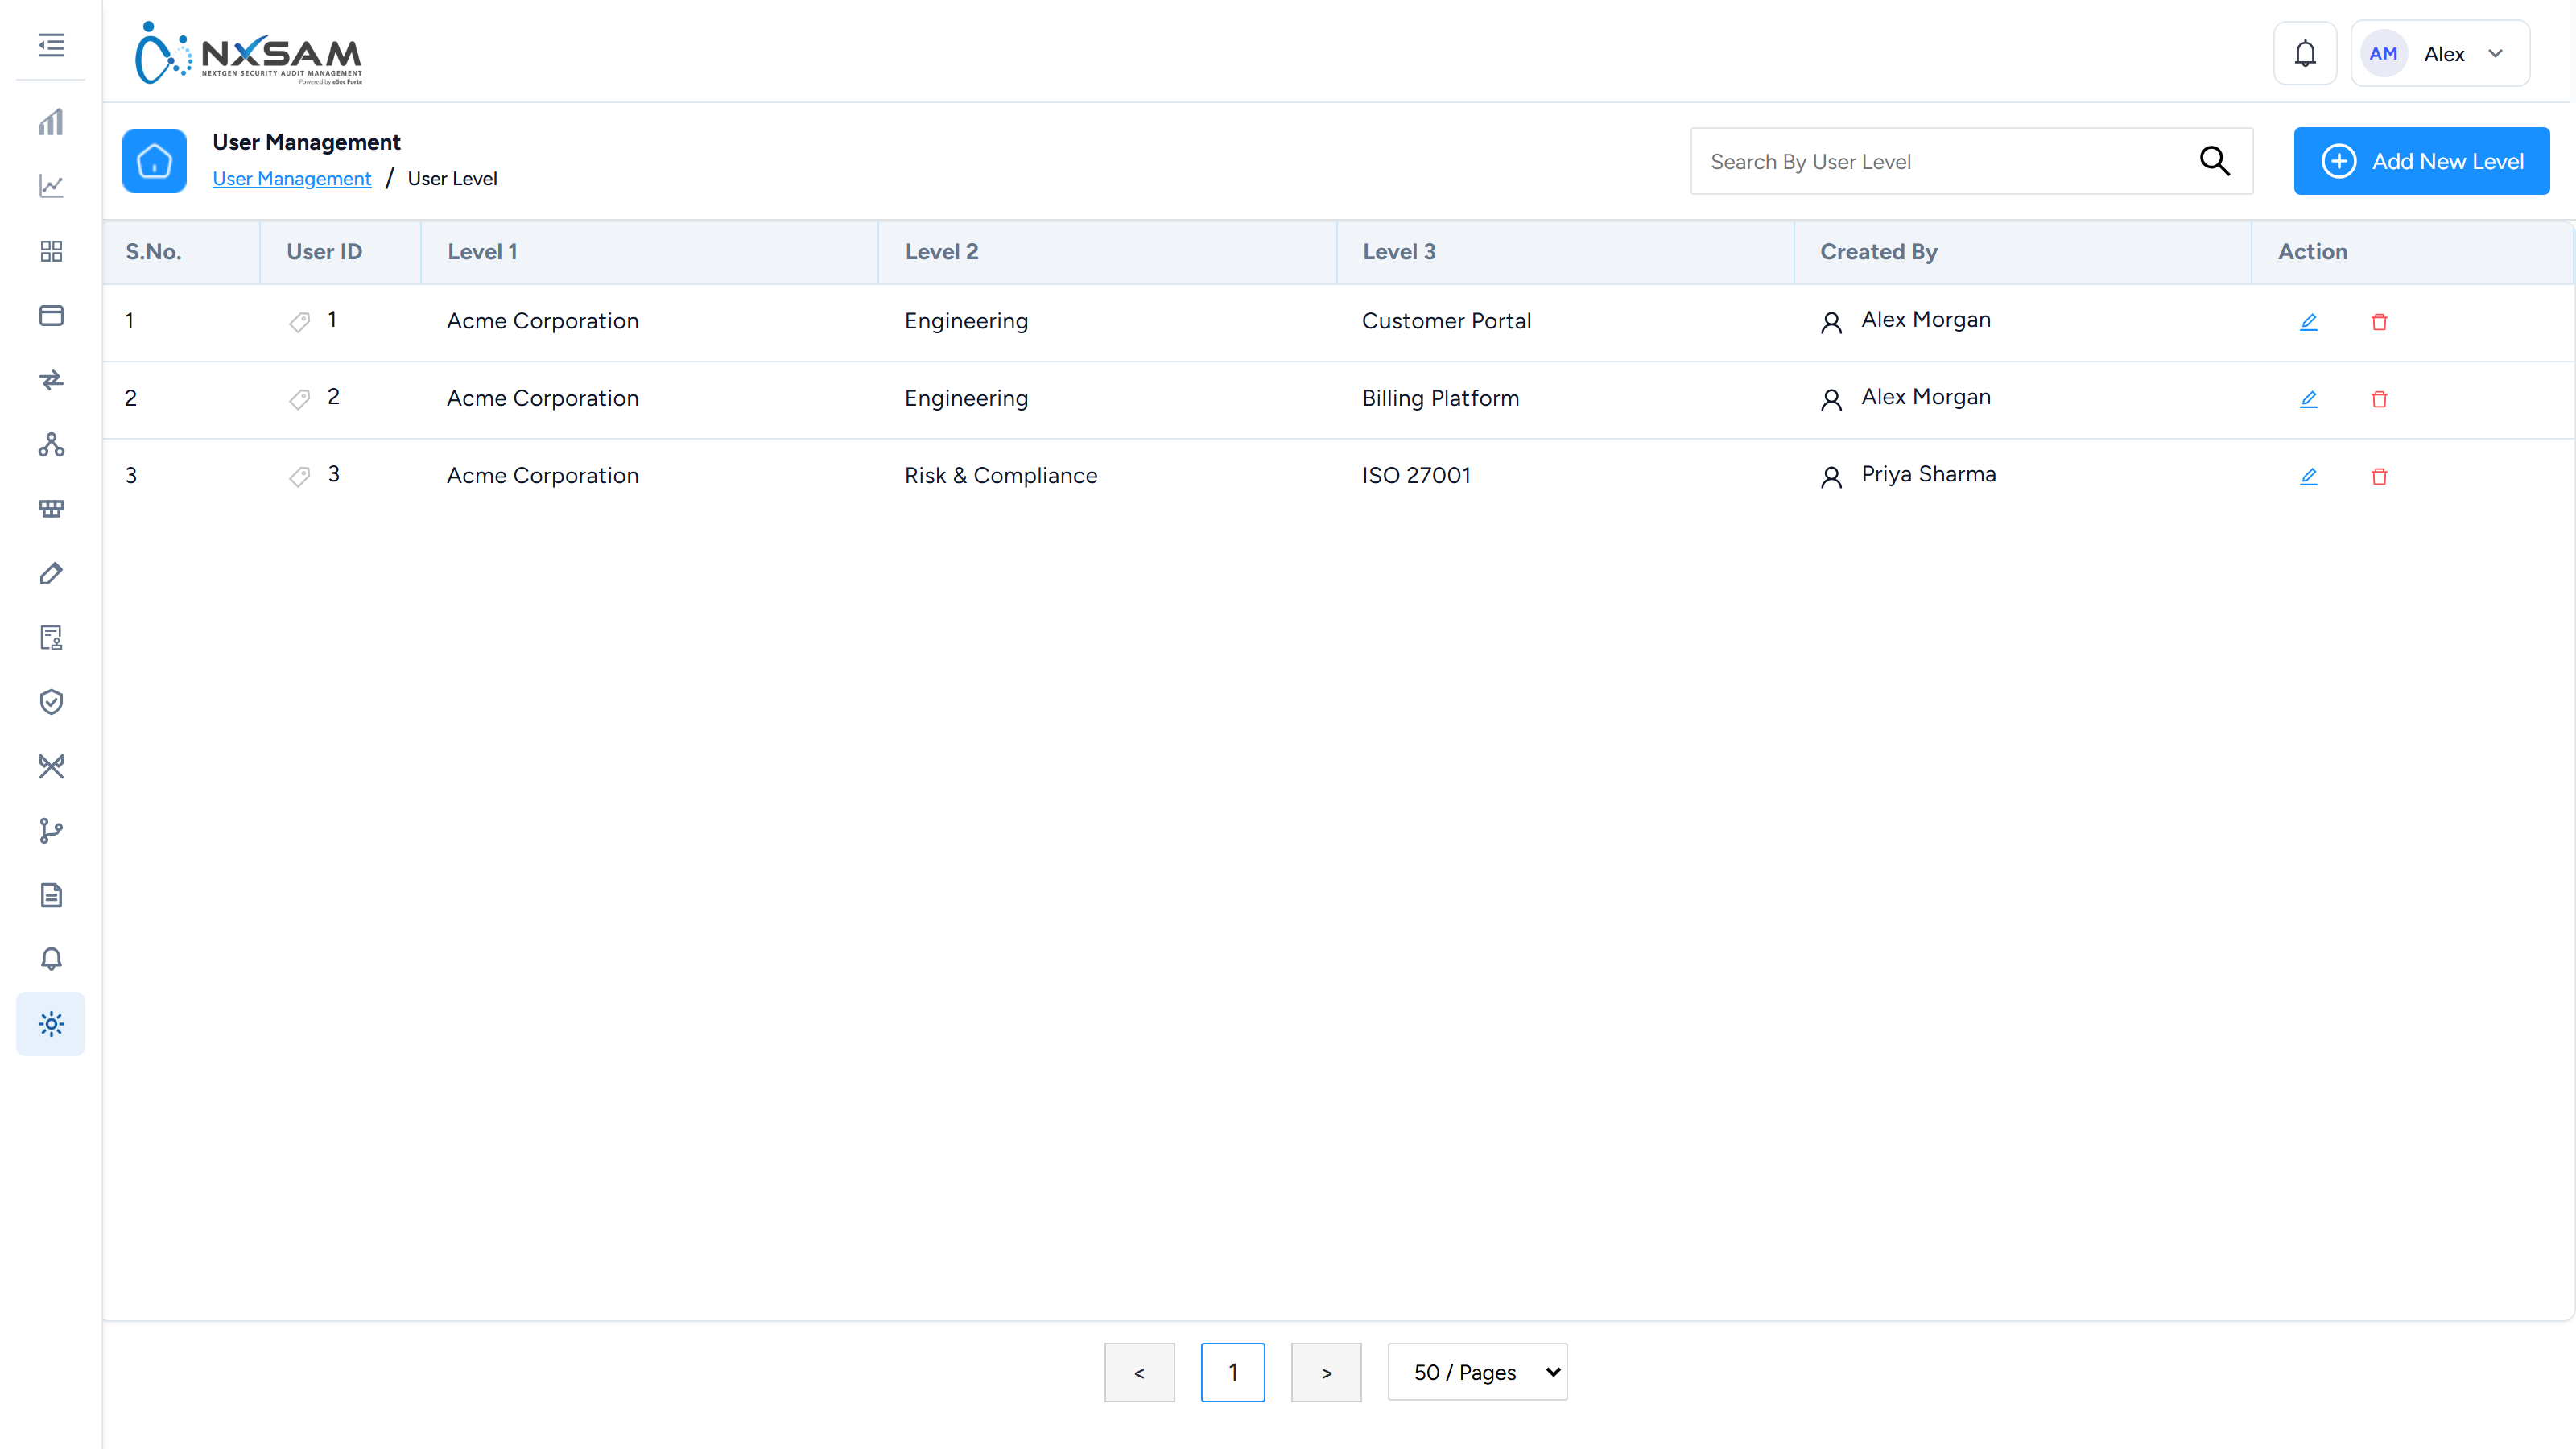
Users
User accounts, their roles and when they last signed in.
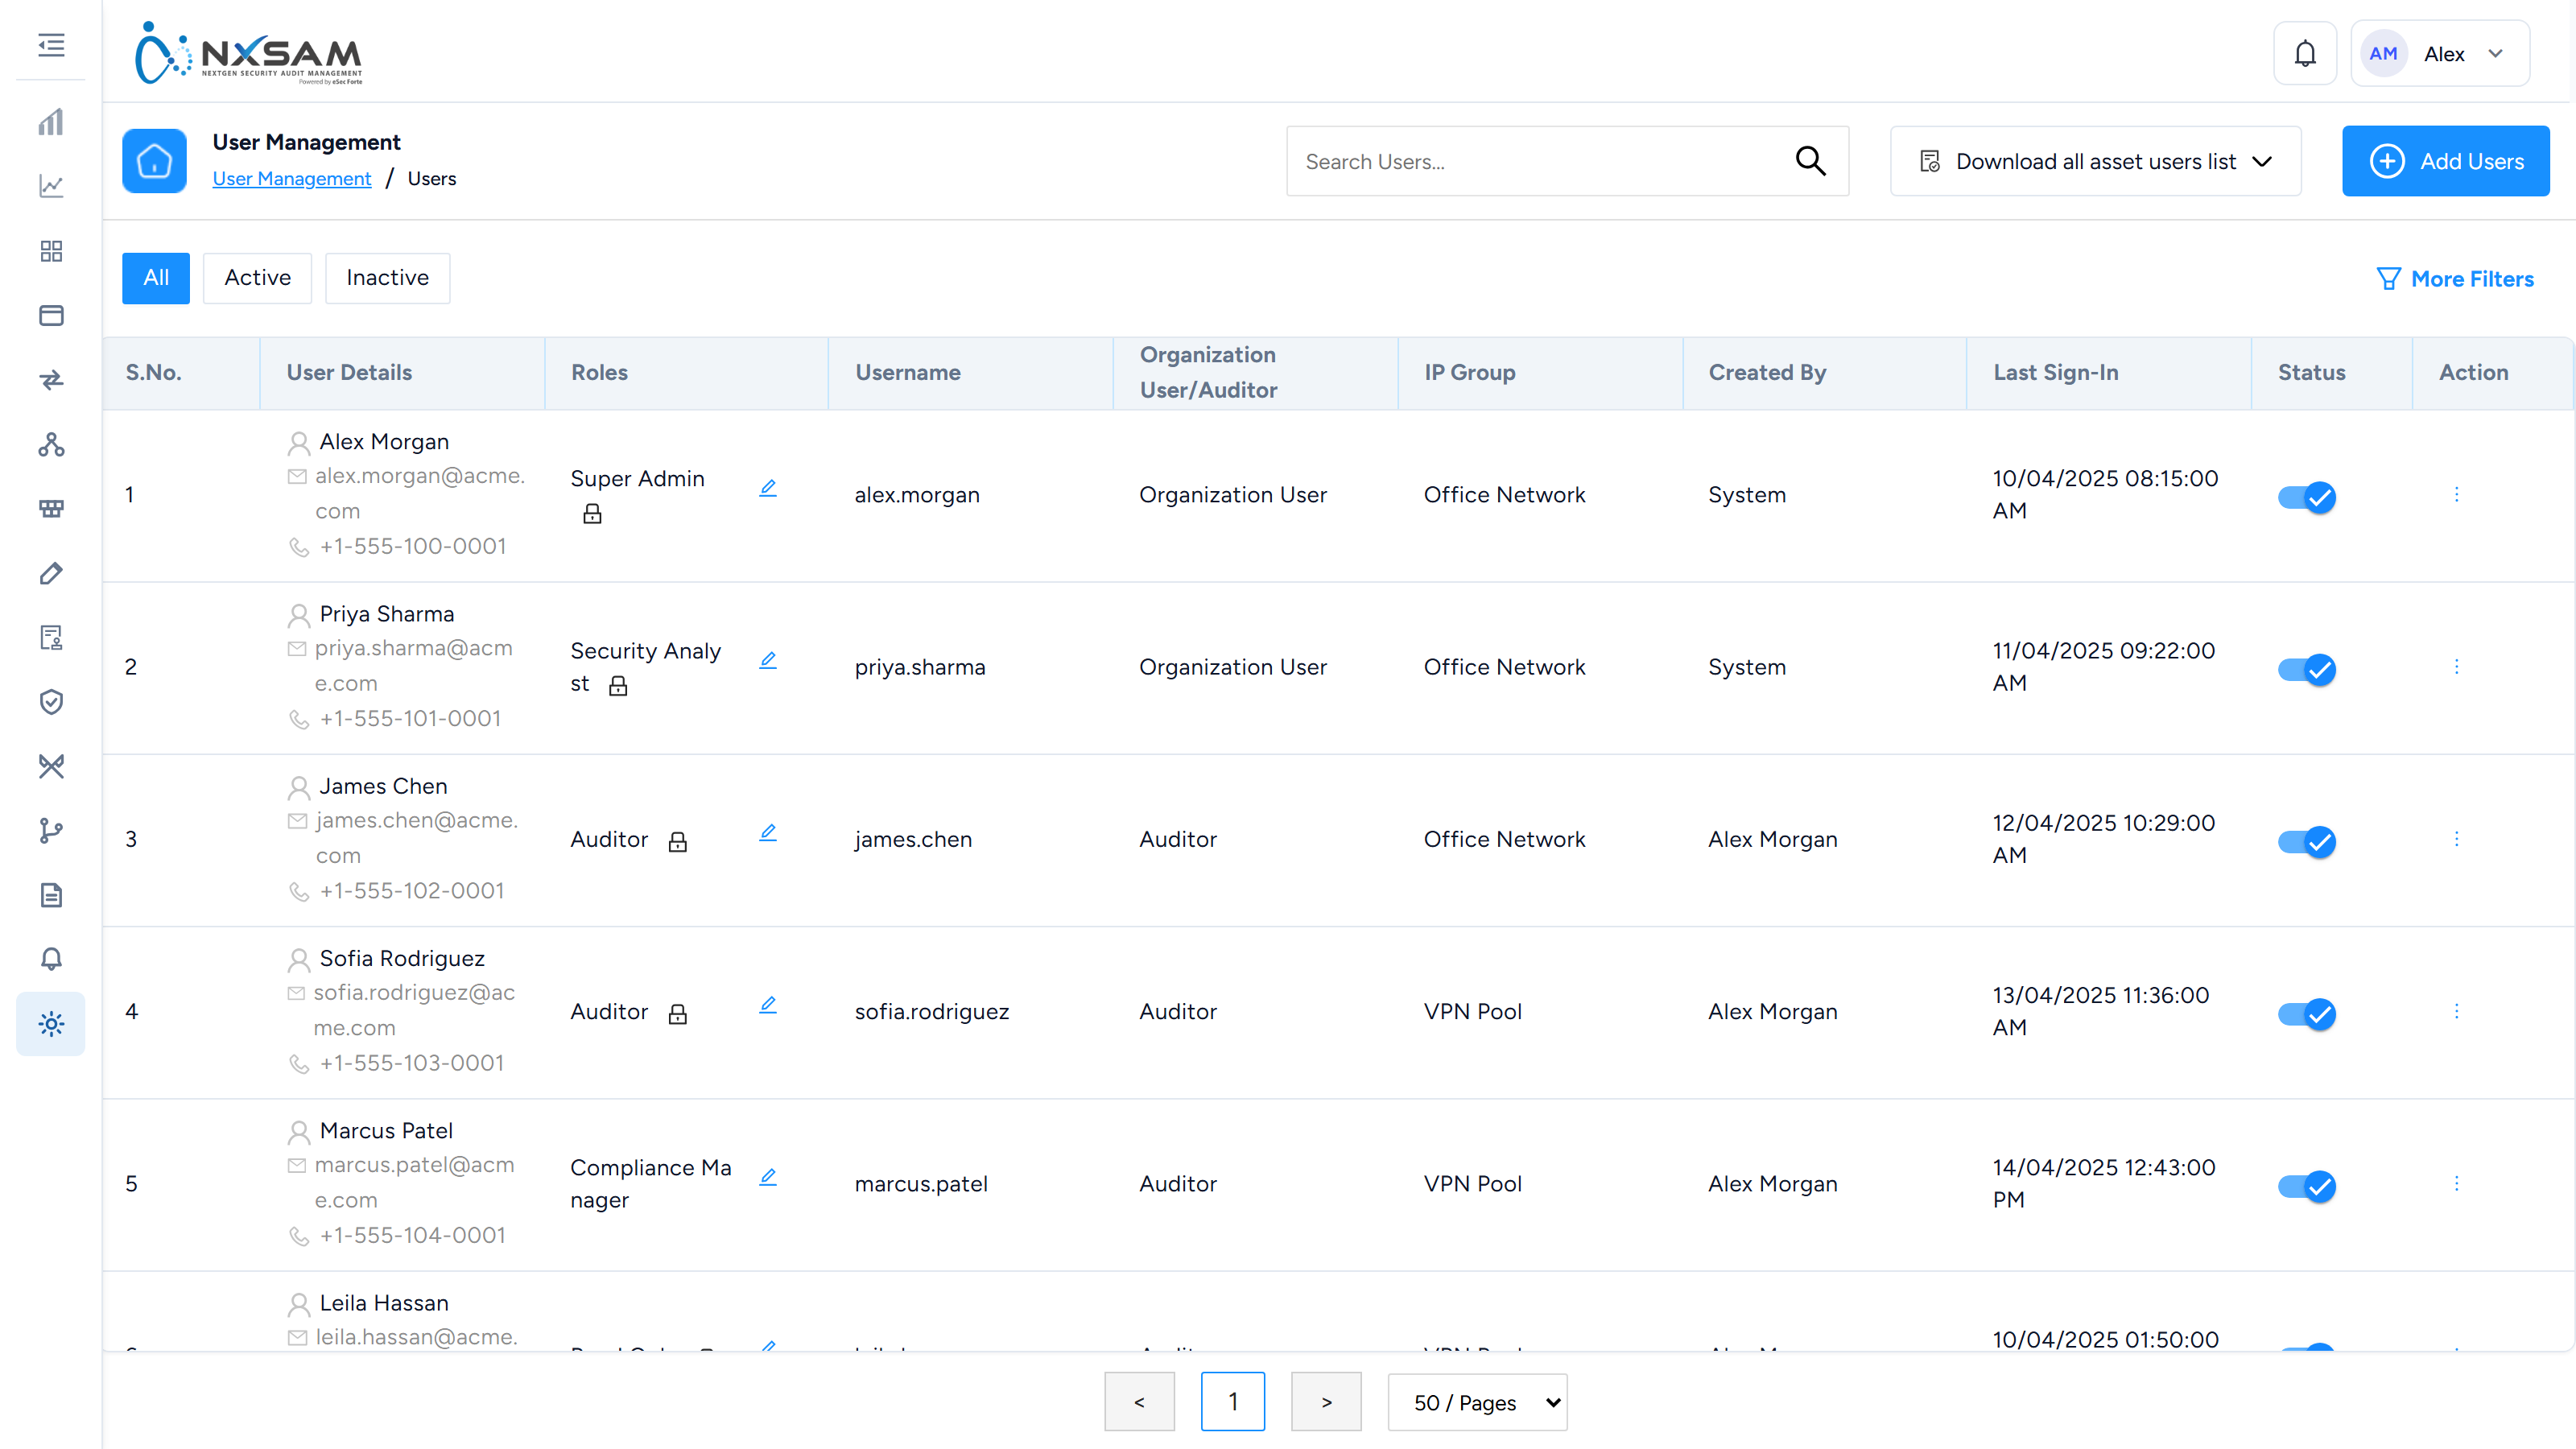
Administration: support reference
Internal. The customer-facing explanation is in the screen reference.
Access problems account for most administration tickets, and they present as product faults rather than as permissions — which is the first thing to rule out.
A missing control is a permission, not a defect
The product hides what a role cannot use rather than disabling it. A caller saying "the button isn't there" is describing their role in almost every case.
Ask them to read out the row menu they can see and compare it with the role. Do not investigate a missing action as a rendering fault until the role is ruled out.
Roles, levels and groups are three different things
| Concept | Decides |
|---|---|
| Role | Which permissions the account holds |
| User Level | Seniority in approval chains — three independent tiers, not a ladder |
| User Group | Which collection of users someone belongs to |
A user can hold a different level in each of the three tiers; that is how an organisation models someone senior in one domain and junior in another. Expecting a single rank explains several "the approval went to the wrong person" tickets.
Auditor is a flag, not a role
An account not flagged as User/Auditor cannot be assigned to an audit, however its role is configured. "Why can't I select this person" is nearly always this.
Directory-backed accounts
An account created against Active Directory requires a Directory, because the same username can exist in more than one. The wrong choice produces an account that looks correct in the list and fails at sign-in with an invalid-credentials message — indistinguishable from a wrong password.
Correcting it is an edit rather than a re-create.
Ownership is visibility
Asset ownership is edited from the user, not from each asset. When someone leaves, their ownership must move or nobody receives notifications for those assets — the assets do not become unowned in a way anything reports.
Download all users with assets is the access-review export: every user with everything they can reach. Nothing else in the product produces it, and it is what an auditor asks for.
IP restriction
Sign-in can be limited to an address range per user. Remarks is where the justification goes — "site VPN egress", "vendor jump host". An entry without one cannot be reviewed later, because an address alone says nothing about why it was permitted.
A user who can sign in from the office and not from home is usually here rather than in their credentials.
Bulk updates
CSV upload applies changes in bulk and produces a log file with the per-row outcome. A bulk update that "partly worked" is answered by that log rather than by comparing lists by hand.
Audit properties are mapped per asset type and audit type
A property meaningful for a web DAST audit need not exist on a network VA. Mandatory blocks audit creation until filled — which is the usual reason an audit that used to save now will not, after someone added a required property.
Master status tables
The RLCM status masters are administered here, and their flags are enforced at save time: comment required, auditor required, evidence required, closed type, and is exception.
Two of these change reporting rather than behaviour:
- Closed Type decides whether something stops counting as open.
- Is Exception separates an agreed exception from a resolution.
A deployment whose counts do not match the documentation has usually edited these, and they are configuration rather than a fixed rule.
What to collect before escalating
- The username and their roles, quoted from the Users screen rather than described.
- The user's three levels, for approval-routing questions.
- Whether the account is directory-backed, and against which directory.
- For missing controls: what the caller can see, listed.
- For bulk updates: the log file from the queue, not a summary of it.
System & Health
System & Health
These screens are for keeping NxSAM itself healthy. They are administrative rather than security-facing, and most organisations look at them only when investigating a problem.
Health Check
Health Check compares what NxSAM holds against what it should hold — reconciling imported data against its source, and flagging discrepancies.
It answers the question that matters most about any consolidation platform: are we confident nothing was lost on the way in? If a scan reported 1,200 findings and NxSAM shows 1,150, health check is where that gap surfaces rather than going unnoticed.
Worth running after any large import, and after changing how findings are matched or classified.
Server Status and Process Manager
Server Status shows whether the platform's components are running. Process Manager shows background work — imports, report generation, synchronisation.
Most long-running work in NxSAM happens in the background: a report is queued rather than produced instantly, and a large import is processed over time. When something "hasn't happened yet", these screens show whether it is queued, running, or failed.
Queued is not failed
A report or import that has not appeared may simply be waiting behind other work. Check whether it is queued before treating it as an error.
Warehouse Sync
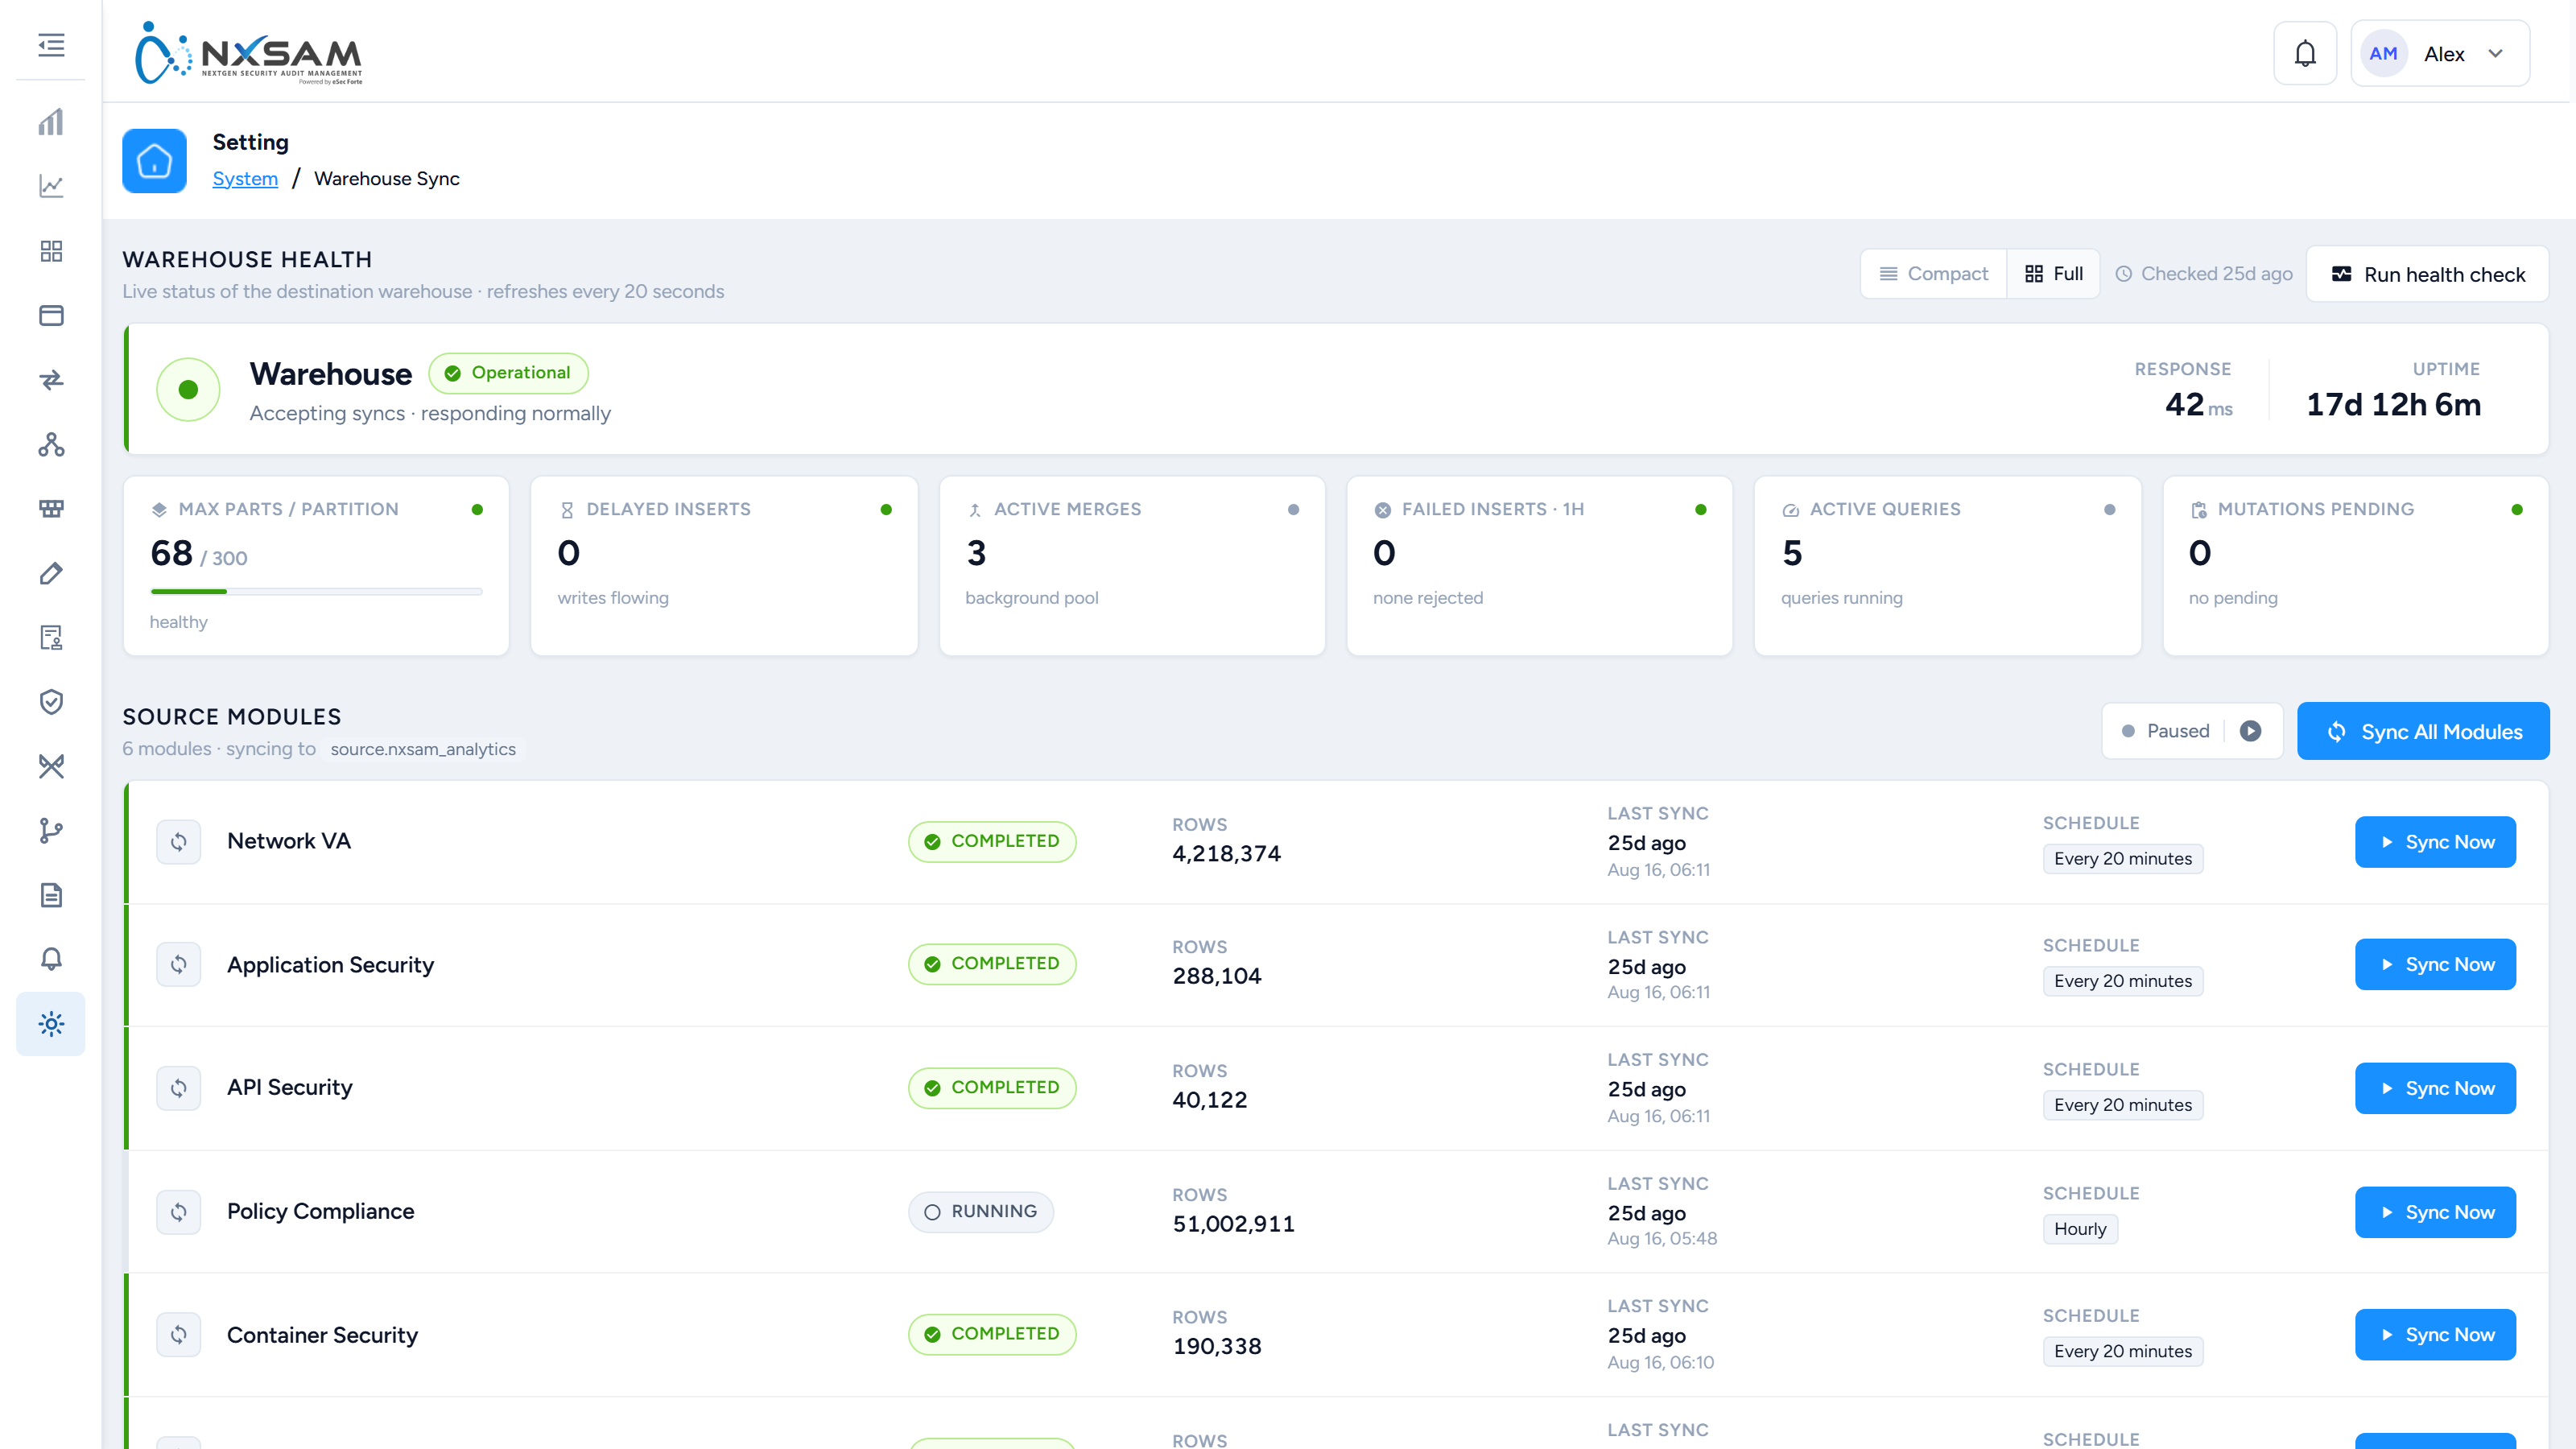
Where analytics are served from a separate reporting store, this screen shows the synchronisation between the live database and that store.
This is the usual explanation for analytics figures lagging the module screens: the module reads live data, analytics reads the synchronised copy. A gap between them is a sync timing question, not a data integrity one.
Licence
Shows your licence and its limits. Worth checking before a large onboarding — asset limits are enforced, and discovering the ceiling midway through a bulk import is avoidable.
AI configuration
Where an administrator connects the platform's AI service and decides what it may be used for. Today that is one thing: reading the evidence uploaded against a compliance or third-party control and suggesting a finding to the auditor, with a confidence score.
The screen holds the provider and credential, the model, how often analysis runs, a spending cap per audit, and which modules it is switched on for. A second screen, AI Queue Details, lists the analysis runs and lets one be re-run.
Two points worth knowing before switching it on:
- Nothing is written by it. The auditor still answers every control. The evaluation appears beside the evidence as a suggestion and is not counted anywhere.
- The cap is a hard stop. Analysis pauses for an audit once its spend reaches the cap, and the remaining controls stay pending until the cap is raised. A cap set low to be safe therefore looks, from the assessment, like analysis that never finishes.
When to look here
| Symptom | Screen |
|---|---|
| An import seems incomplete | Health Check |
| A report never arrived | Process Manager |
| Analytics disagree with a module | Warehouse Sync |
| Something is broadly not working | Server Status |
| Cannot add more assets | Licence |
Tune the risk scoring rules
Setting → System → Analytics Risk Scoring holds the rules behind the Security Health Map and the Pending Risk Matrix. Every open finding is scored Likelihood × Impact, and this screen defines both axes, how remediation is graded, and where the charts draw their lines.
Nothing here is hard-coded. If the ranking does not match how your organisation actually prioritises work, this screen is where that is fixed — not a support request.
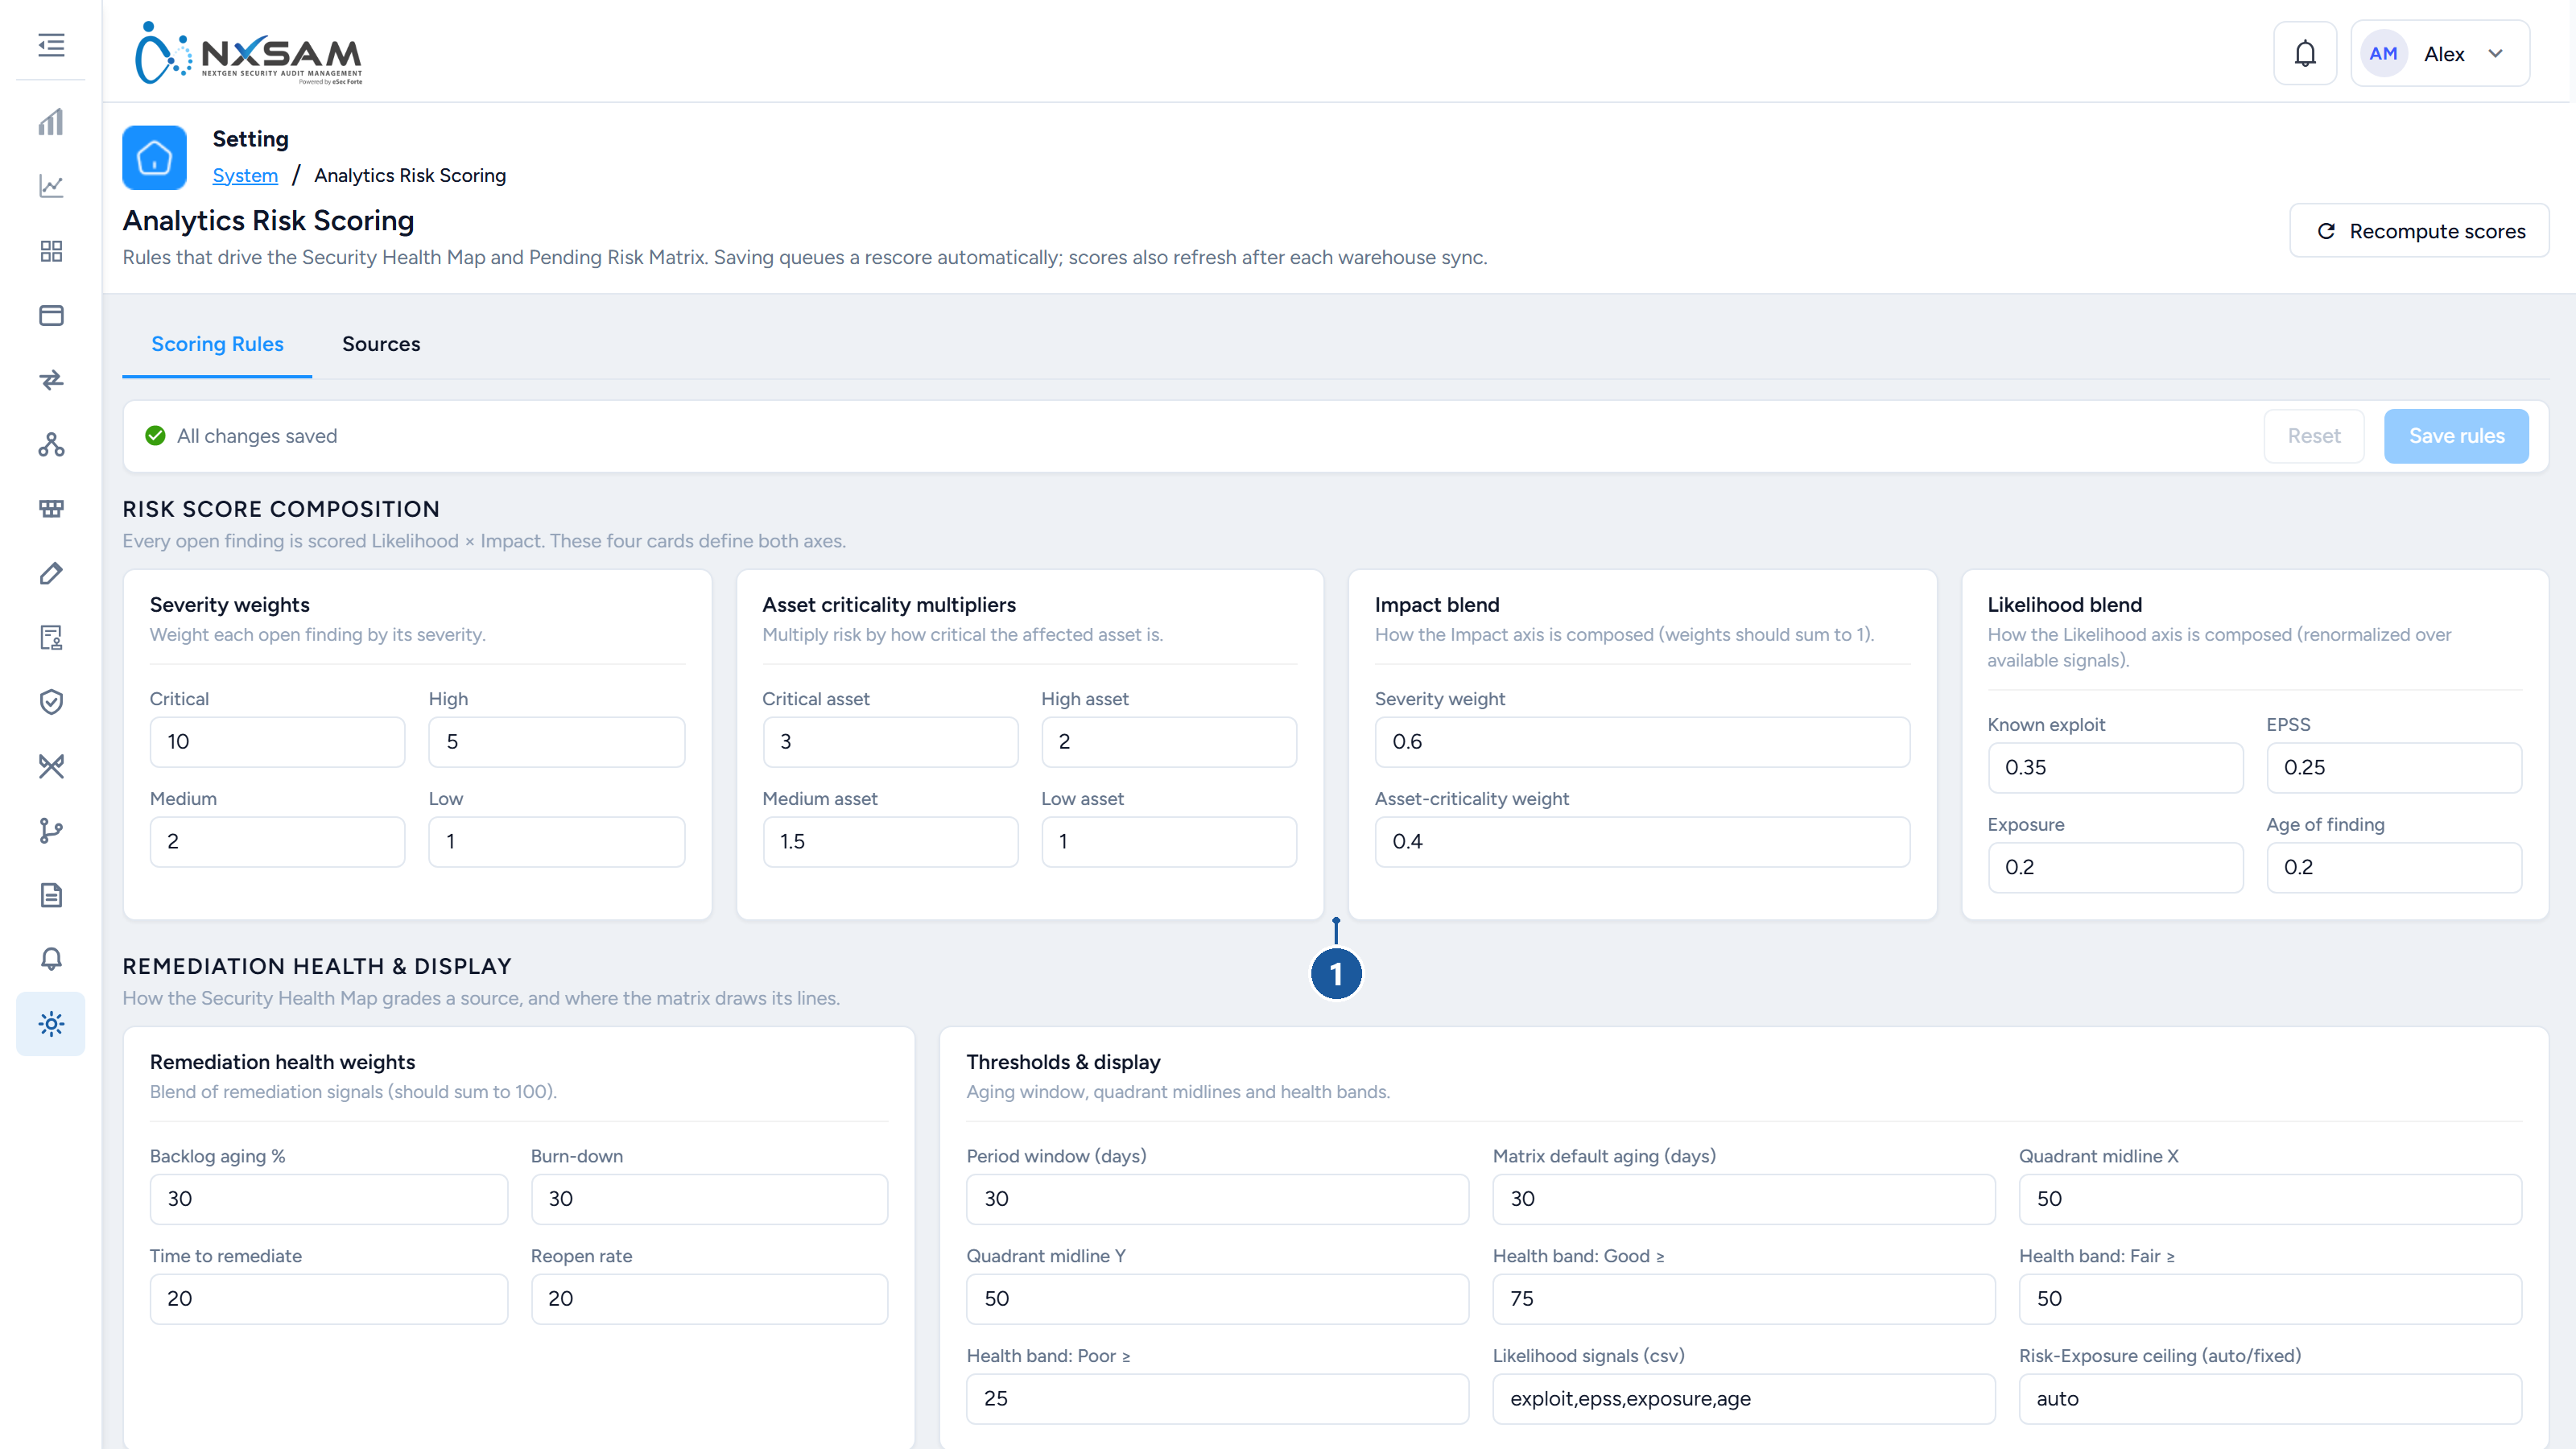
1 Likelihood × Impact — the two axes of the risk score
How the score is built
Four cards define the two axes.
Impact
Impact blends two things, and you choose the balance:
| Card | What it sets | Default |
|---|---|---|
| Severity weights | What each severity contributes | Critical 10 · High 5 · Medium 2 · Low 1 |
| Asset criticality multipliers | How much the affected asset's criticality multiplies the risk | Critical 3 · High 2 · Medium 1.5 · Low 1 |
| Impact blend | The split between the two above | Severity 0.6 · Asset criticality 0.4 |
The blend weights should sum to 1. Shift it toward asset criticality and a medium finding on a crown-jewel system outranks a high finding on a sandbox — which is usually what people mean when they say the ranking "does not reflect reality".
Asset criticality has to be set for this to mean anything
If criticality is unset across the estate, every multiplier is the same and the Impact axis collapses to severity with extra steps. The scoring rules are not the fix for that; populating asset criticality is.
Likelihood
Likelihood blend distributes weight across four signals — defaults in brackets:
- Known exploit (0.35) — a public exploit exists for this vulnerability
- EPSS (0.25) — the published probability of exploitation in the wild
- Exposure (0.20) — how reachable the affected asset is
- Age of finding (0.20) — how long it has been open
The weights are renormalised over whichever signals are available, which matters more than it sounds. A finding with no EPSS score does not silently score lower; its remaining signals are rescaled to fill the gap. That is why a mixed estate, where only some sources carry exploit data, still ranks sensibly.
Likelihood signals on the Thresholds card names which signals participate at all, comma separated. Removing one there is different from setting its weight to zero: a removed signal is excluded from the renormalisation entirely.
Remediation health
The Security Health Map grades each source on how well findings are actually being closed, not just how many exist. Remediation health weights blends four signals and should sum to 100 — defaults are 30 / 30 / 20 / 20:
| Signal | What it measures |
|---|---|
| Backlog aging % | How much of the open backlog is old |
| Burn-down | Whether the backlog is shrinking |
| Time to remediate | How long closure takes |
| Reopen rate | How often a closed finding comes back |
Reopen rate is the one worth raising if closures are being recorded optimistically: a team that closes quickly and reopens constantly scores well on the first three and badly on the fourth.
Thresholds and display
These do not change any score. They change where the charts draw their lines, which changes what people conclude from the same numbers.
| Setting | Effect | Default |
|---|---|---|
| Period window (days) | The window burn-down and time-to-remediate are measured over | 30 |
| Matrix default aging (days) | The ageing cut the Pending Risk Matrix opens on | 30 |
| Quadrant midline X / Y | Where the matrix splits into quadrants | 50 / 50 |
| Health band: Good ≥ | The score at or above which a source is Good | 75 |
| Health band: Fair ≥ | Fair | 50 |
| Health band: Poor ≥ | Poor; below this is the worst band | 25 |
| Risk-Exposure ceiling | auto scales the exposure axis to your data; fixed pins it |
auto |
Moving a midline moves sources between quadrants
Nothing was rescored, but a source that was in the acceptable quadrant yesterday can be in the attention quadrant today. If the health map changes character overnight and no data changed, this screen is the first place to look.
Sources: what gets scored, and by which rules
The Sources tab lists every scanner and tool discovered in your data.
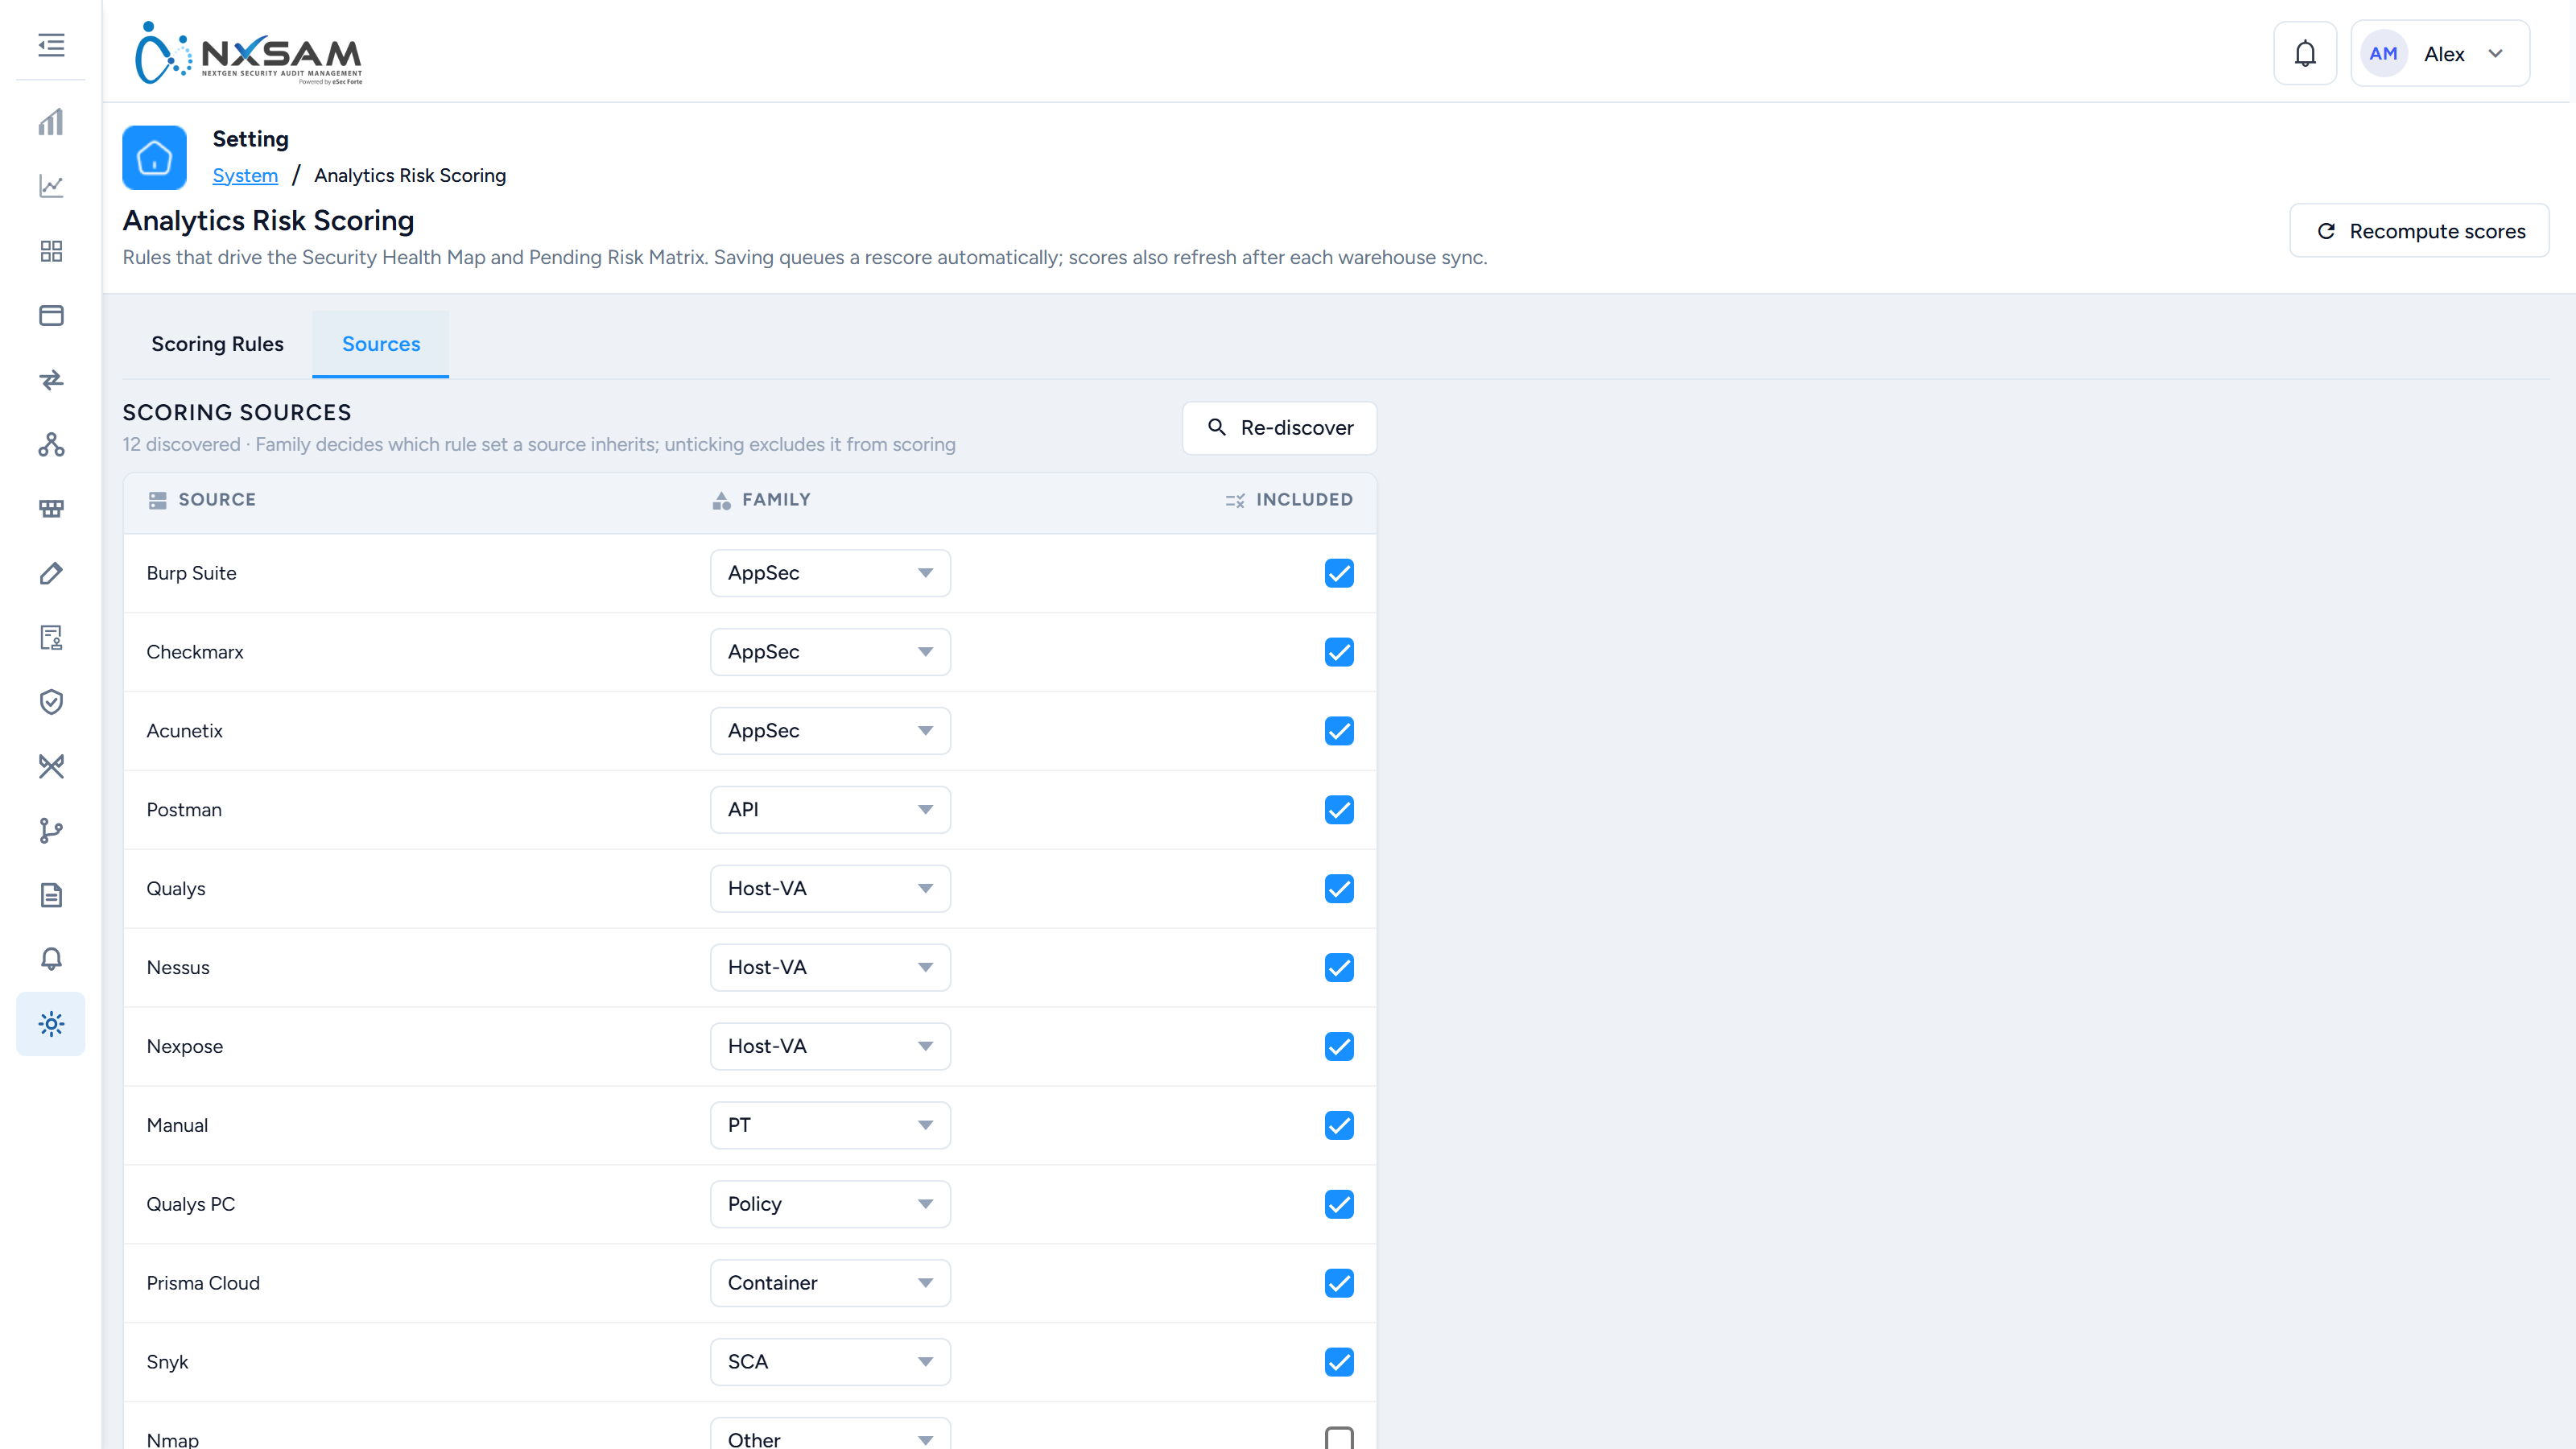
Each row has two controls:
- Family decides which rule set the source inherits: AppSec, Host-VA, PT, Policy, SCA, API, Container or Other. Families are assigned automatically from the shape of the data, and the assignment is a starting point rather than a verdict — change it where you disagree.
- Included takes the source out of scoring entirely when unticked. Use it for a tool whose findings are informational, or one being trialled, so it stops distorting the health map without anyone having to delete its data.
Re-discover rescans for sources that have appeared since. A tool integrated last week will not be scored until it has been discovered.
Saving, and when the numbers change
The bar above the rules shows either All changes saved or a count of unsaved changes, and each changed field is marked while you edit. Reset discards them; Save rules commits.
Saving queues a rescore automatically — you do not have to trigger one. Scores also refresh after each warehouse sync. Recompute scores rebuilds every score without changing a rule, which is what you want after correcting asset criticality or importing a backlog of findings.
A rescore is not instant on a large estate. If one is already running, a second request is told so rather than queueing behind it.
If the screen says no rules were found
The default rule set has not been seeded in that environment. The screen is doing the right thing by saying so rather than showing every input at zero, which would read as a configuration where nothing counts. Raise it with whoever provisions the environment.
System & Health: every screen, column and action
These screens are how you tell whether the platform itself is working, and they are the first place to look when a symptom spans several modules.
Process Manager
Actions: Logs, Restart, Stop.
Background work — imports, report generation, synchronisation, outbound email — runs as processes here. Logs is where a failure explains itself; Restart brings back a worker that has died; Stop halts one that is misbehaving.
Restart is not free
A worker restarted mid-message leaves that job in IN PROGRESS with nothing consuming
it — the job neither completes nor retries. Prefer letting a job finish where you can,
and check what is running before restarting.
Import
Import Type, Import Status, Log, Created At, Summary, with a child-process view
of the same columns.
The child view matters for large imports: one import spawns several processes, and the parent completing does not mean every child did. An import reporting success with fewer rows than expected usually has a child that failed, visible only here.
Health Check
The widest diagnostic in the product, and the one that answers "did we lose anything on the way in":
| Column | What it holds |
|---|---|
| Baseline | What the source reported |
| Current | What NxSAM holds now |
| New | Present now, absent from the baseline |
| Fixed | In the baseline, resolved since |
| Repeated | Seen in both |
| Re-open | Closed previously, present again |
| Total | The reconciliation total |
| Type | What kind of assessment produced the row |
| Match Key | The field used to decide two findings are the same |
| Classification | How the comparison classified the row |
| Severity, Status, Sub Status, SLA Expiry | The finding's own values |
| Issues | The findings behind the number |
Match Key is the field to check when a comparison looks wrong
Everything on this screen depends on how two findings are decided to be the same one. If New and Fixed are both unexpectedly high while Repeated is near zero, the match key is not matching — findings are being seen as fixed and new rather than as the same finding twice.
That is a matching-configuration problem, not a data-loss one, and the numbers look alarming in exactly the way real data loss would.
Re-open distinguishes a finding that came back from one that never left. A high re-open count against a specific asset usually means a fix that does not survive a rebuild or a redeploy.
Beats — scheduled jobs
Module, Sub Module, Last Sync Status, Last Sync Type, Last Sync Initiated At,
Last Sync Processed At, and per-run Sync Sub Module, Sync Type, Sync Status,
Sync Initiated At.
These are the periodic jobs that keep derived data current — recalculating SLA states as dates pass, refreshing pre-computed statistics.
Initiated At against Processed At is the useful pair. A job initiated and never processed is stuck; one where the gap is growing run on run is falling behind, and the figures it maintains are increasingly stale.
Figures wrong by a fixed interval rather than randomly are almost always a beat that stopped. Nothing else in the product reports an error for it.
Active Directory
Sign-in can be delegated to Active Directory, and more than one directory can be configured. Each is held as a named account and the screen lists them as cards rather than as a single form.
Pick an account from Select Account, then Configure. An account with nothing configured shows an empty state rather than a blank form — which is the difference between "not set up" and "set up and broken".
| Field | What it holds |
|---|---|
| AD Type | Which directory product and protocol variant |
| Domain | The directory host |
| Port | 389 for LDAP, 636 for secure LDAP — the form states both defaults |
| User Name Prefix | The prefix prepended to a username when binding |
| Admin User Name | The service account used to search the directory |
| Users Base DN | Where in the tree user accounts are looked up |
| Certificate | The uploaded certificate — shown only on Secure LDAP directories |
Choosing Secure LDAP is what reveals the certificate upload on the form and the Certificate row on the card. A directory that is supposed to be encrypted and shows no Certificate row is configured as plain LDAP, and its bind traffic is in the clear.
Each card carries Edit; a directory that is not the last remaining one can also be deleted.
User field mapping
The lower half of the form maps directory attributes onto NxSAM's First Name, Last Name, Email, Mobile and Username.
The Username mapping must be the AD login name
The form says so, and it is the one mapping that cannot be corrected later without orphaning accounts. Map it to the attribute users actually sign in with, not to a display name that looks right in a directory browser.
Everything else is cosmetic and can be remapped. This one decides whether a returning user is recognised as themselves.
Test Connection
Test Connection reports Connection Tested Successfully or Connection Failed before you save. A directory that saves but does not bind produces sign-in failures for real users, and it surfaces at their next sign-in rather than at yours.
AD logs
The panel above the accounts shows the last 100 lines of directory activity, with Refresh and Load Logs. It is where a bind failure explains itself — wrong base DN, expired service-account password, an untrusted certificate — and the first place to look when authentication works for some users and not others.
SLA configuration
Severity, Asset Type, SLA Duration, Asset Properties.
SLA duration is set per severity and asset type, and can be narrowed further by asset property — so a Critical on an internet-facing production system can carry a shorter deadline than the same Critical internally.
Changing a duration re-derives expiry dates, which can make a batch of findings overdue with no data change at all.
Asset limits
Client, Web Limit, Mobile Limit, Network Limit, Image Limit, Think Client
Limit.
Licensed ceilings per asset type per client. Worth checking before a large onboarding — discovering the ceiling midway through a bulk import means a partial inventory and a reconciliation afterwards.
Risk score properties
Asset Type, Properties — which asset attributes feed the contextual risk score, per
asset type. An estate with these unset produces a risk score that is severity with extra
steps, and a "top risky assets" list that ranks nothing meaningfully.
Tags
Four tables, one per asset domain: Application, API, Network and Audit
tags. Each carries Tags Id, Tags Name, Created By; audit tags additionally carry
Clients.
Export Tags produces the list. Tags are shared within their domain, so renaming one renames it everywhere it is applied — there is no per-use copy.
System configuration
| Screen | Columns |
|---|---|
| Modules | ID, Module, Created By |
| Controllers | ID, Class, Method, Created By |
| Permissions | ID, Module, Permission, Code, Created By |
| Queries | ID, Query, Task, Status |
| Task info | Info Id, Info Name |
These define what the platform can do and who may do it. Permissions map a code to a module — roles grant those codes, so a permission missing here cannot be granted however the role is configured.
Queries are maintenance operations bound to tasks. They are administrative tooling rather than a working screen, and running one without knowing what it does is not recoverable through the interface.
System settings
The switches that change how the whole platform behaves. Most are described with the module they affect; one is easy to miss because it lives here and bites elsewhere:
Only 1 On-going VA Audit per Asset — when on, a network VA audit cannot be requested for an asset that already has one in progress. The request fails at the point of saving with a message naming the rule. It exists because two concurrent scans of one host produce two sets of findings for one state, and reconciling them afterwards is worse than waiting. Turn it off only where genuinely parallel assessments of one asset are intended.
AI configuration
Two screens. The first is a form; the second is the queue it feeds.
AI Configuration
| Section | What it holds |
|---|---|
| Provider & Credentials | The AI Provider and its API key. The key is stored encrypted and never shown again once saved |
| Evidence Analysis Model | Which model reads the evidence. Larger models read complex evidence better and cost more per run |
| Analysis Schedule Interval | How often queued evidence is analysed — every 15, 30 or 60 minutes |
| Per-Audit Cost Cap ($) | Spending limit per audit. Analysis pauses when spend hits this cap. Negative values are not allowed |
| Evidence Analysis for RLCM | The master switch: let the platform review uploaded audit evidence and suggest compliance findings |
| Apply to Modules | Which assessments it runs for — Compliance, TPRM, or both |
If the AI service is not reachable from this deployment the screen shows AI service not configured and a Retry; nothing below it can be saved until that clears, and the message says to contact the administrator of the deployment rather than of NxSAM.
Set the cost cap from the evidence, not from the budget. A cap is spent by reading files, so an audit with a large evidence pack exhausts a small cap early and its remaining controls stay pending indefinitely. An auditor reporting that "the AI stopped halfway through" has almost always met the cap.
AI Queue Details
Reached from the AI Queue Details button on the configuration screen, which opens it in a new browser tab so the configuration stays where it was.
| Column | What it holds |
|---|---|
| Queue Details | The queue's key and what kind of job it is |
| Status | Where the run is |
| Created At | When it was queued |
| Actions | Re-analyse this queue — runs it again |
Re-analysing is safe to repeat: it reads the same evidence again and replaces the previous evaluation. It also spends against the same cap, so a queue re-analysed to get past a cap will stop in the same place.
Analytics custom charts
Custom chart cards carry Refresh always, and Edit and Delete only on charts you own.
Charts on a shared profile are read-only to everyone but their owner
A dashboard profile shared with you shows its charts with Refresh alone. That is deliberate: a shared profile is one definition seen by many people, so an edit would change what every viewer sees, and a delete would remove it from all of them.
To change a shared chart, ask its owner — or take your own copy of the profile, where the charts become yours to edit.
Refresh re-runs that chart's query alone. Useful when one widget looks stale and the rest of the dashboard is current — which points at that chart's query rather than at the warehouse sync.
System & Health: find the right screen
Every screen in this module, what each one is for, and where it lives. Use it to find the right screen quickly, and to confirm you are on the one a colleague means — several screens in this product have similar names and different jobs.
Screenshots come from a demonstration data set, so the figures are illustrative. Click any screenshot to open it at full resolution.
AI Configuration
Where the platform's AI service is connected and told what it may do — today, reading uploaded compliance evidence and suggesting a finding to the auditor. Provider, model, schedule, a per-audit cost cap, and which modules it is on for.
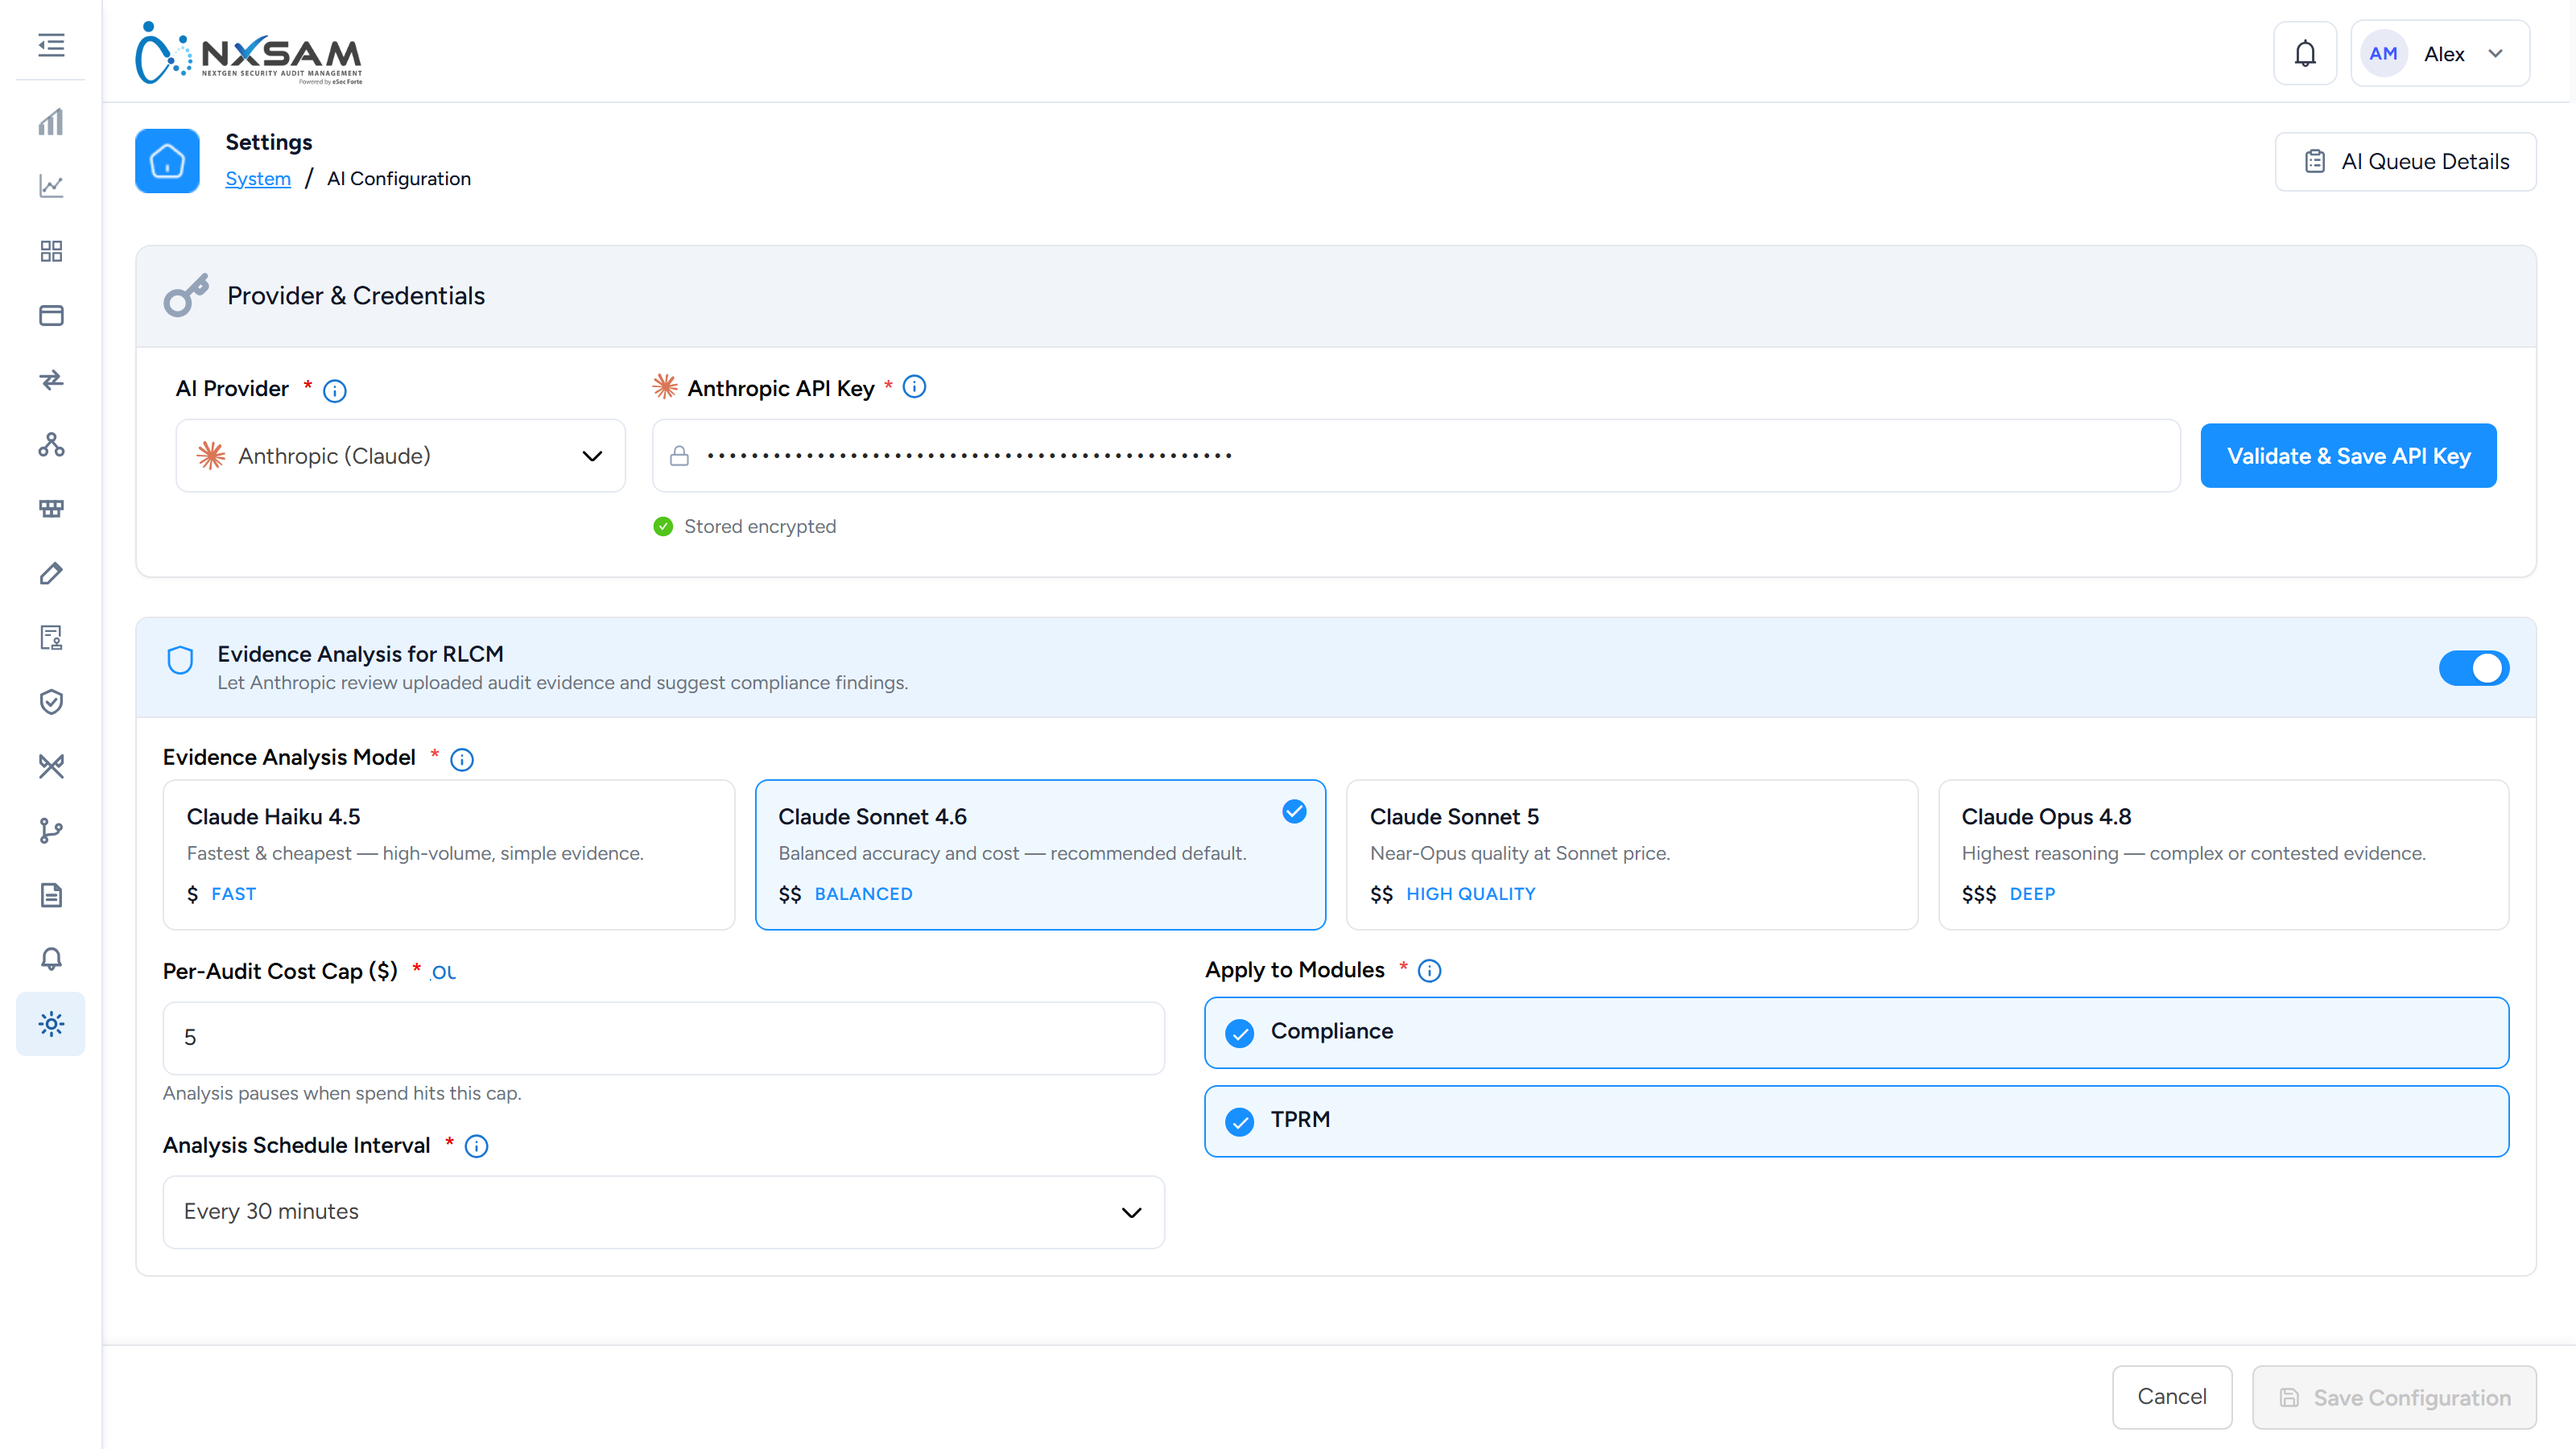
AI Queue Details
Every evidence-analysis run with its status, and a re-analyse action. A run that stays pending has usually met the audit's cost cap.
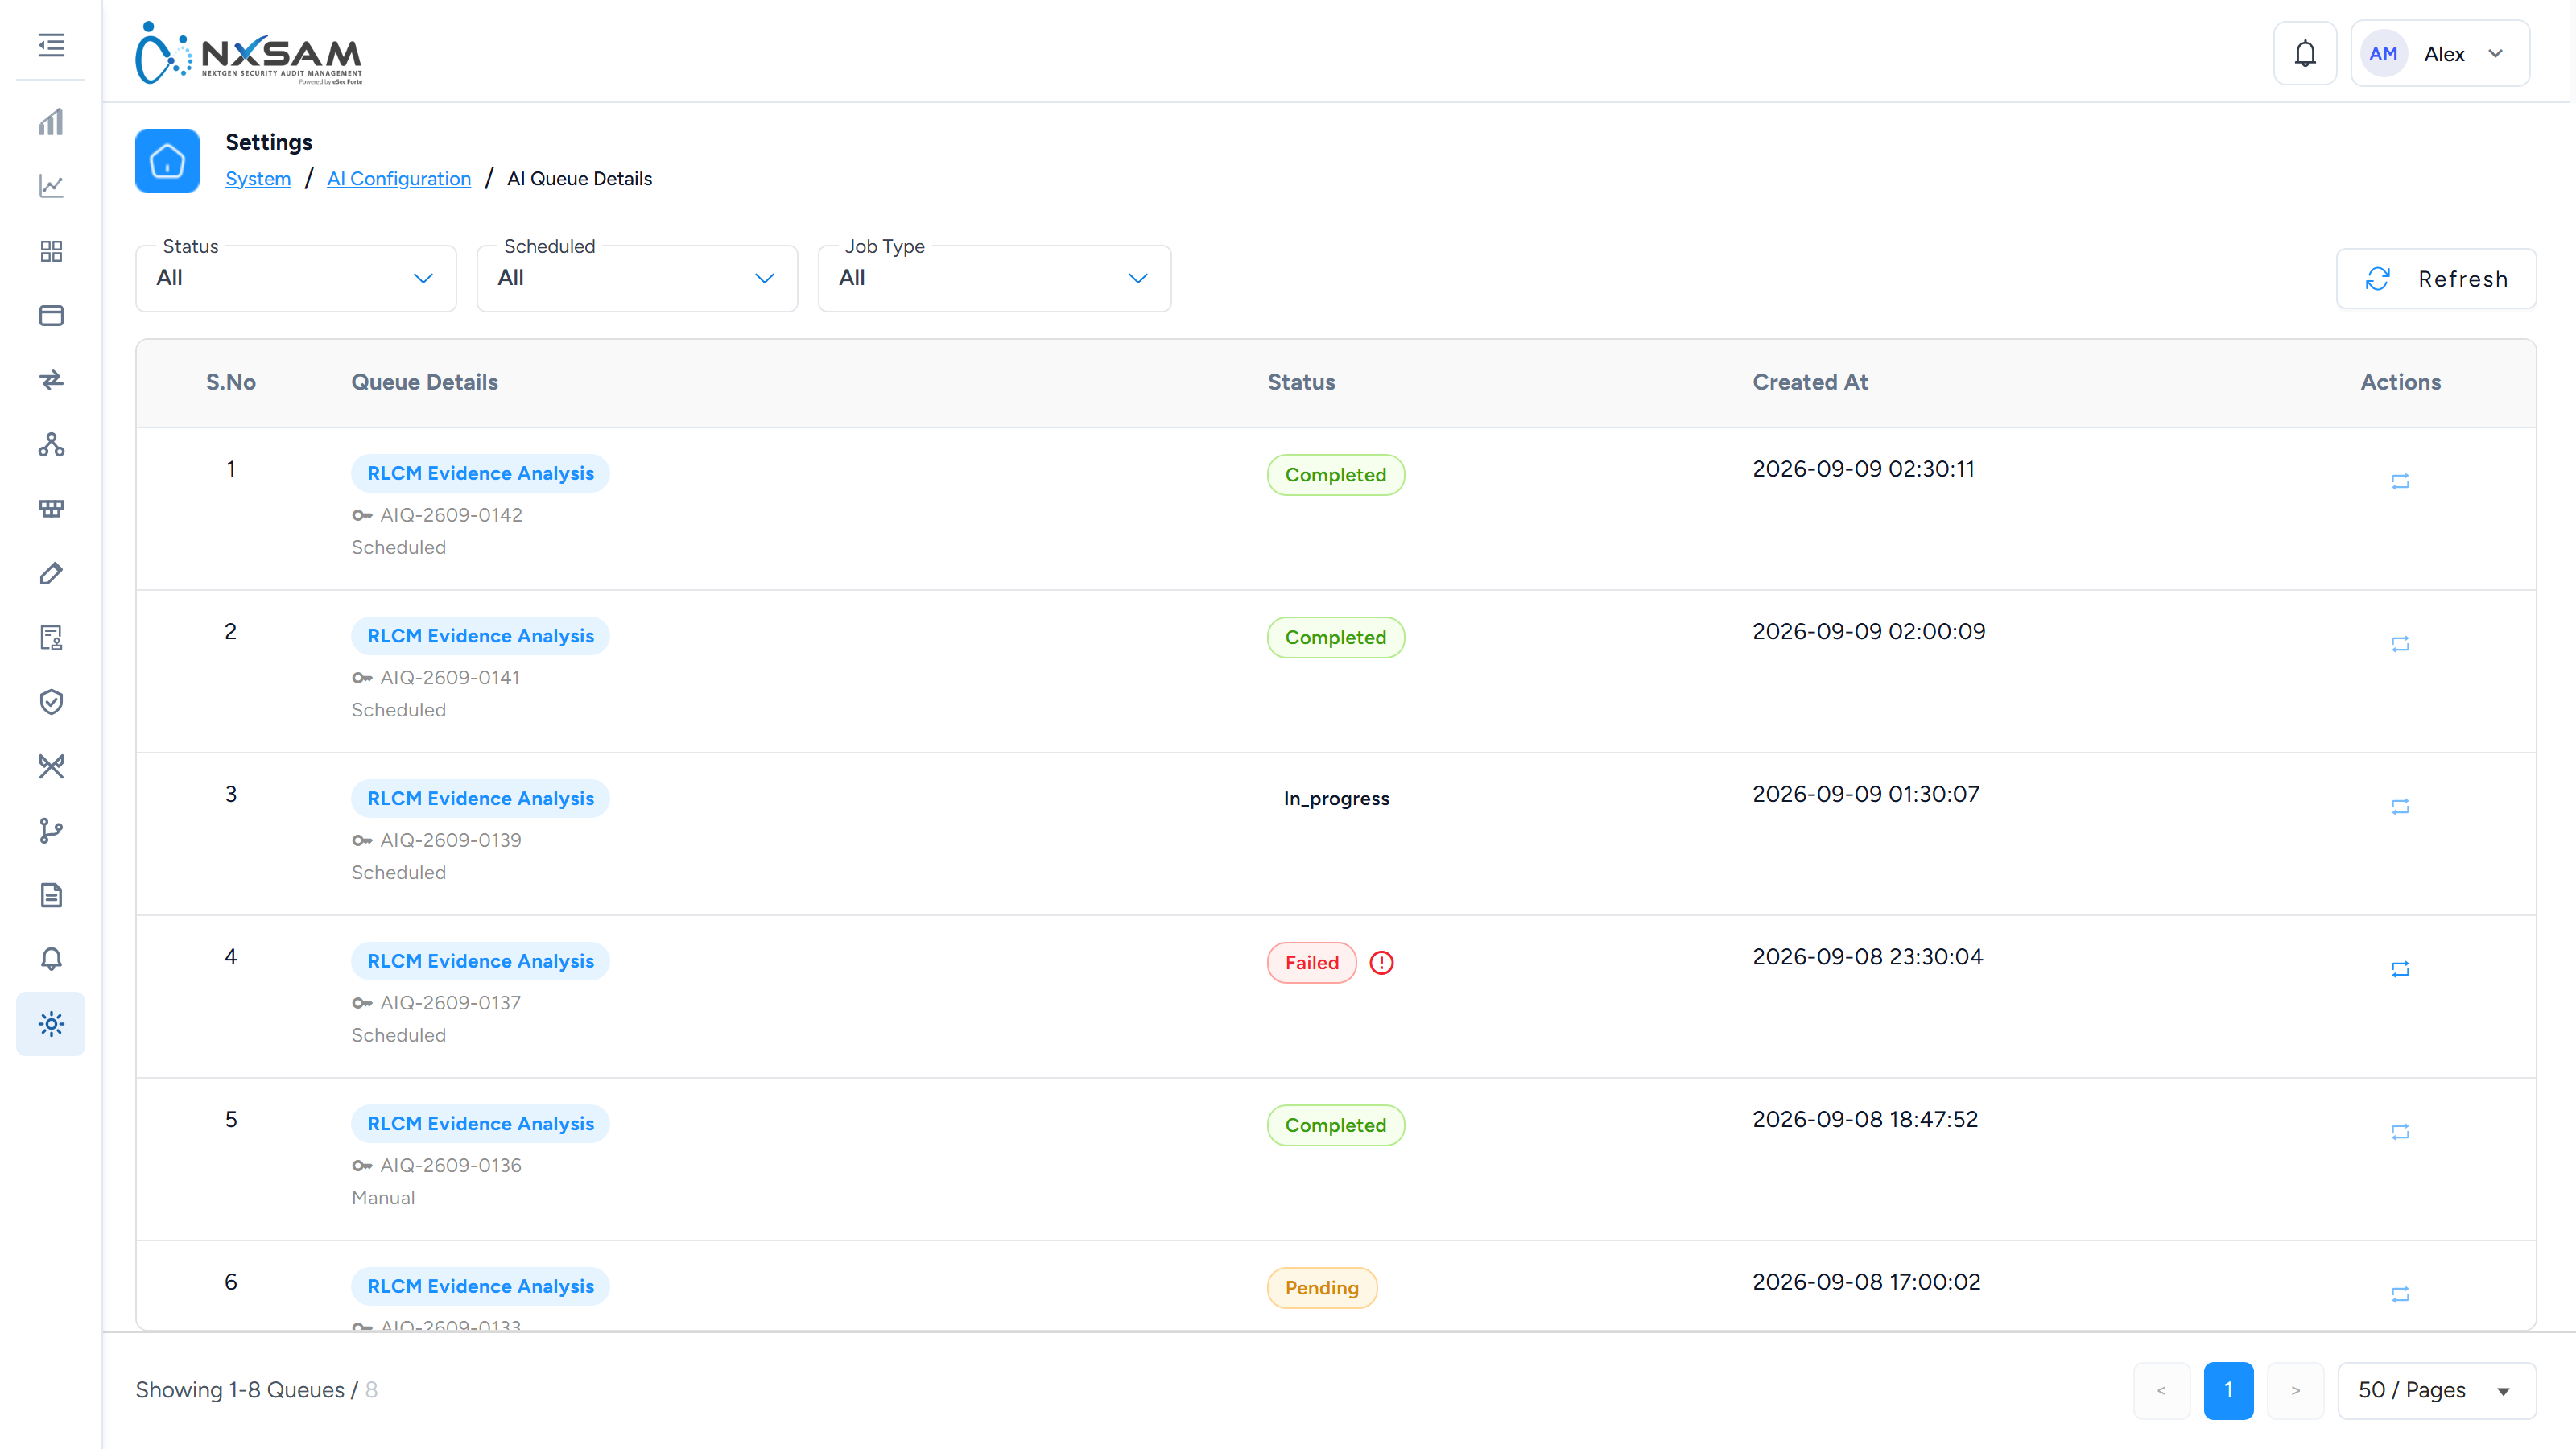
Active Directory
Directory integration for sign-in and user provisioning.
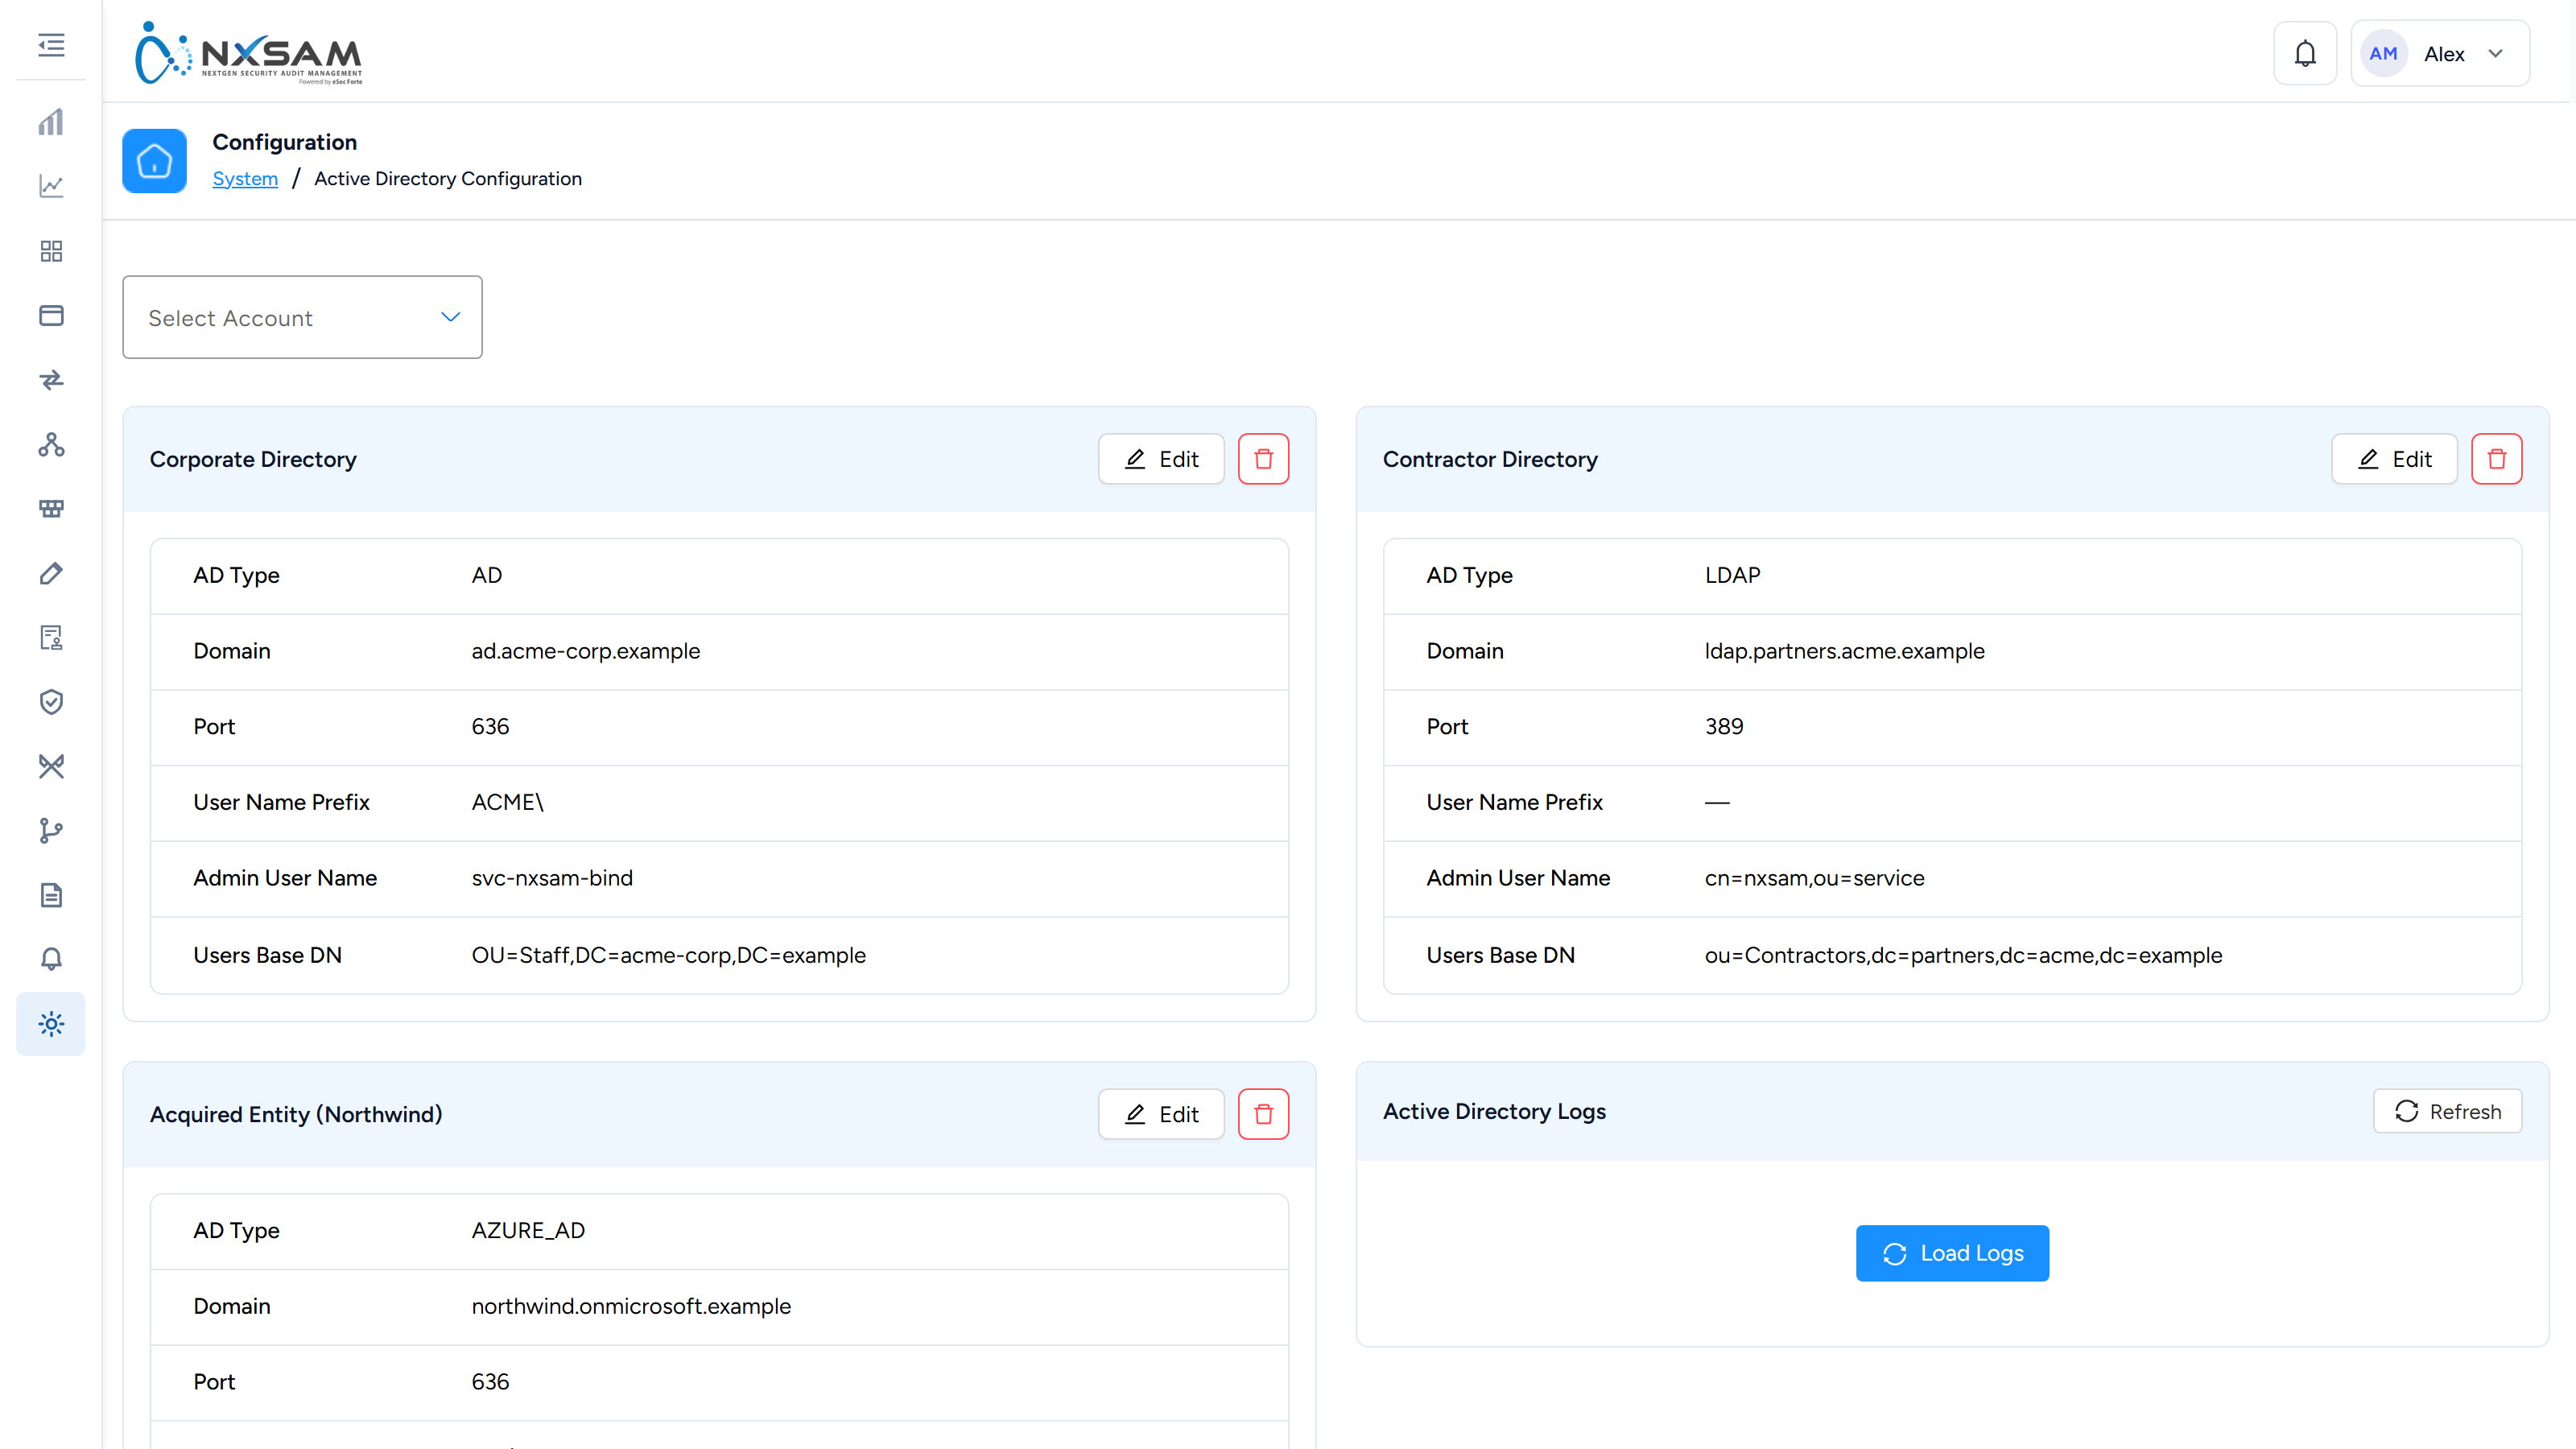
App Update
The running version, and whether a newer one is available.
Asset Limit
Licensed asset ceiling and current usage. Worth checking before a large onboarding.
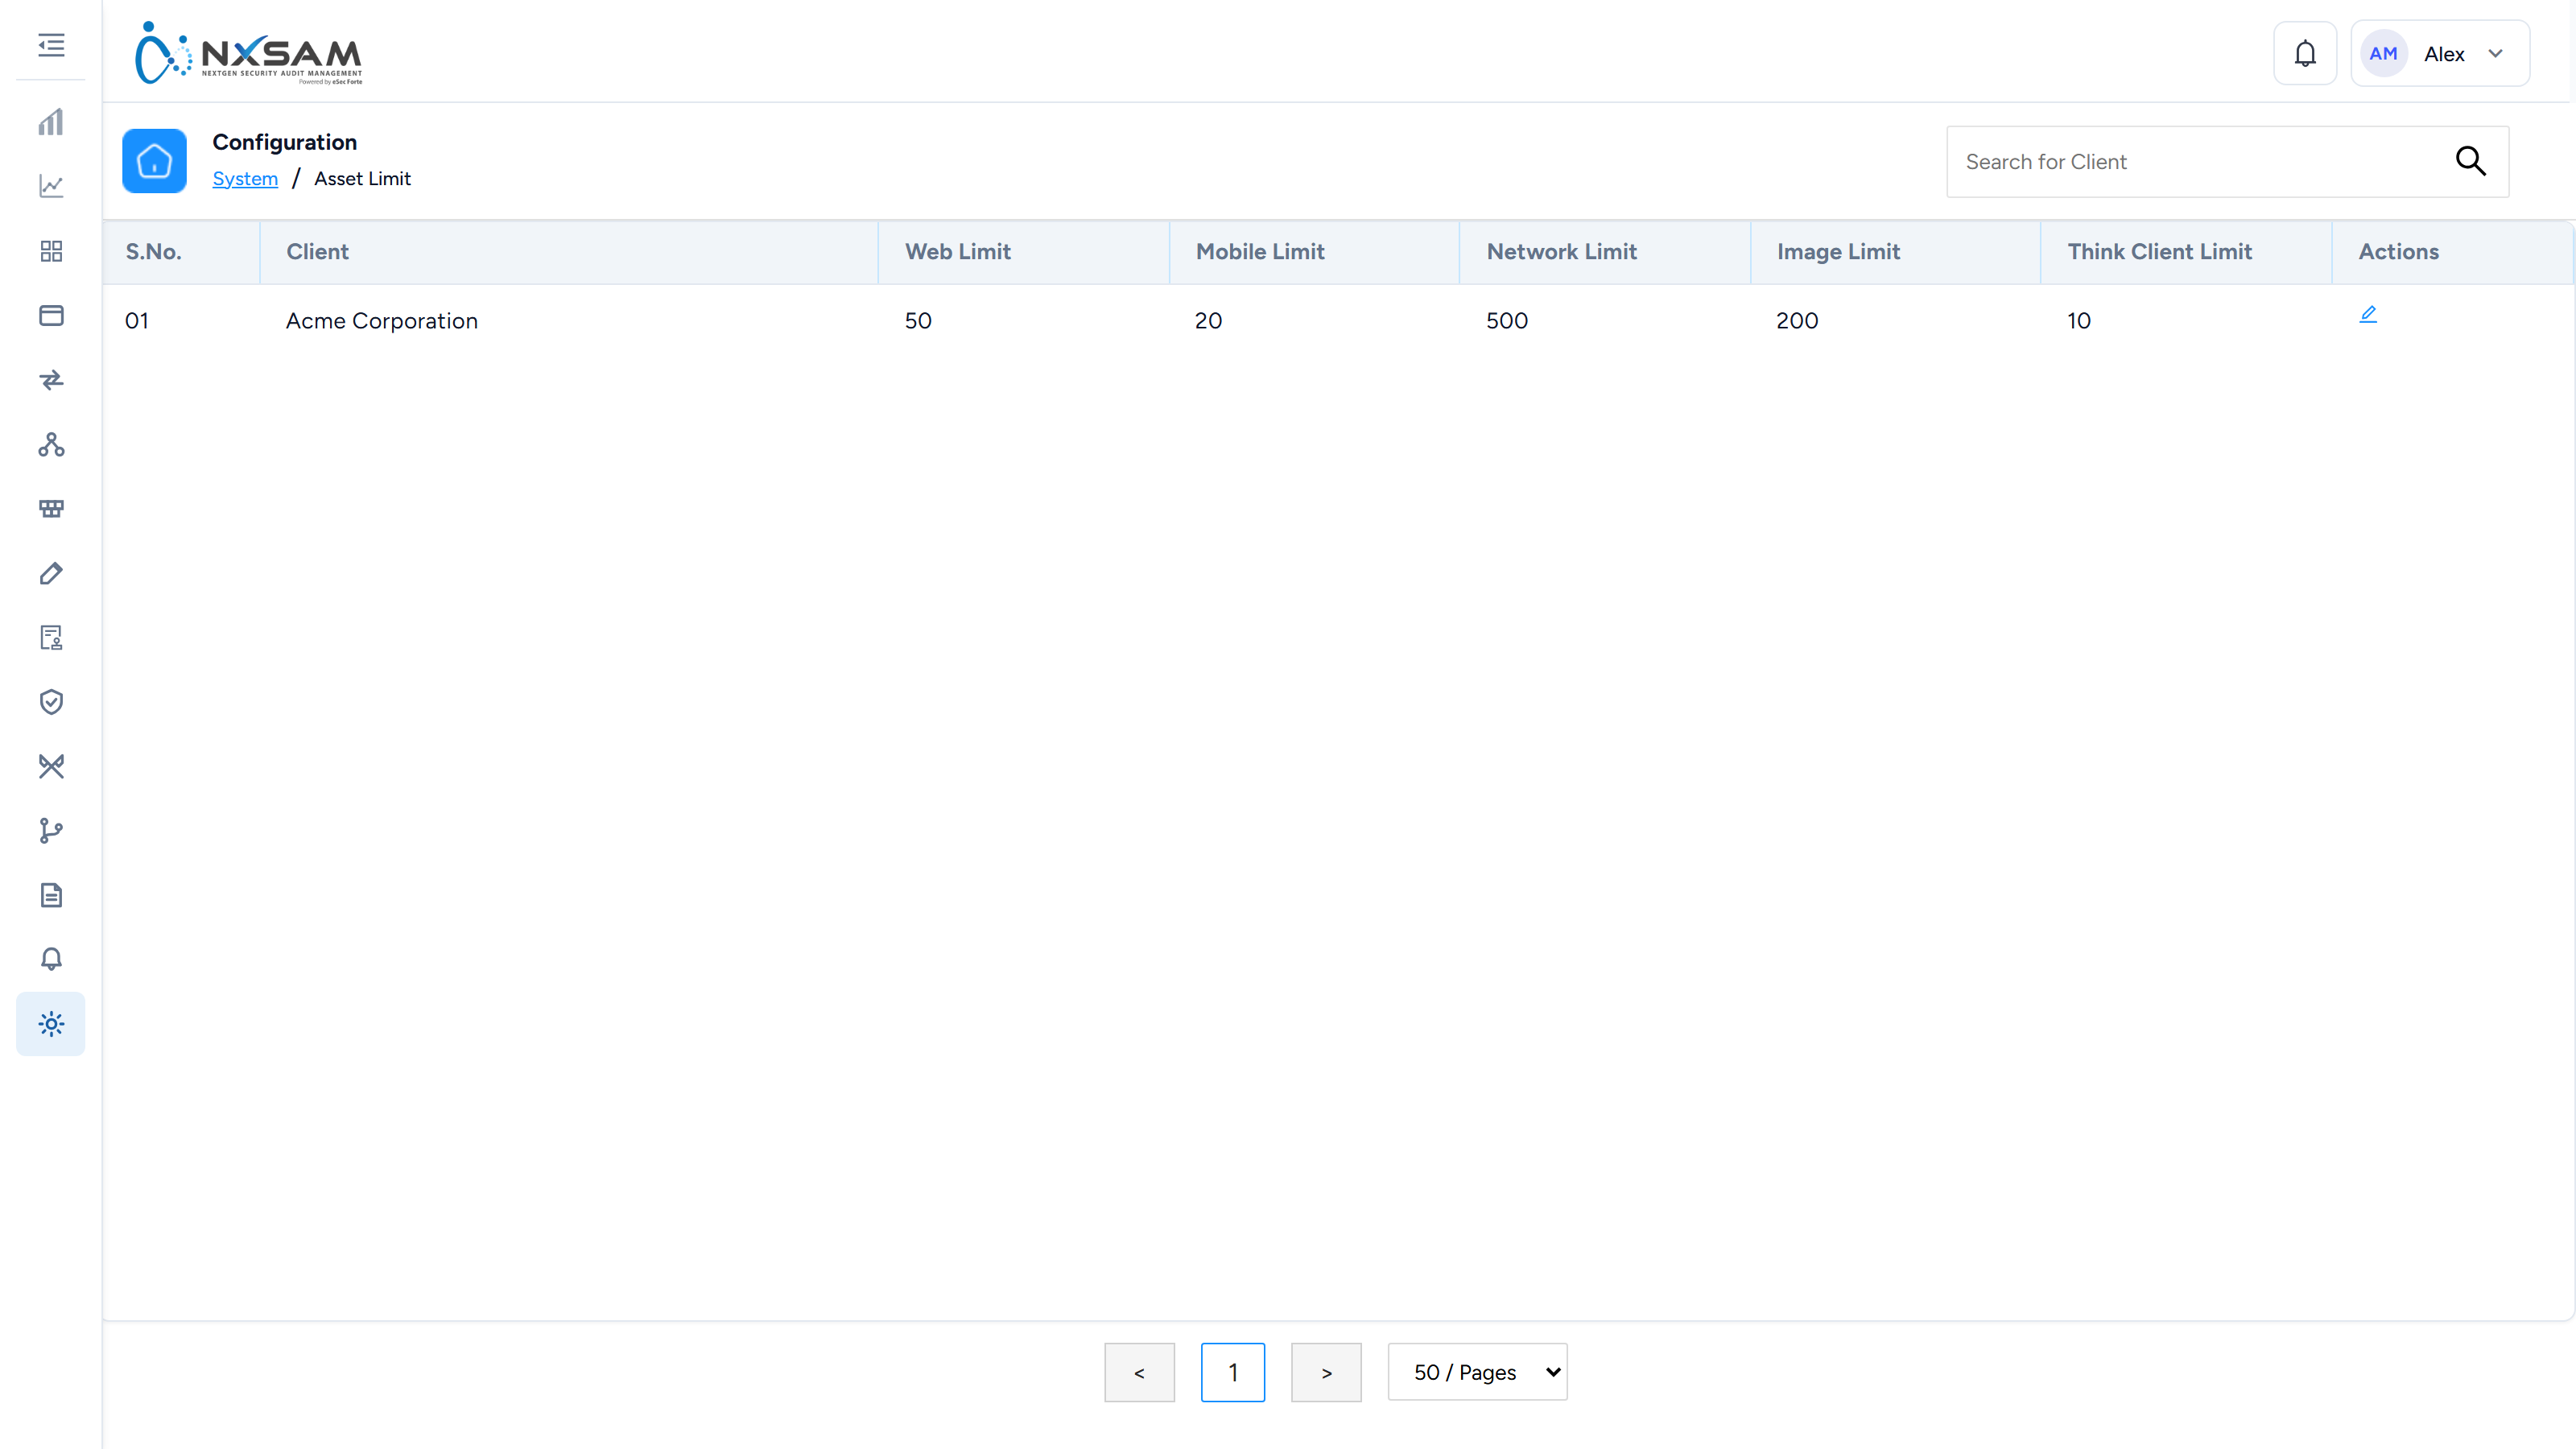
Email Configuration
The mail server used for notifications and scheduled reports.
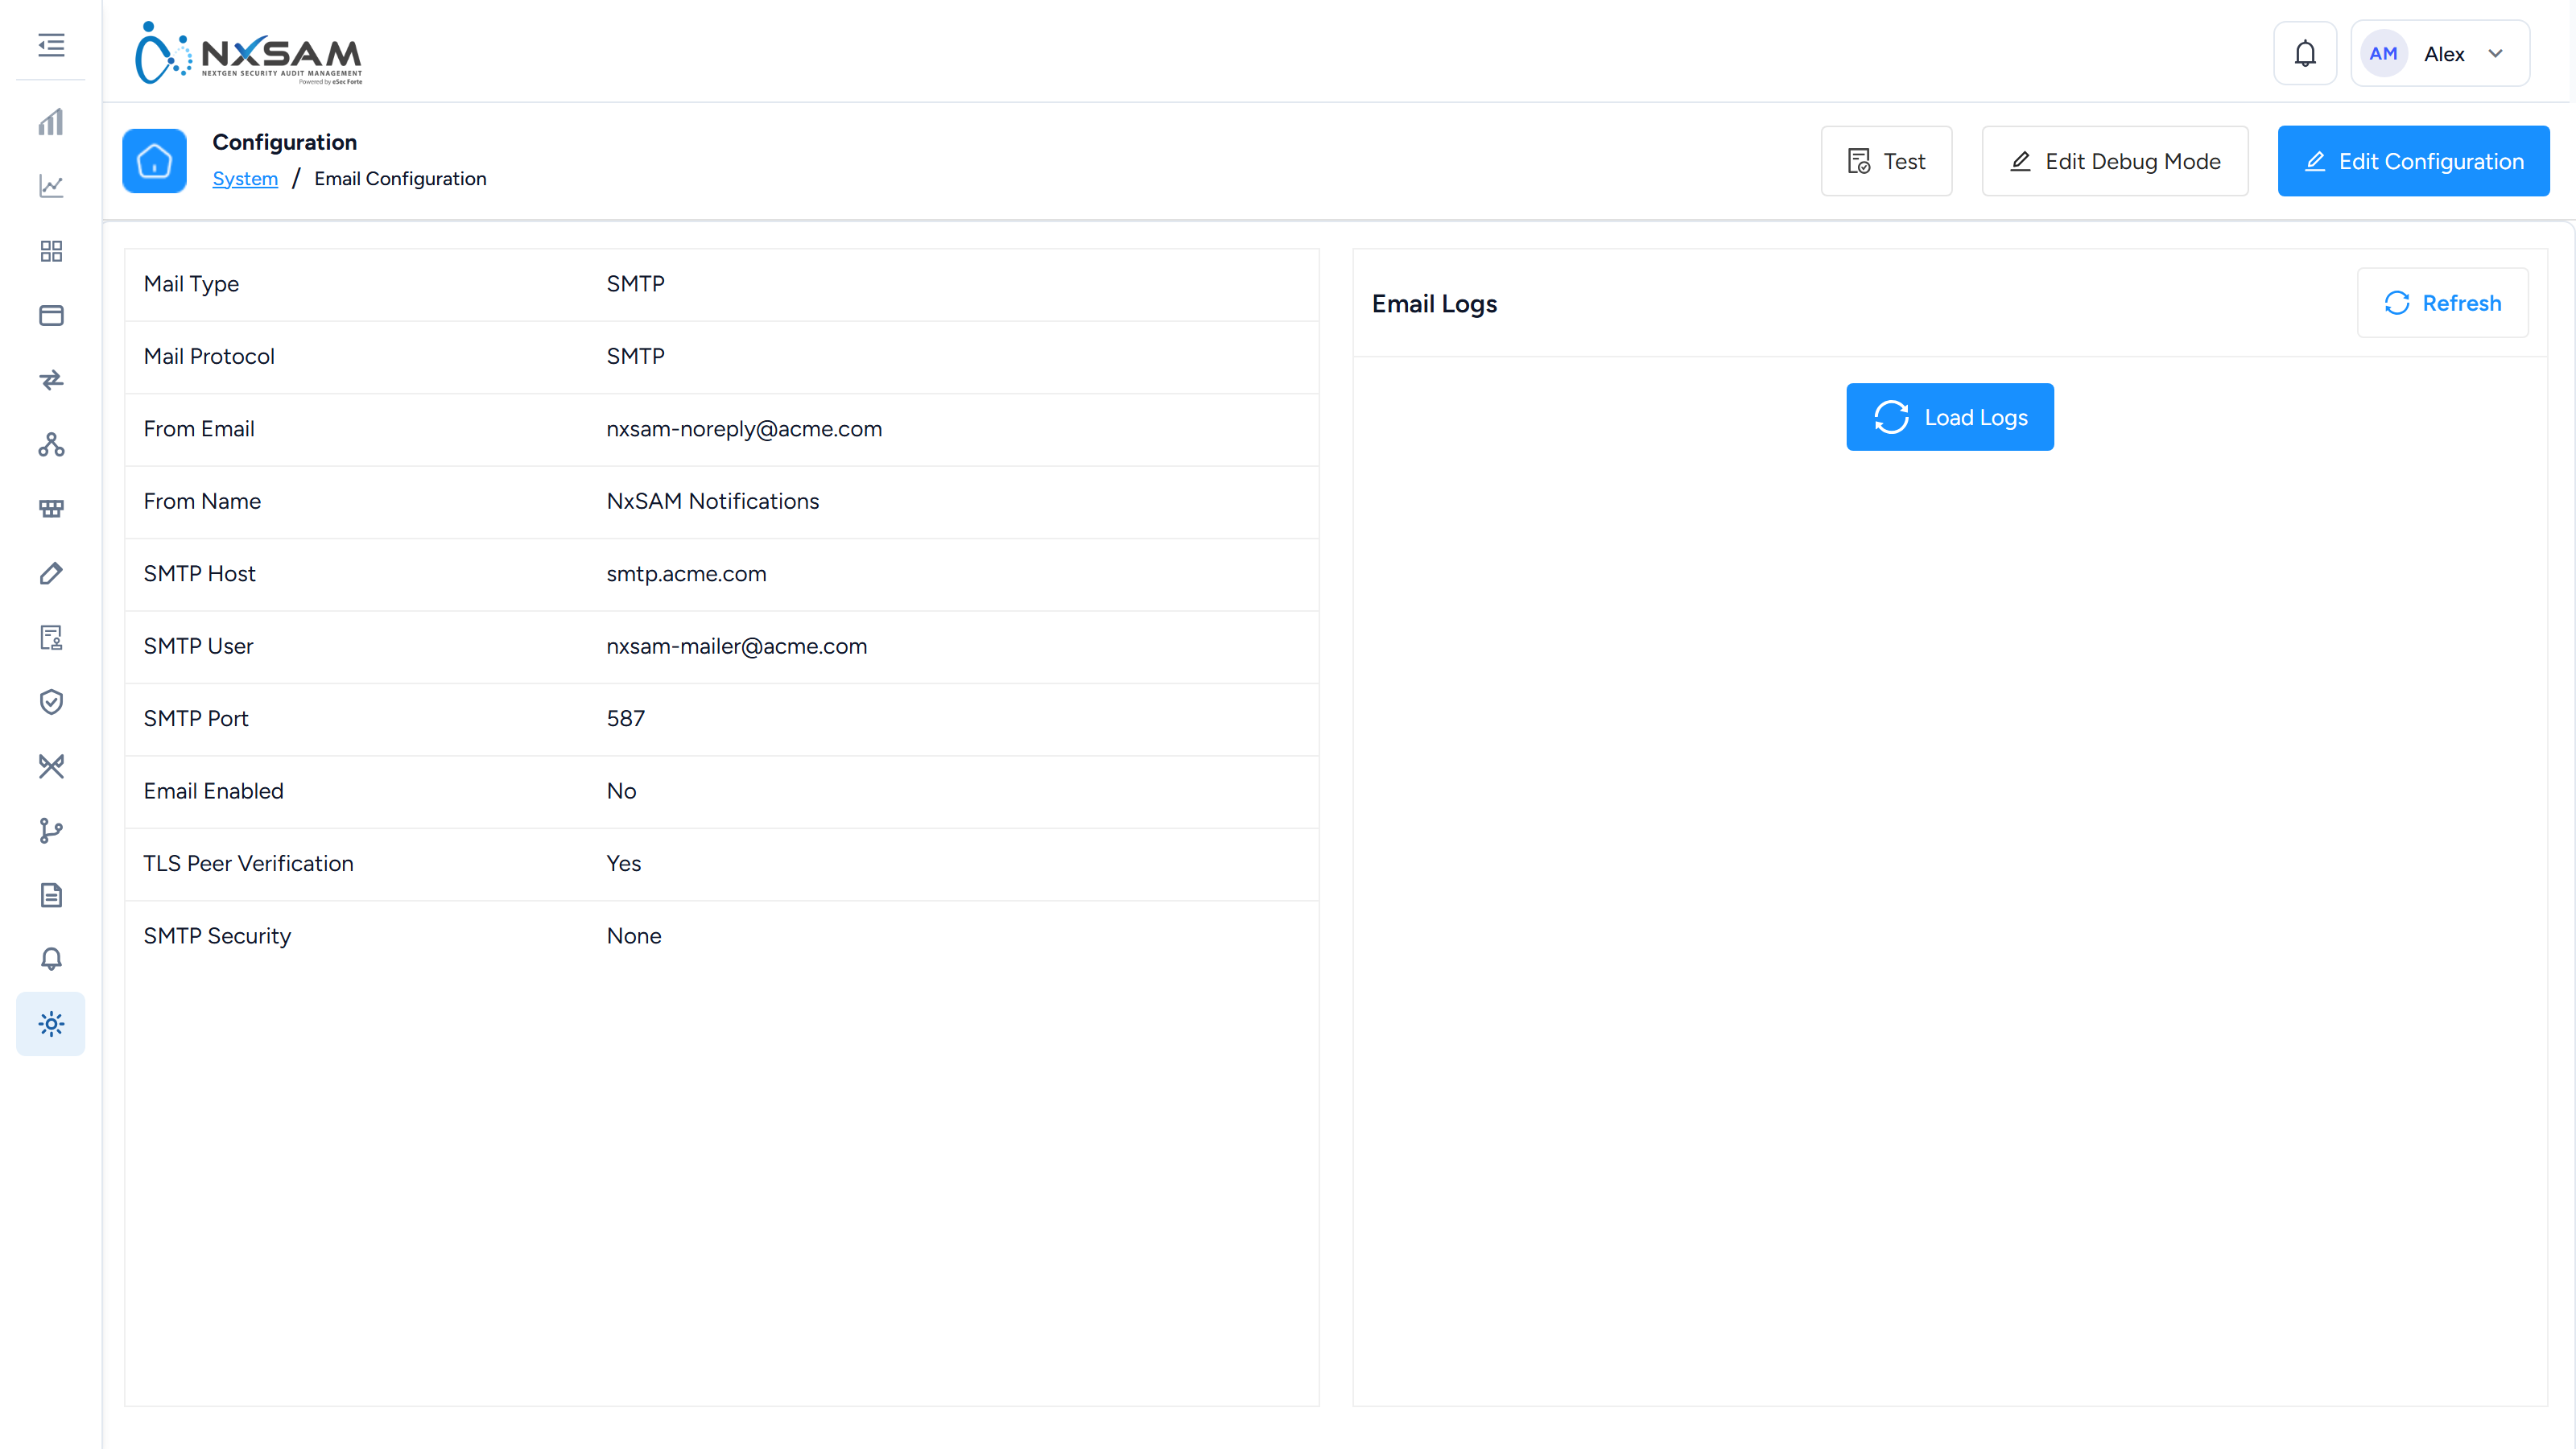
Health Check
Reconciles what NxSAM holds against what the source reported, so an incomplete import surfaces rather than passing unnoticed.
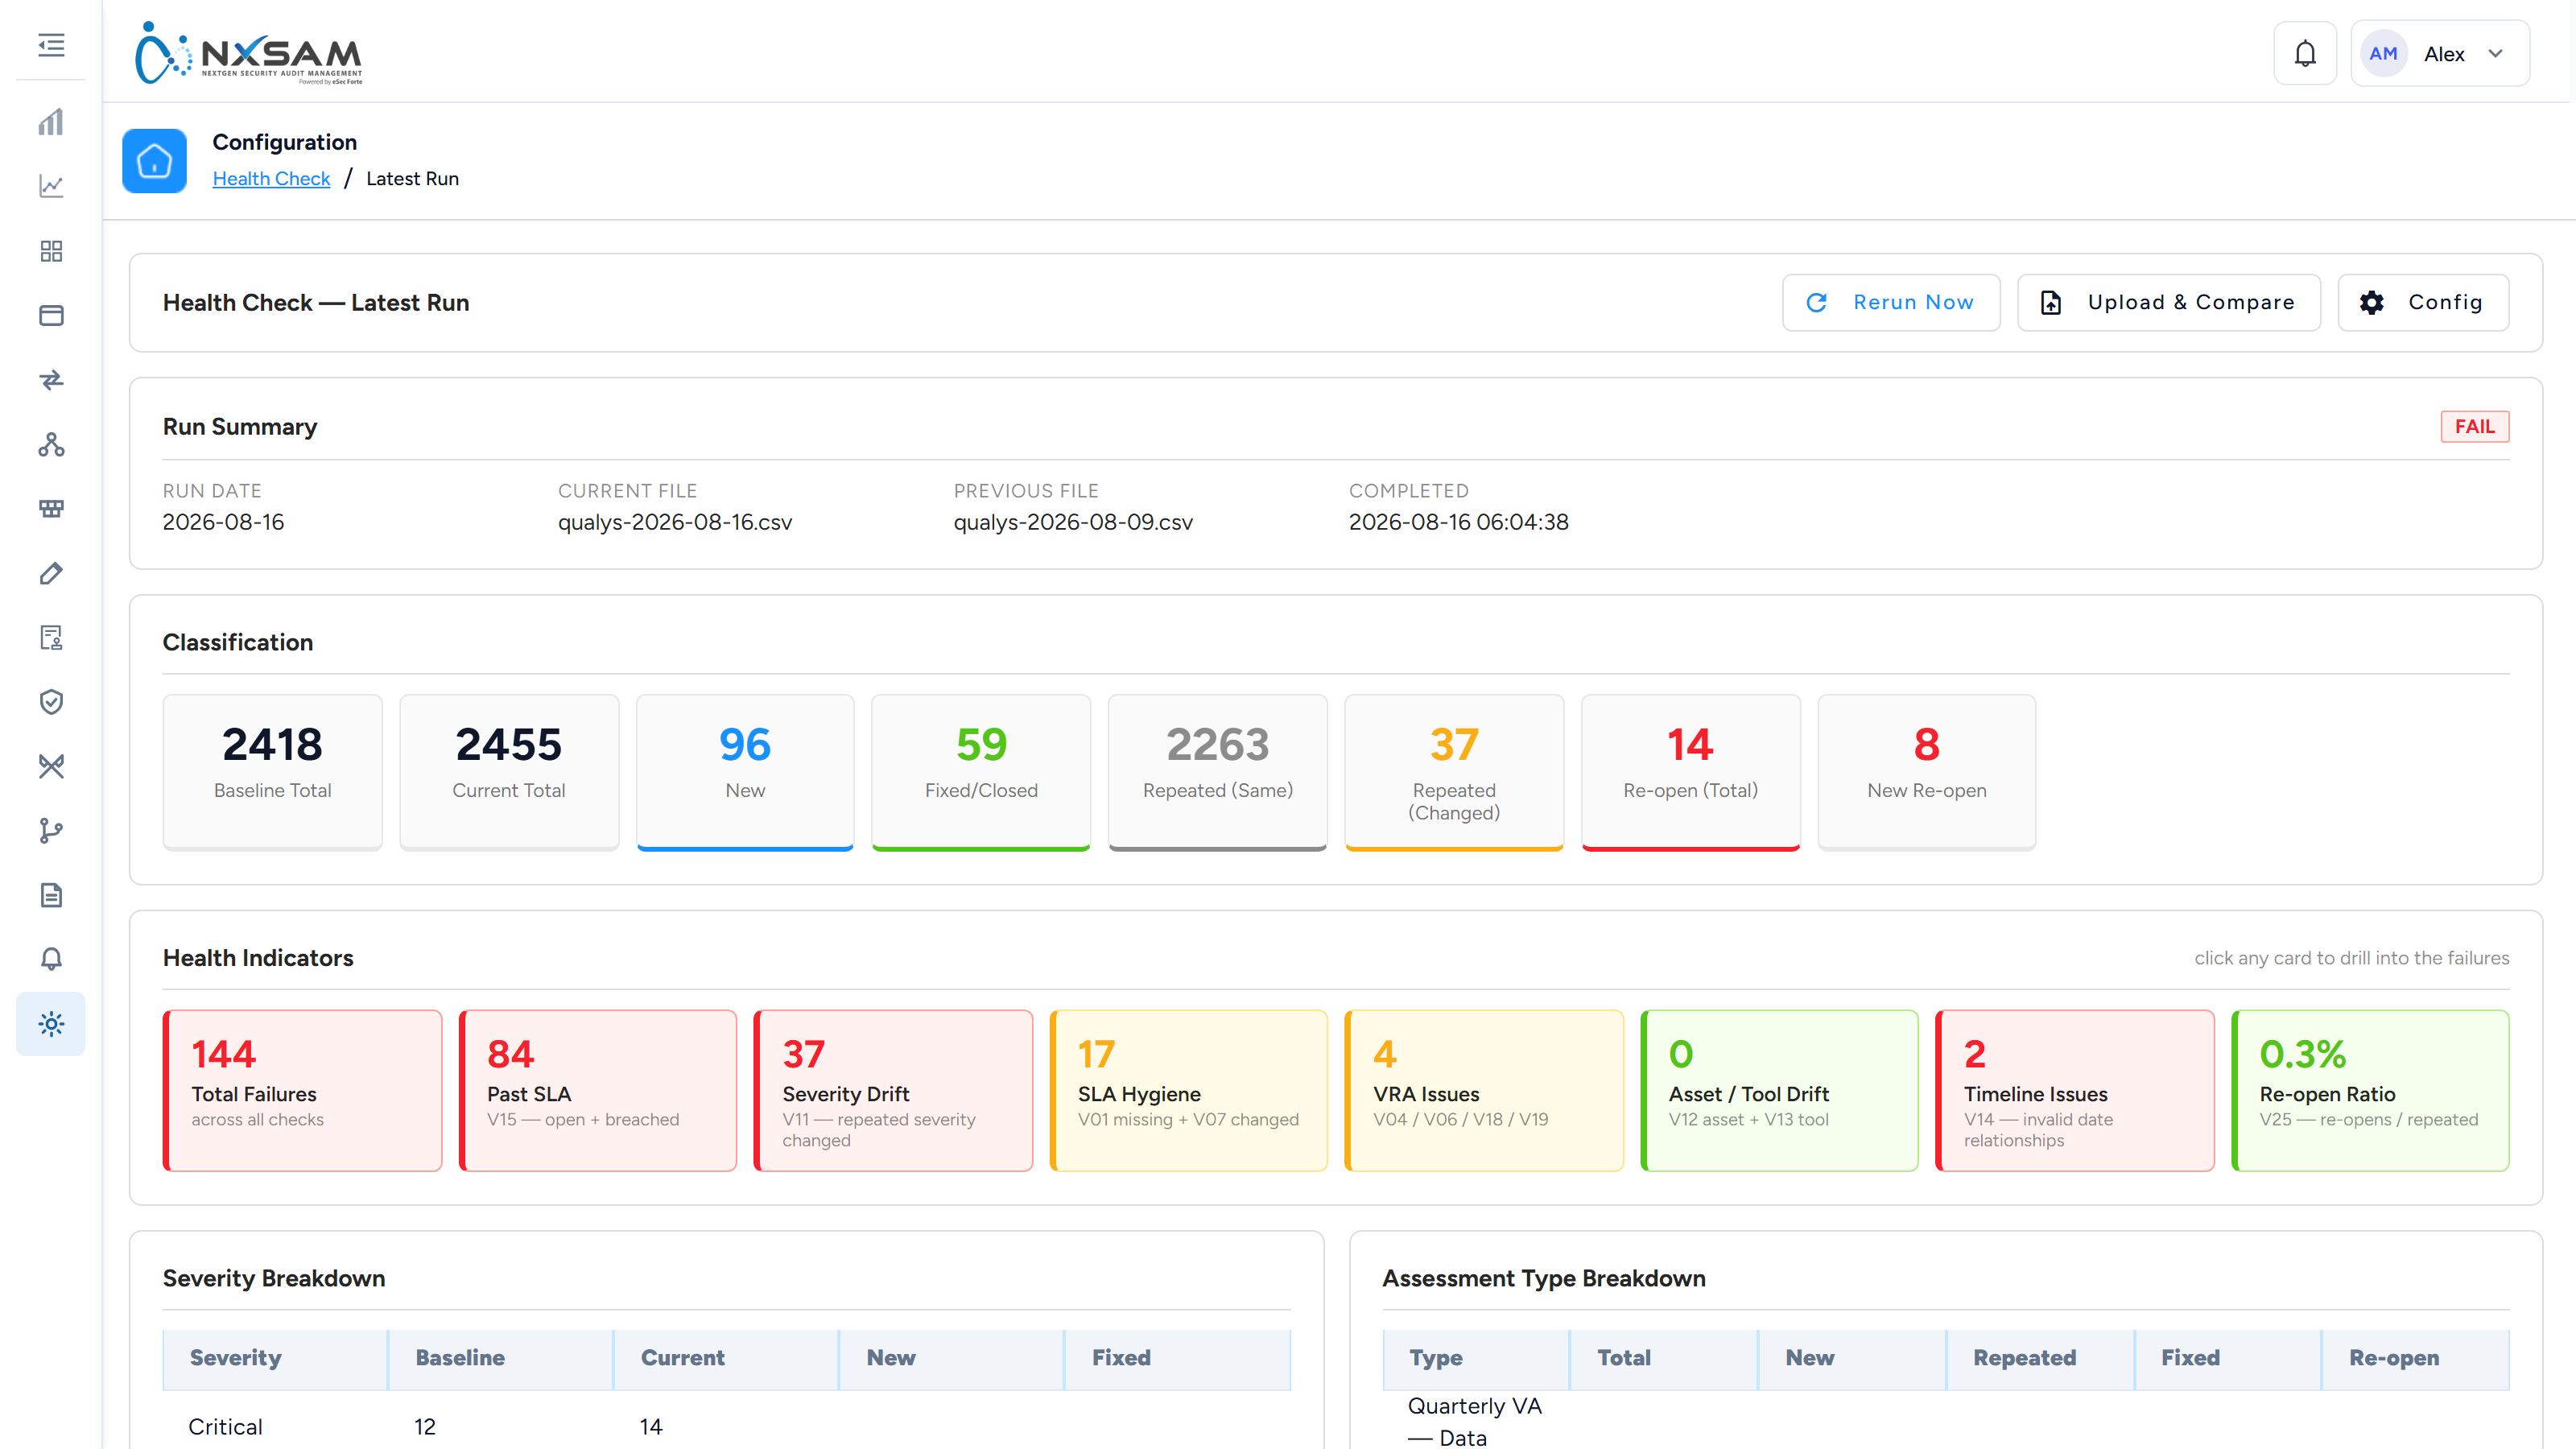
Health Check Configuration
The comparison rules that reconcile a tool’s own export against what NxSAM holds — which columns identify a finding, and what counts as a mismatch.

Import Configuration
How bulk imports behave, including what to do with rows that do not match.
Licence
The same licence detail, reached from Configurations.
Licence Details
When the licence expires.
Process Manager
Background work — imports, report generation, synchronisation — and whether each job is queued, running or failed.
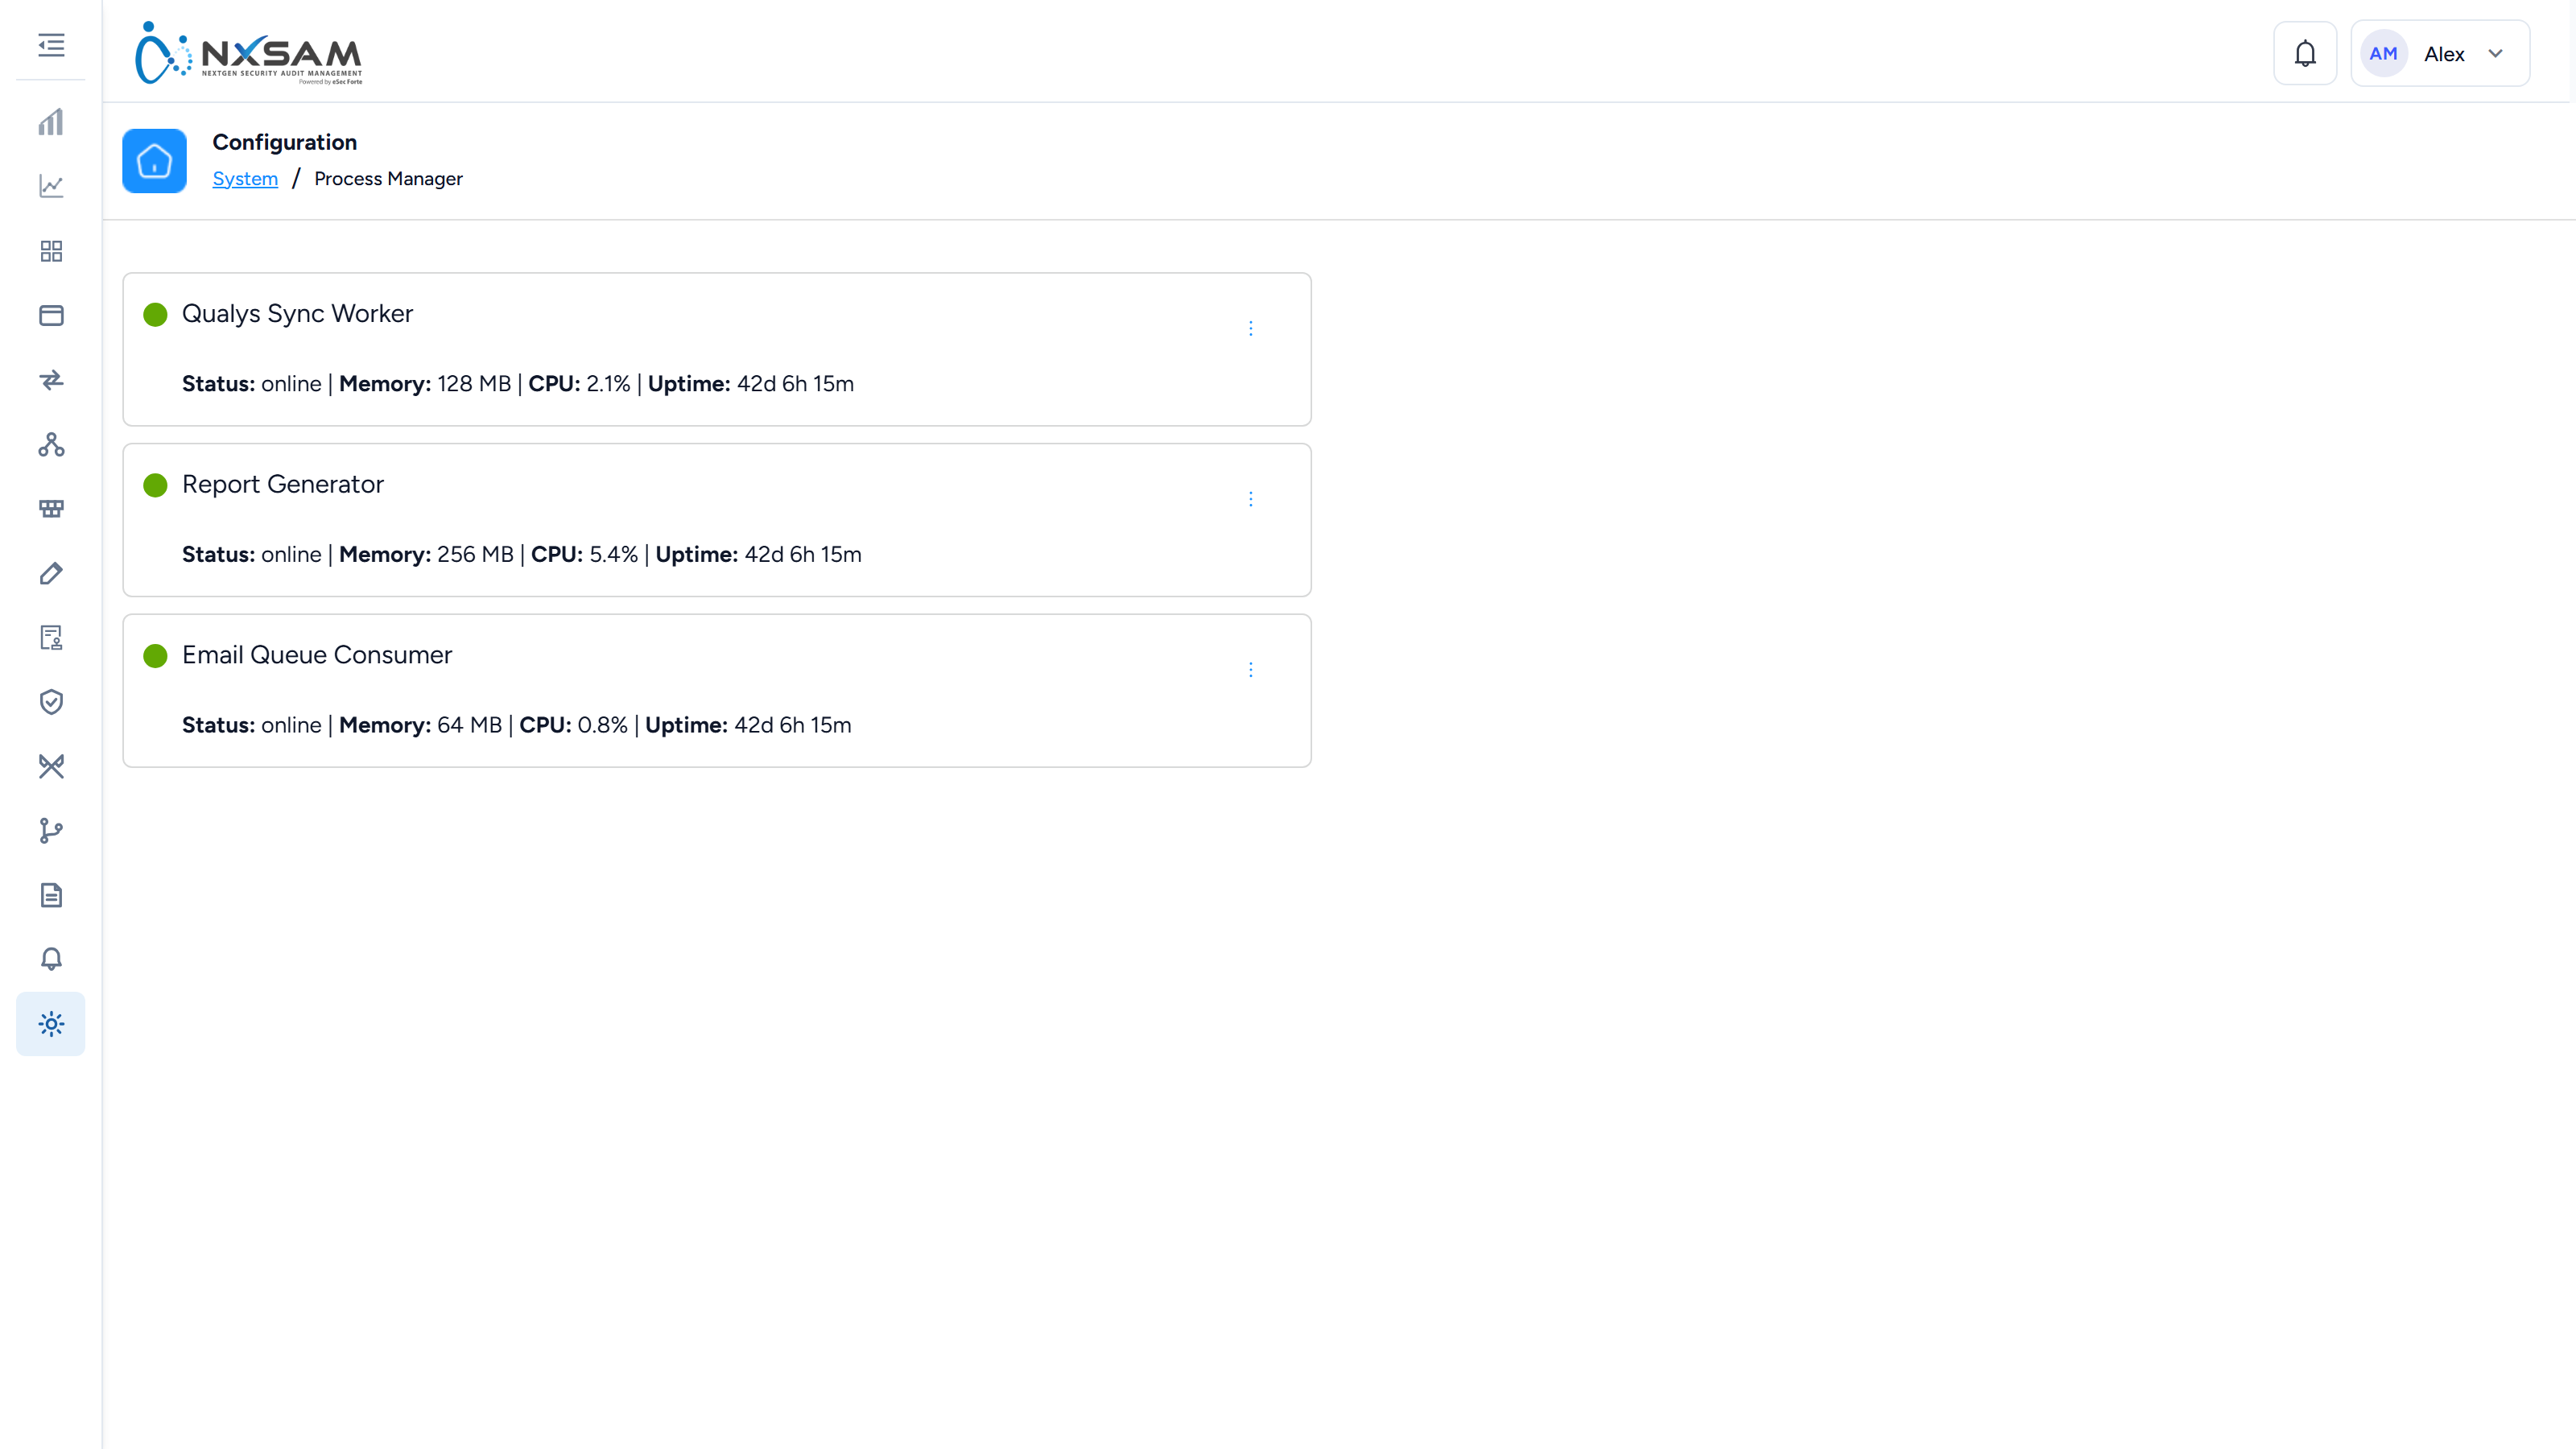
Risk Score Properties
Which asset attributes feed the contextual risk score.
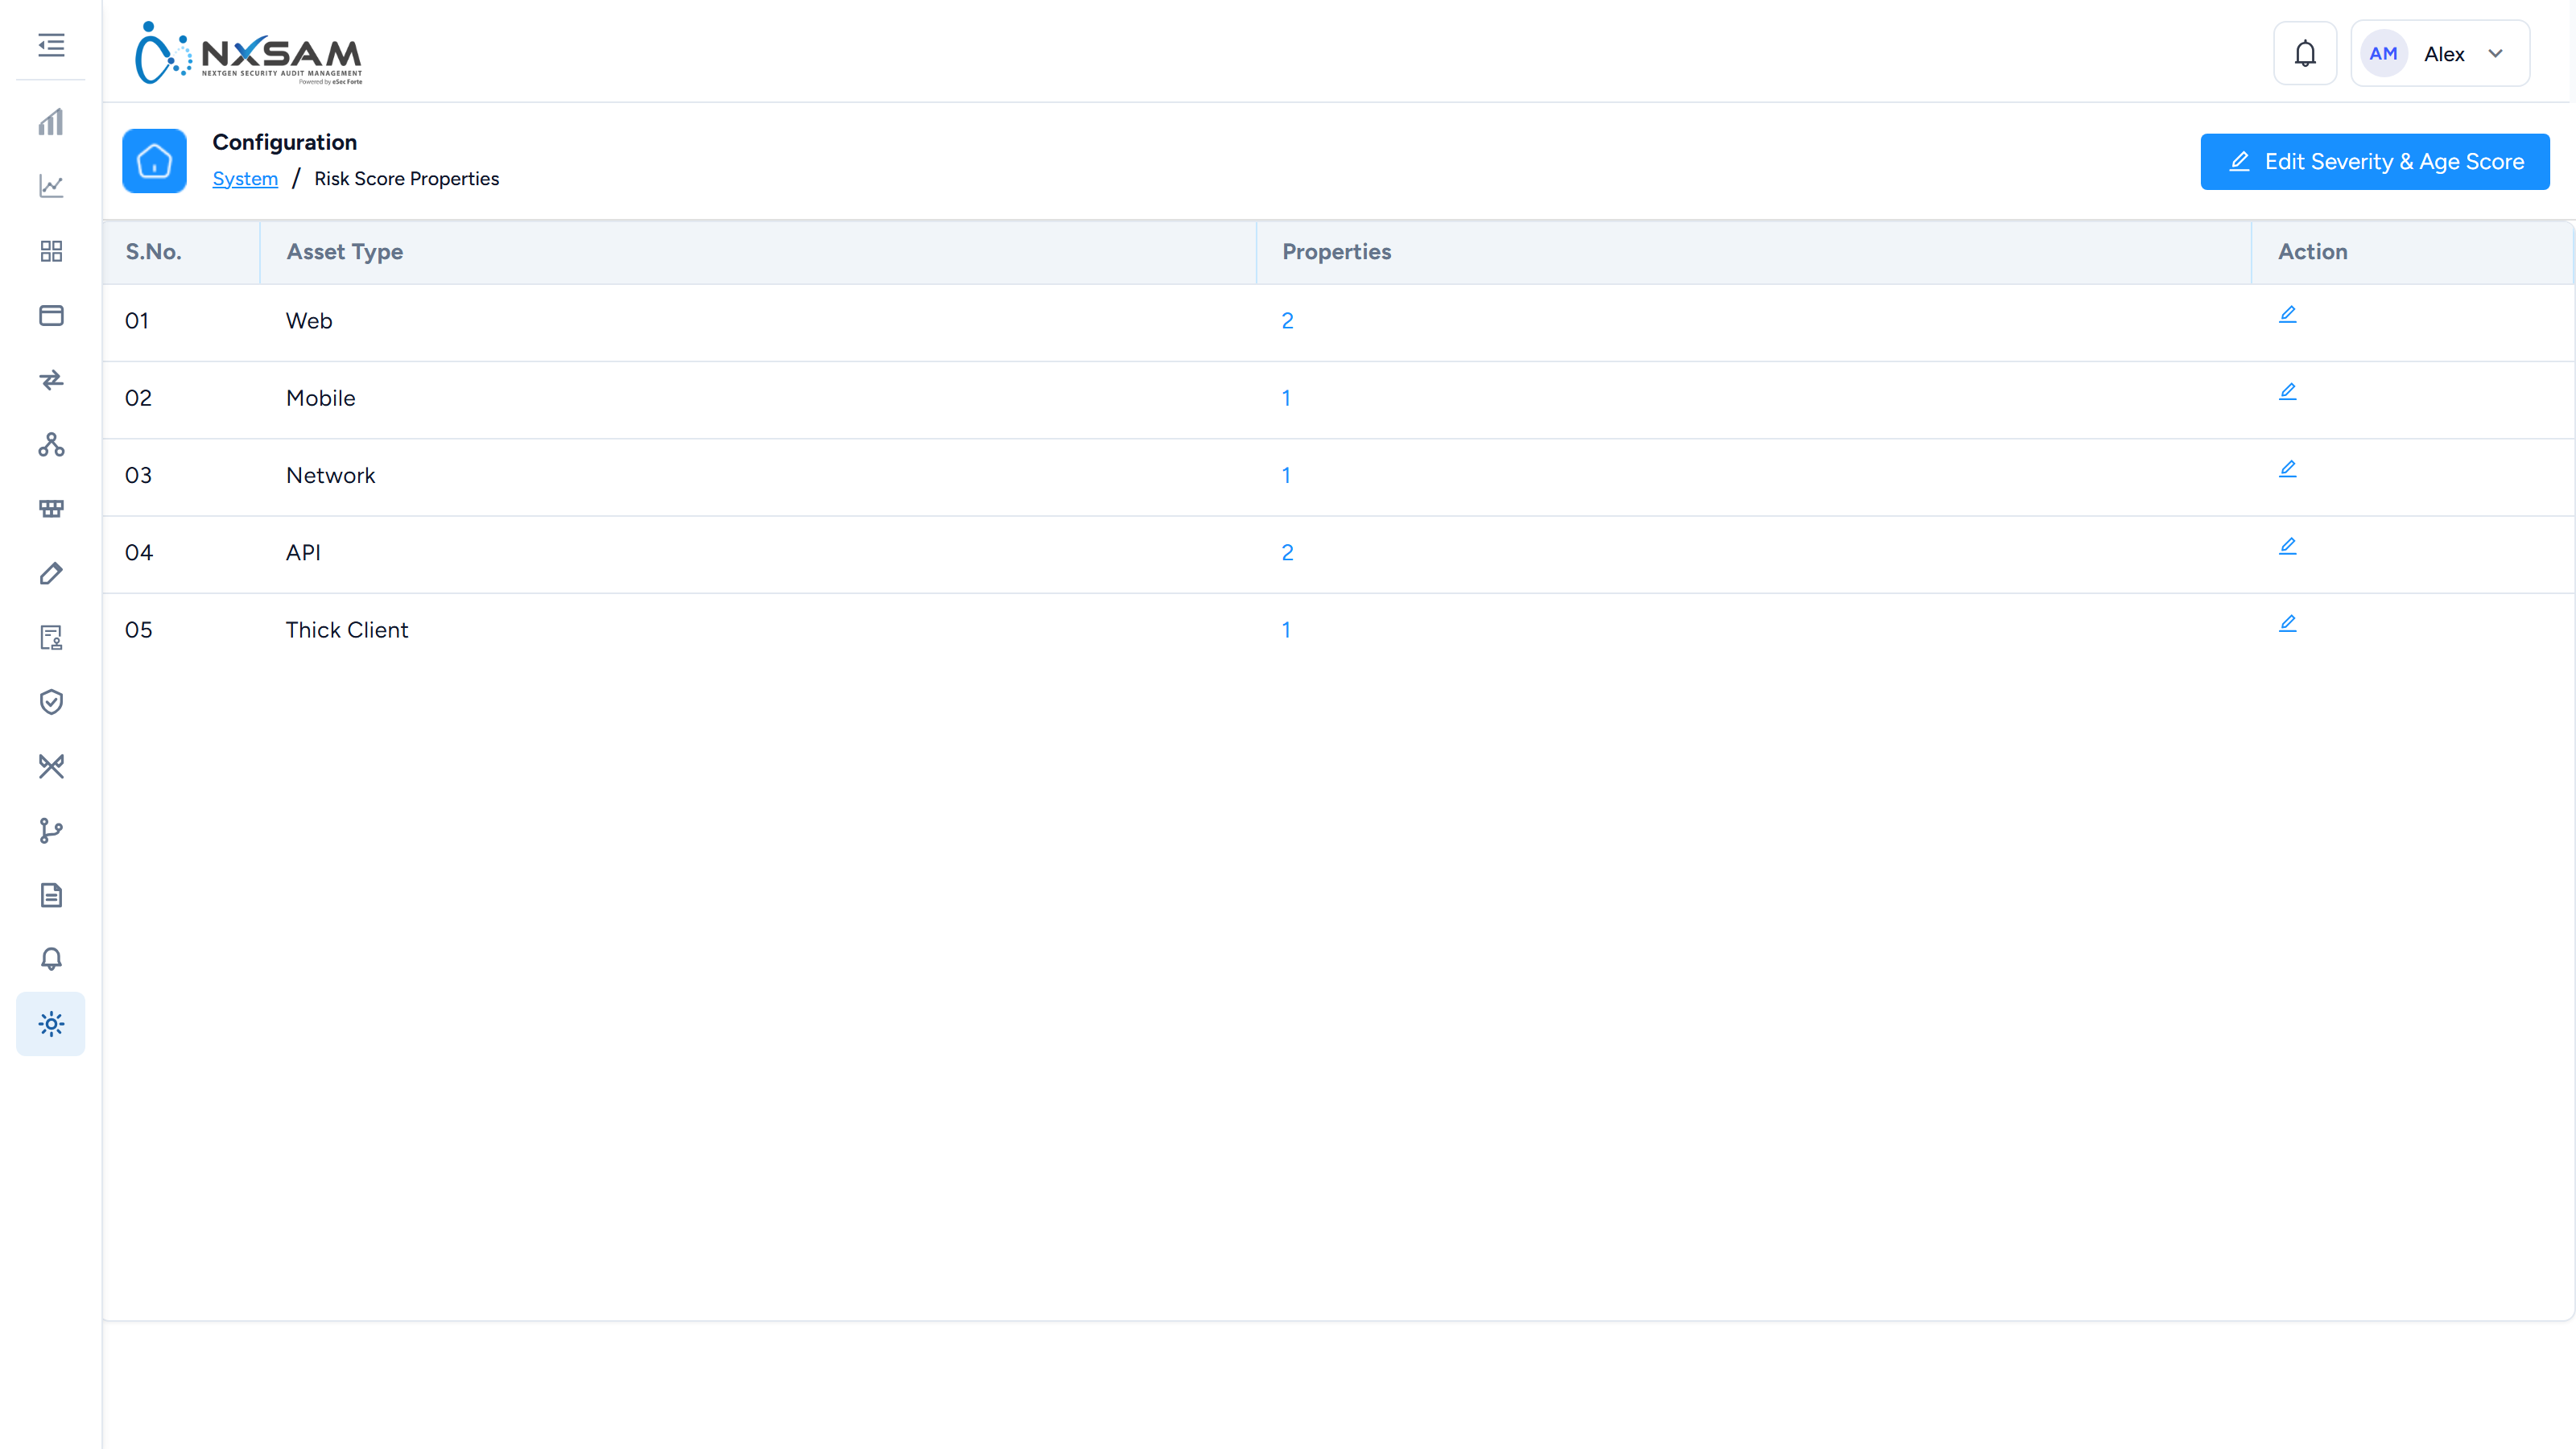
Scheduled Jobs
The periodic background work that keeps derived data current. Figures stale by a fixed interval usually mean a job stopped.
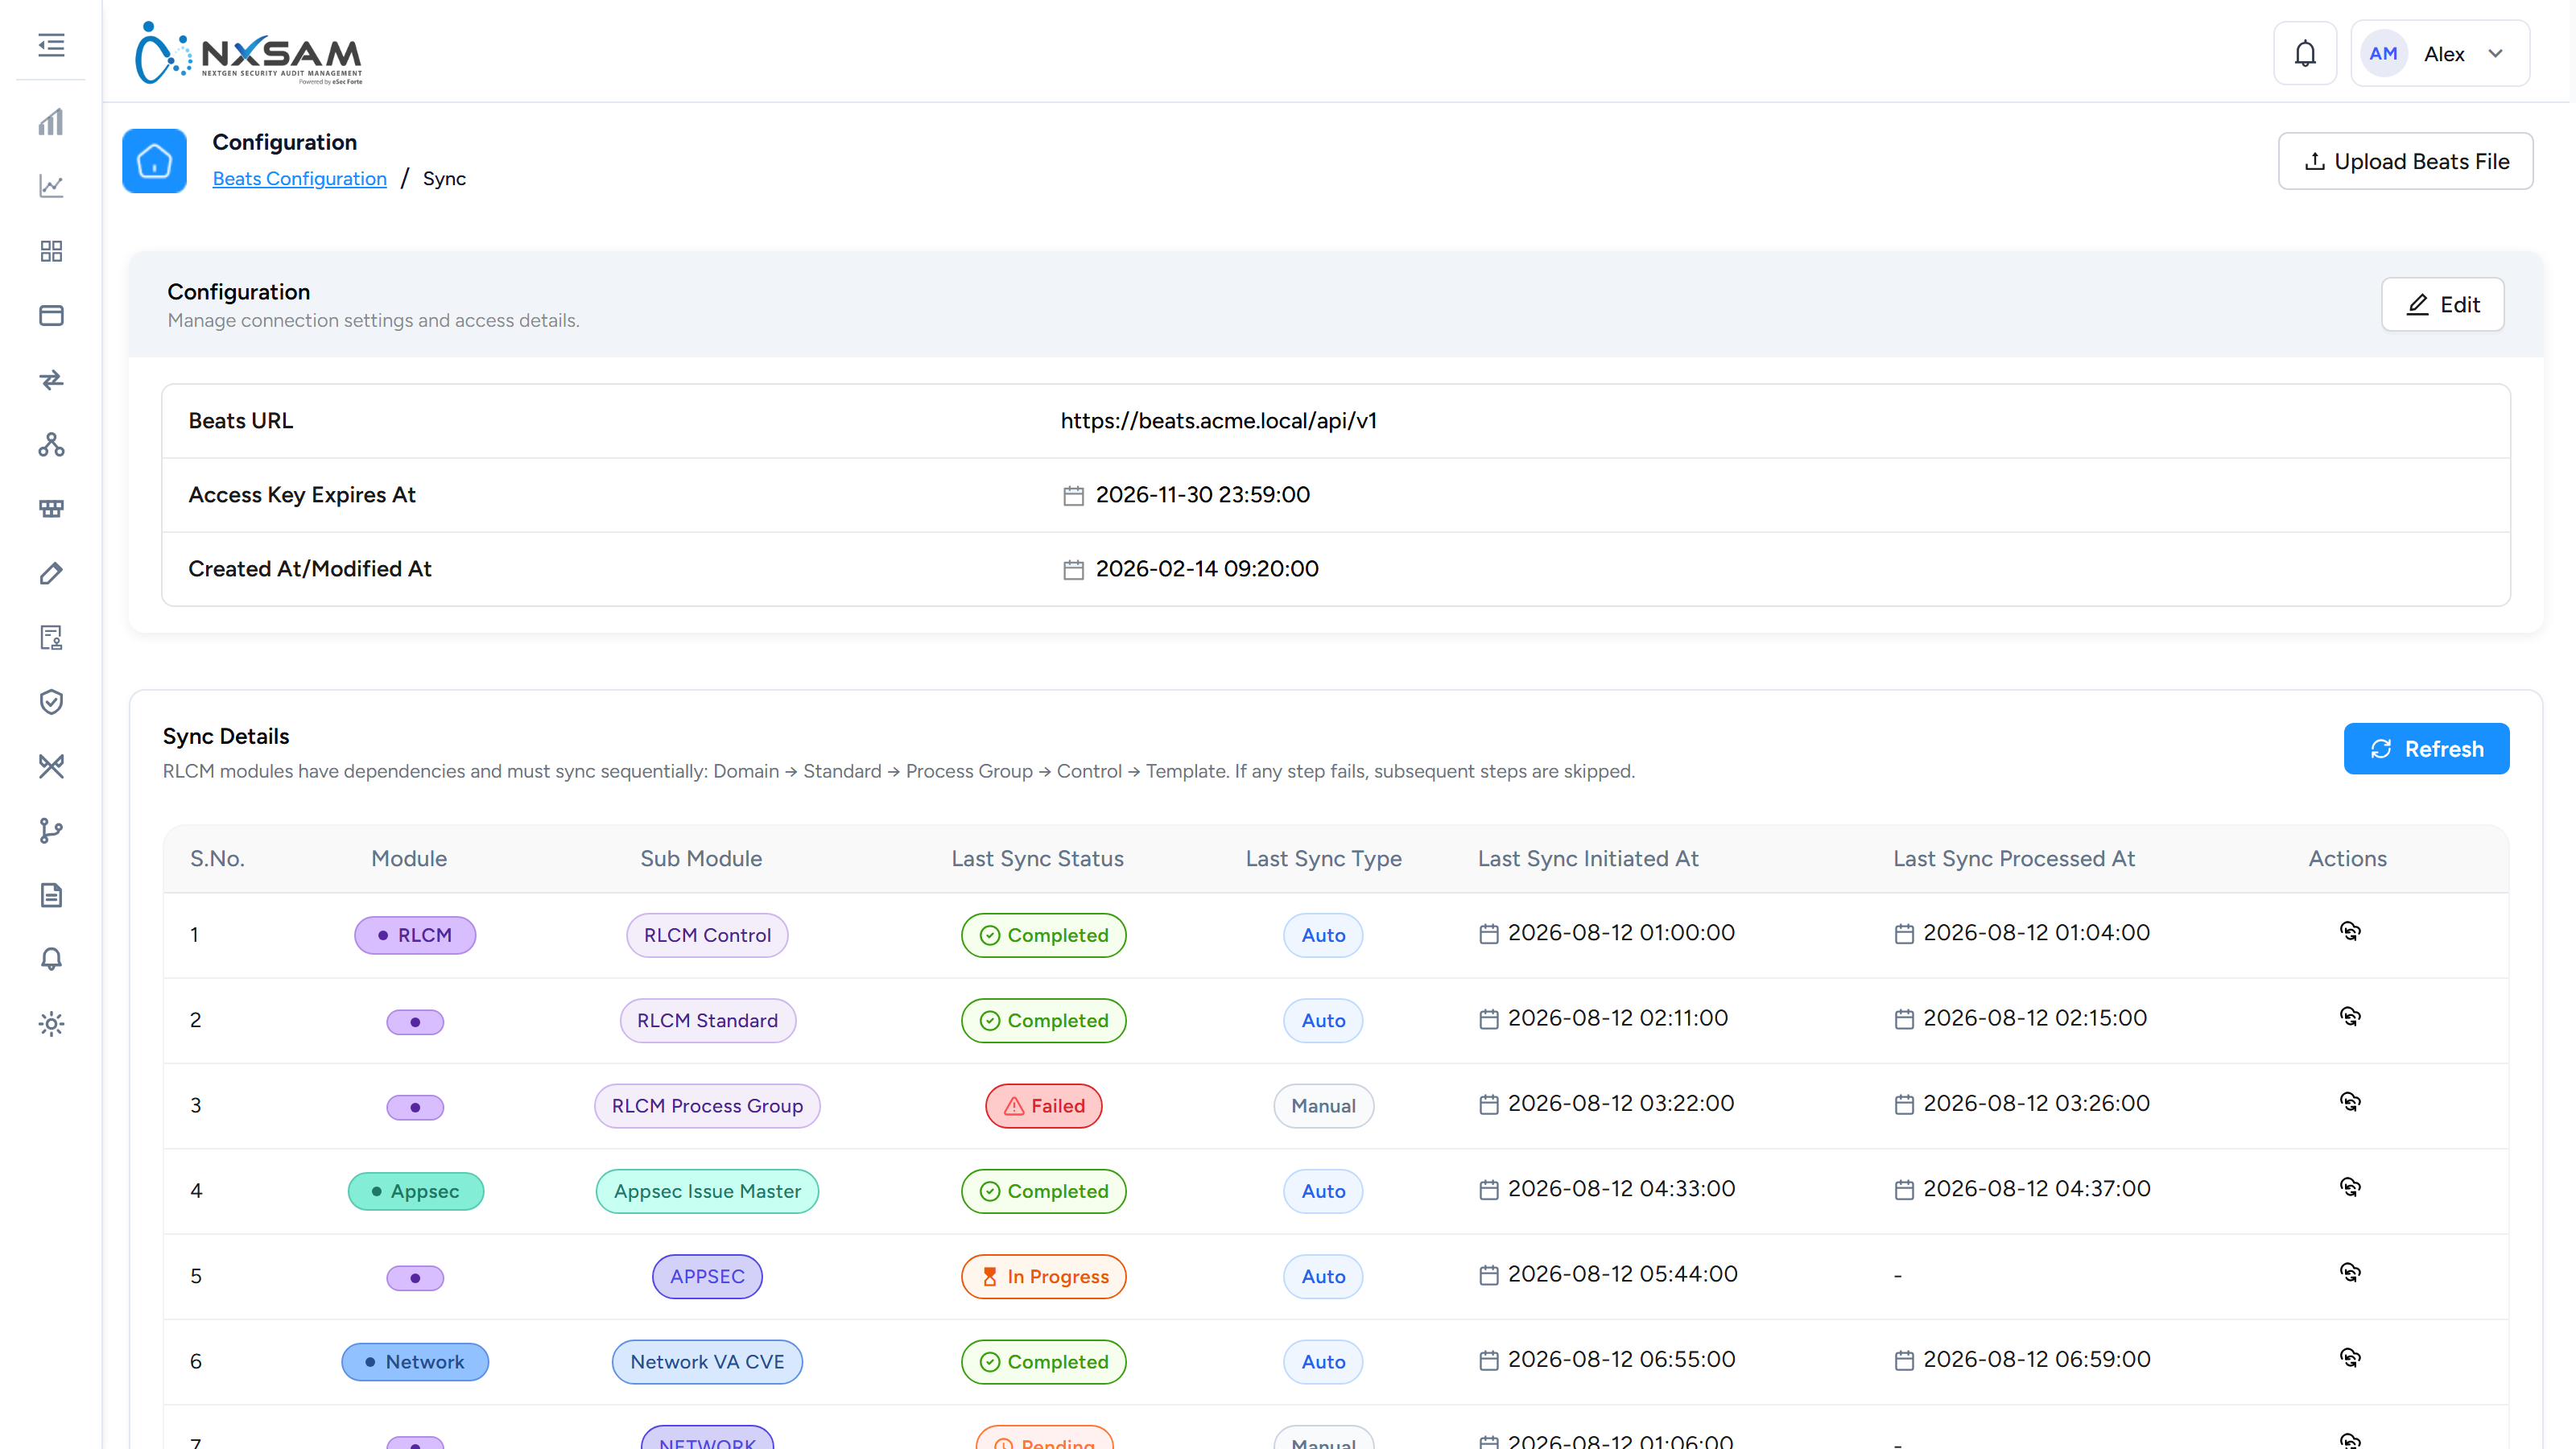
Server Status
Whether the platform's components are running.
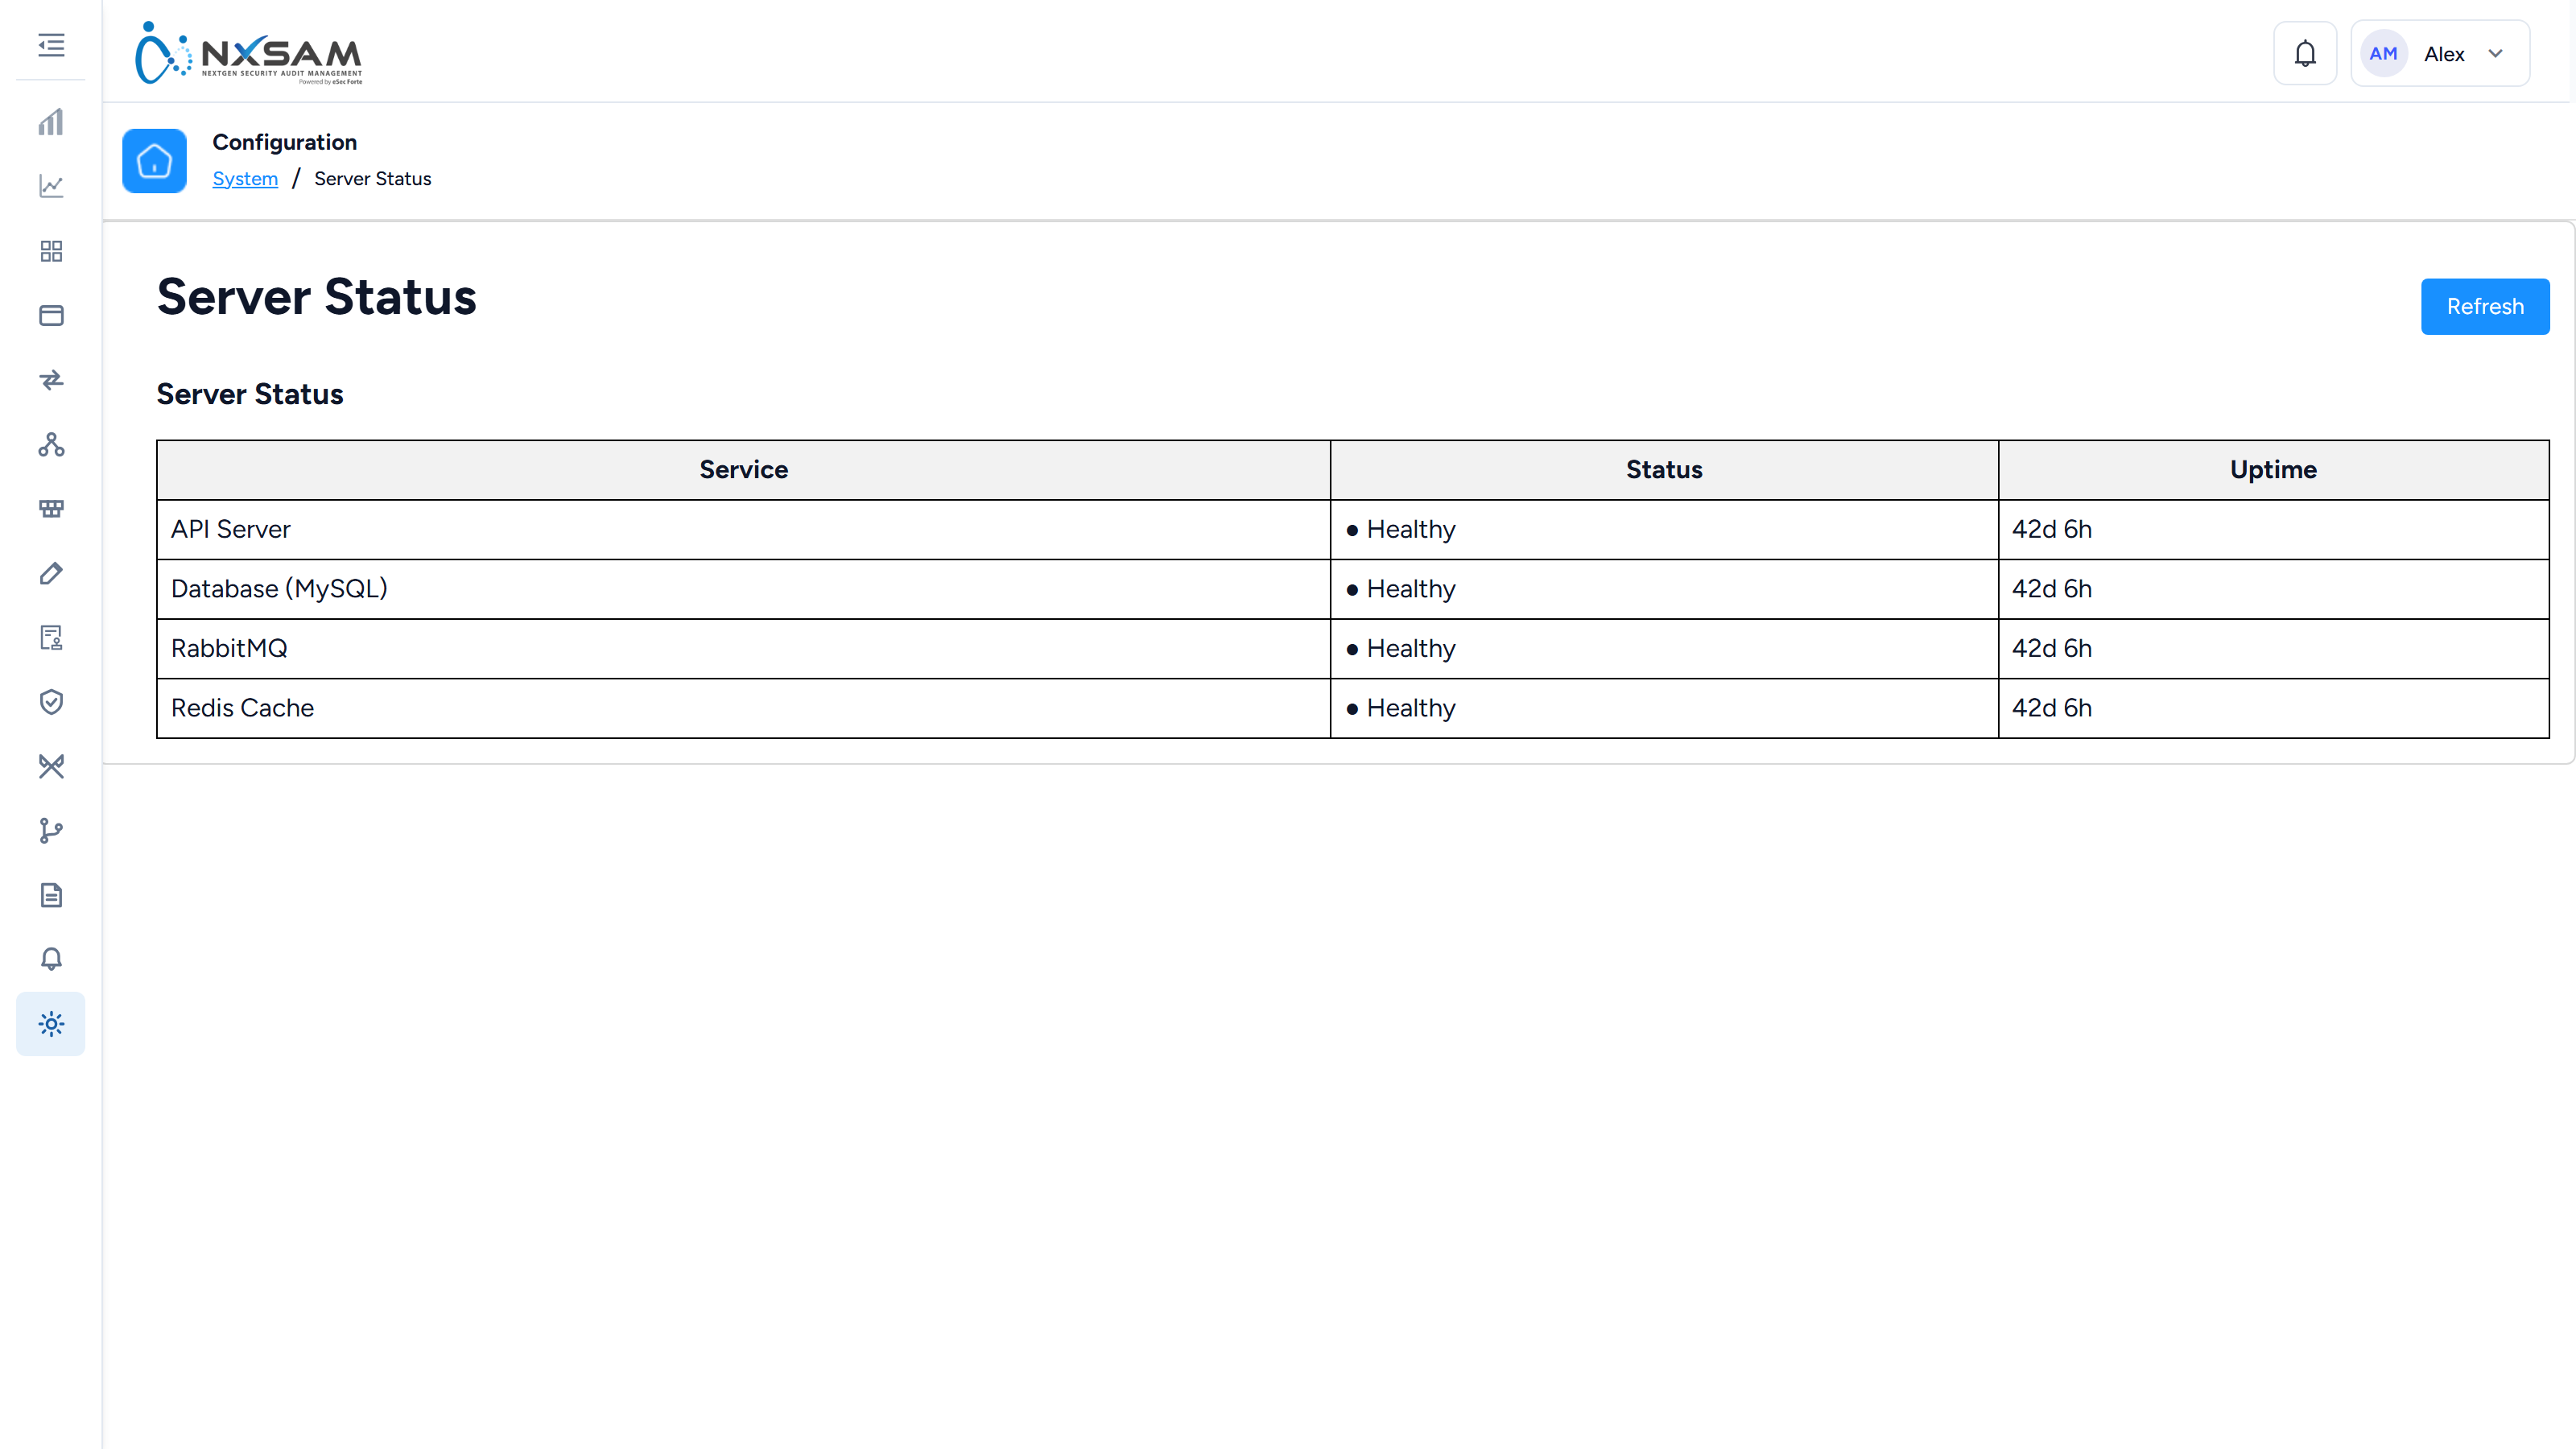
System Settings
The platform-wide switches: naming, mandatory fields, report contents, session behaviour. Changes here alter how every module behaves.
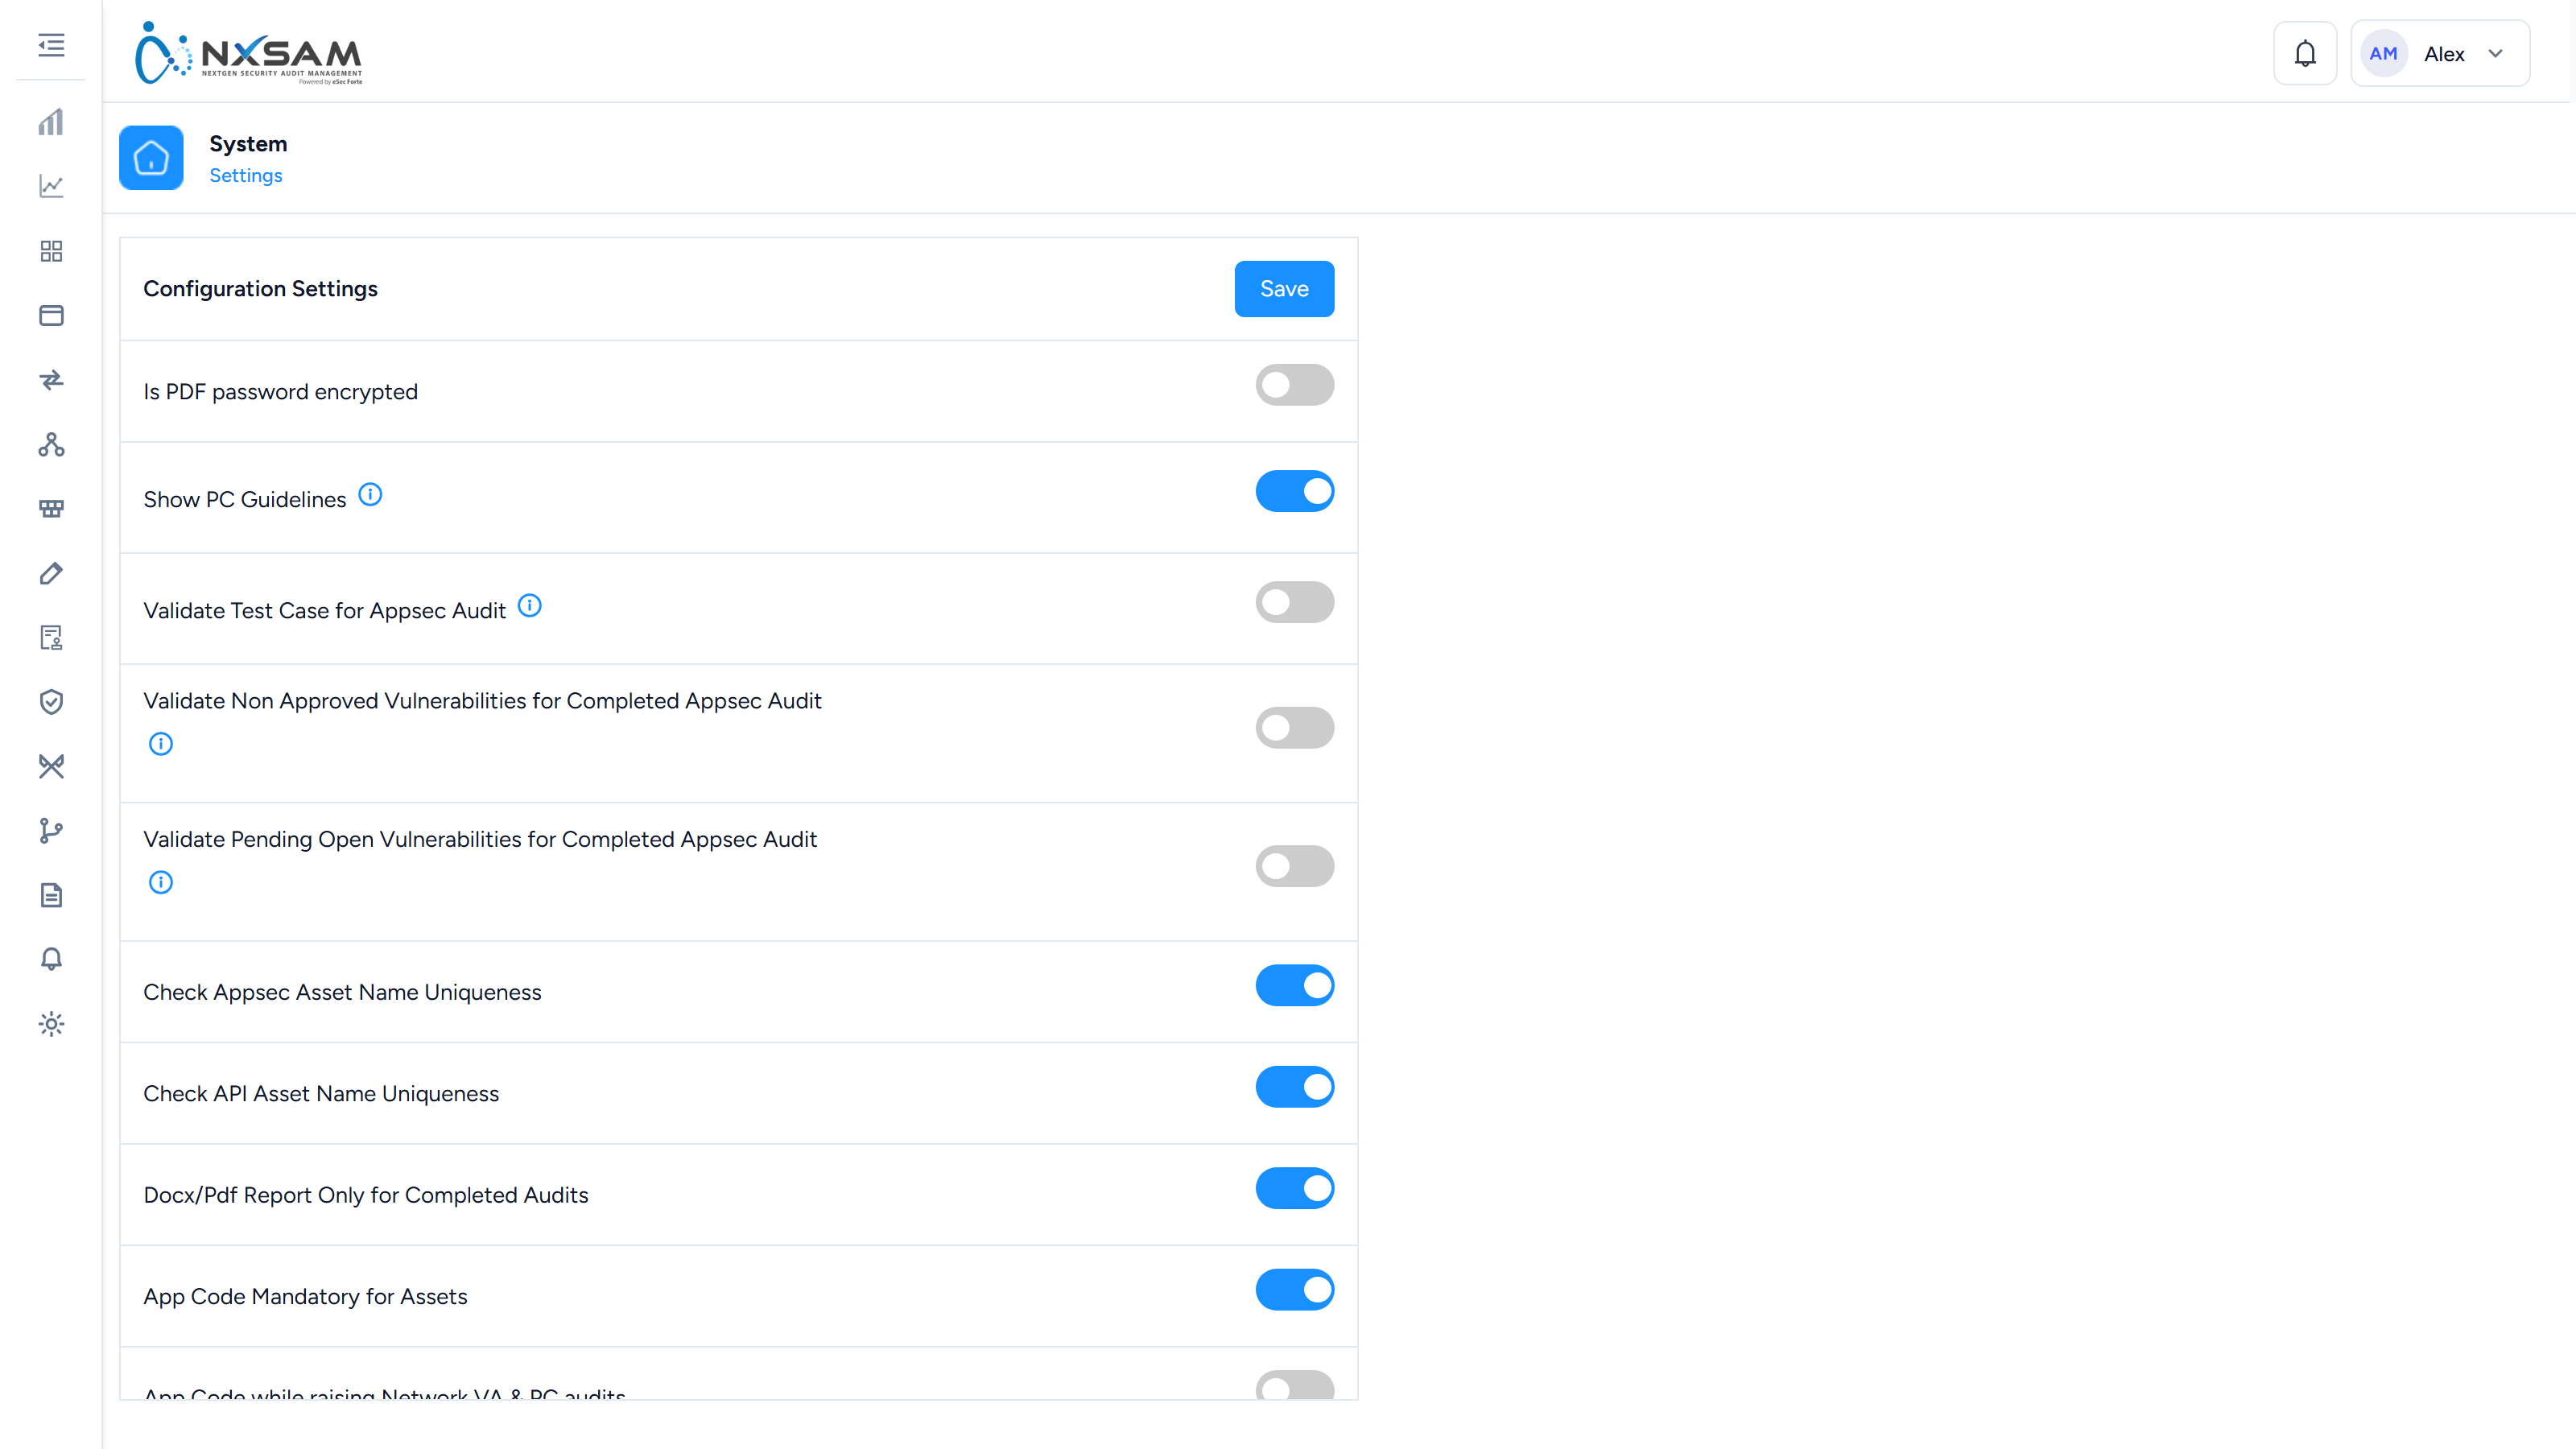
Tags
Free-form labels applied across assets and audits for grouping.
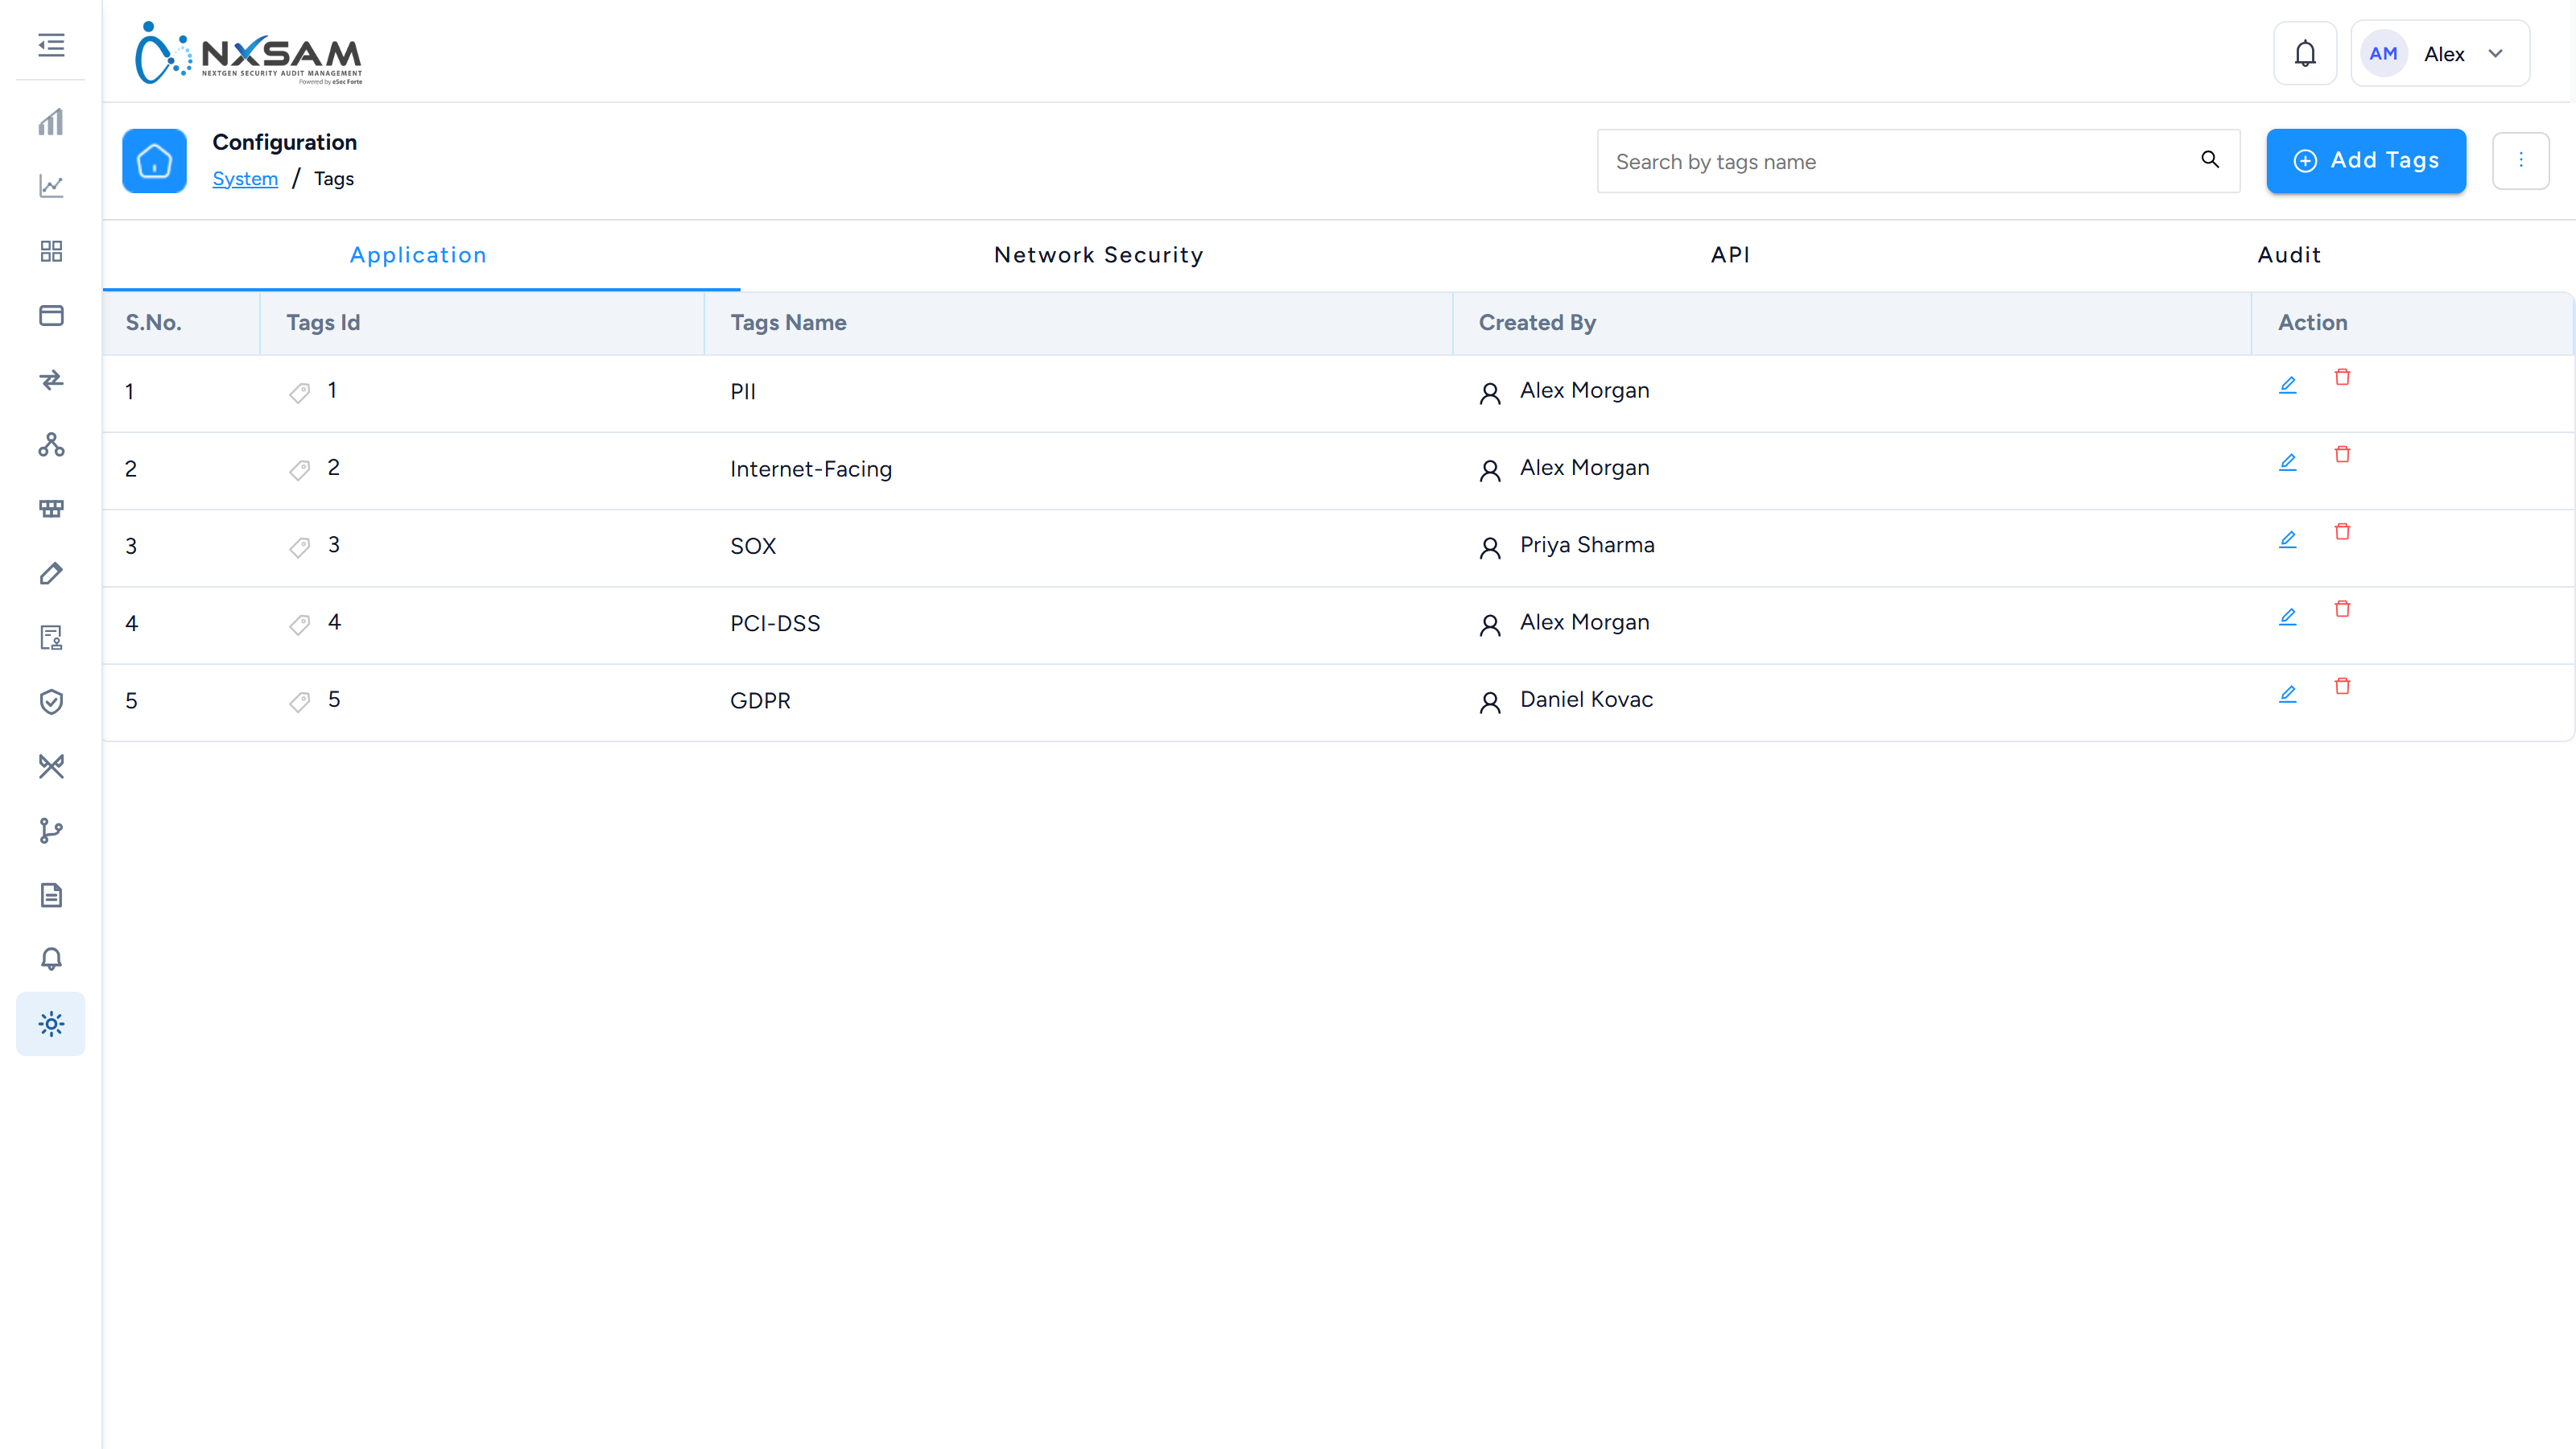
Task Detail
The detail behind one background job, including the error where one failed.
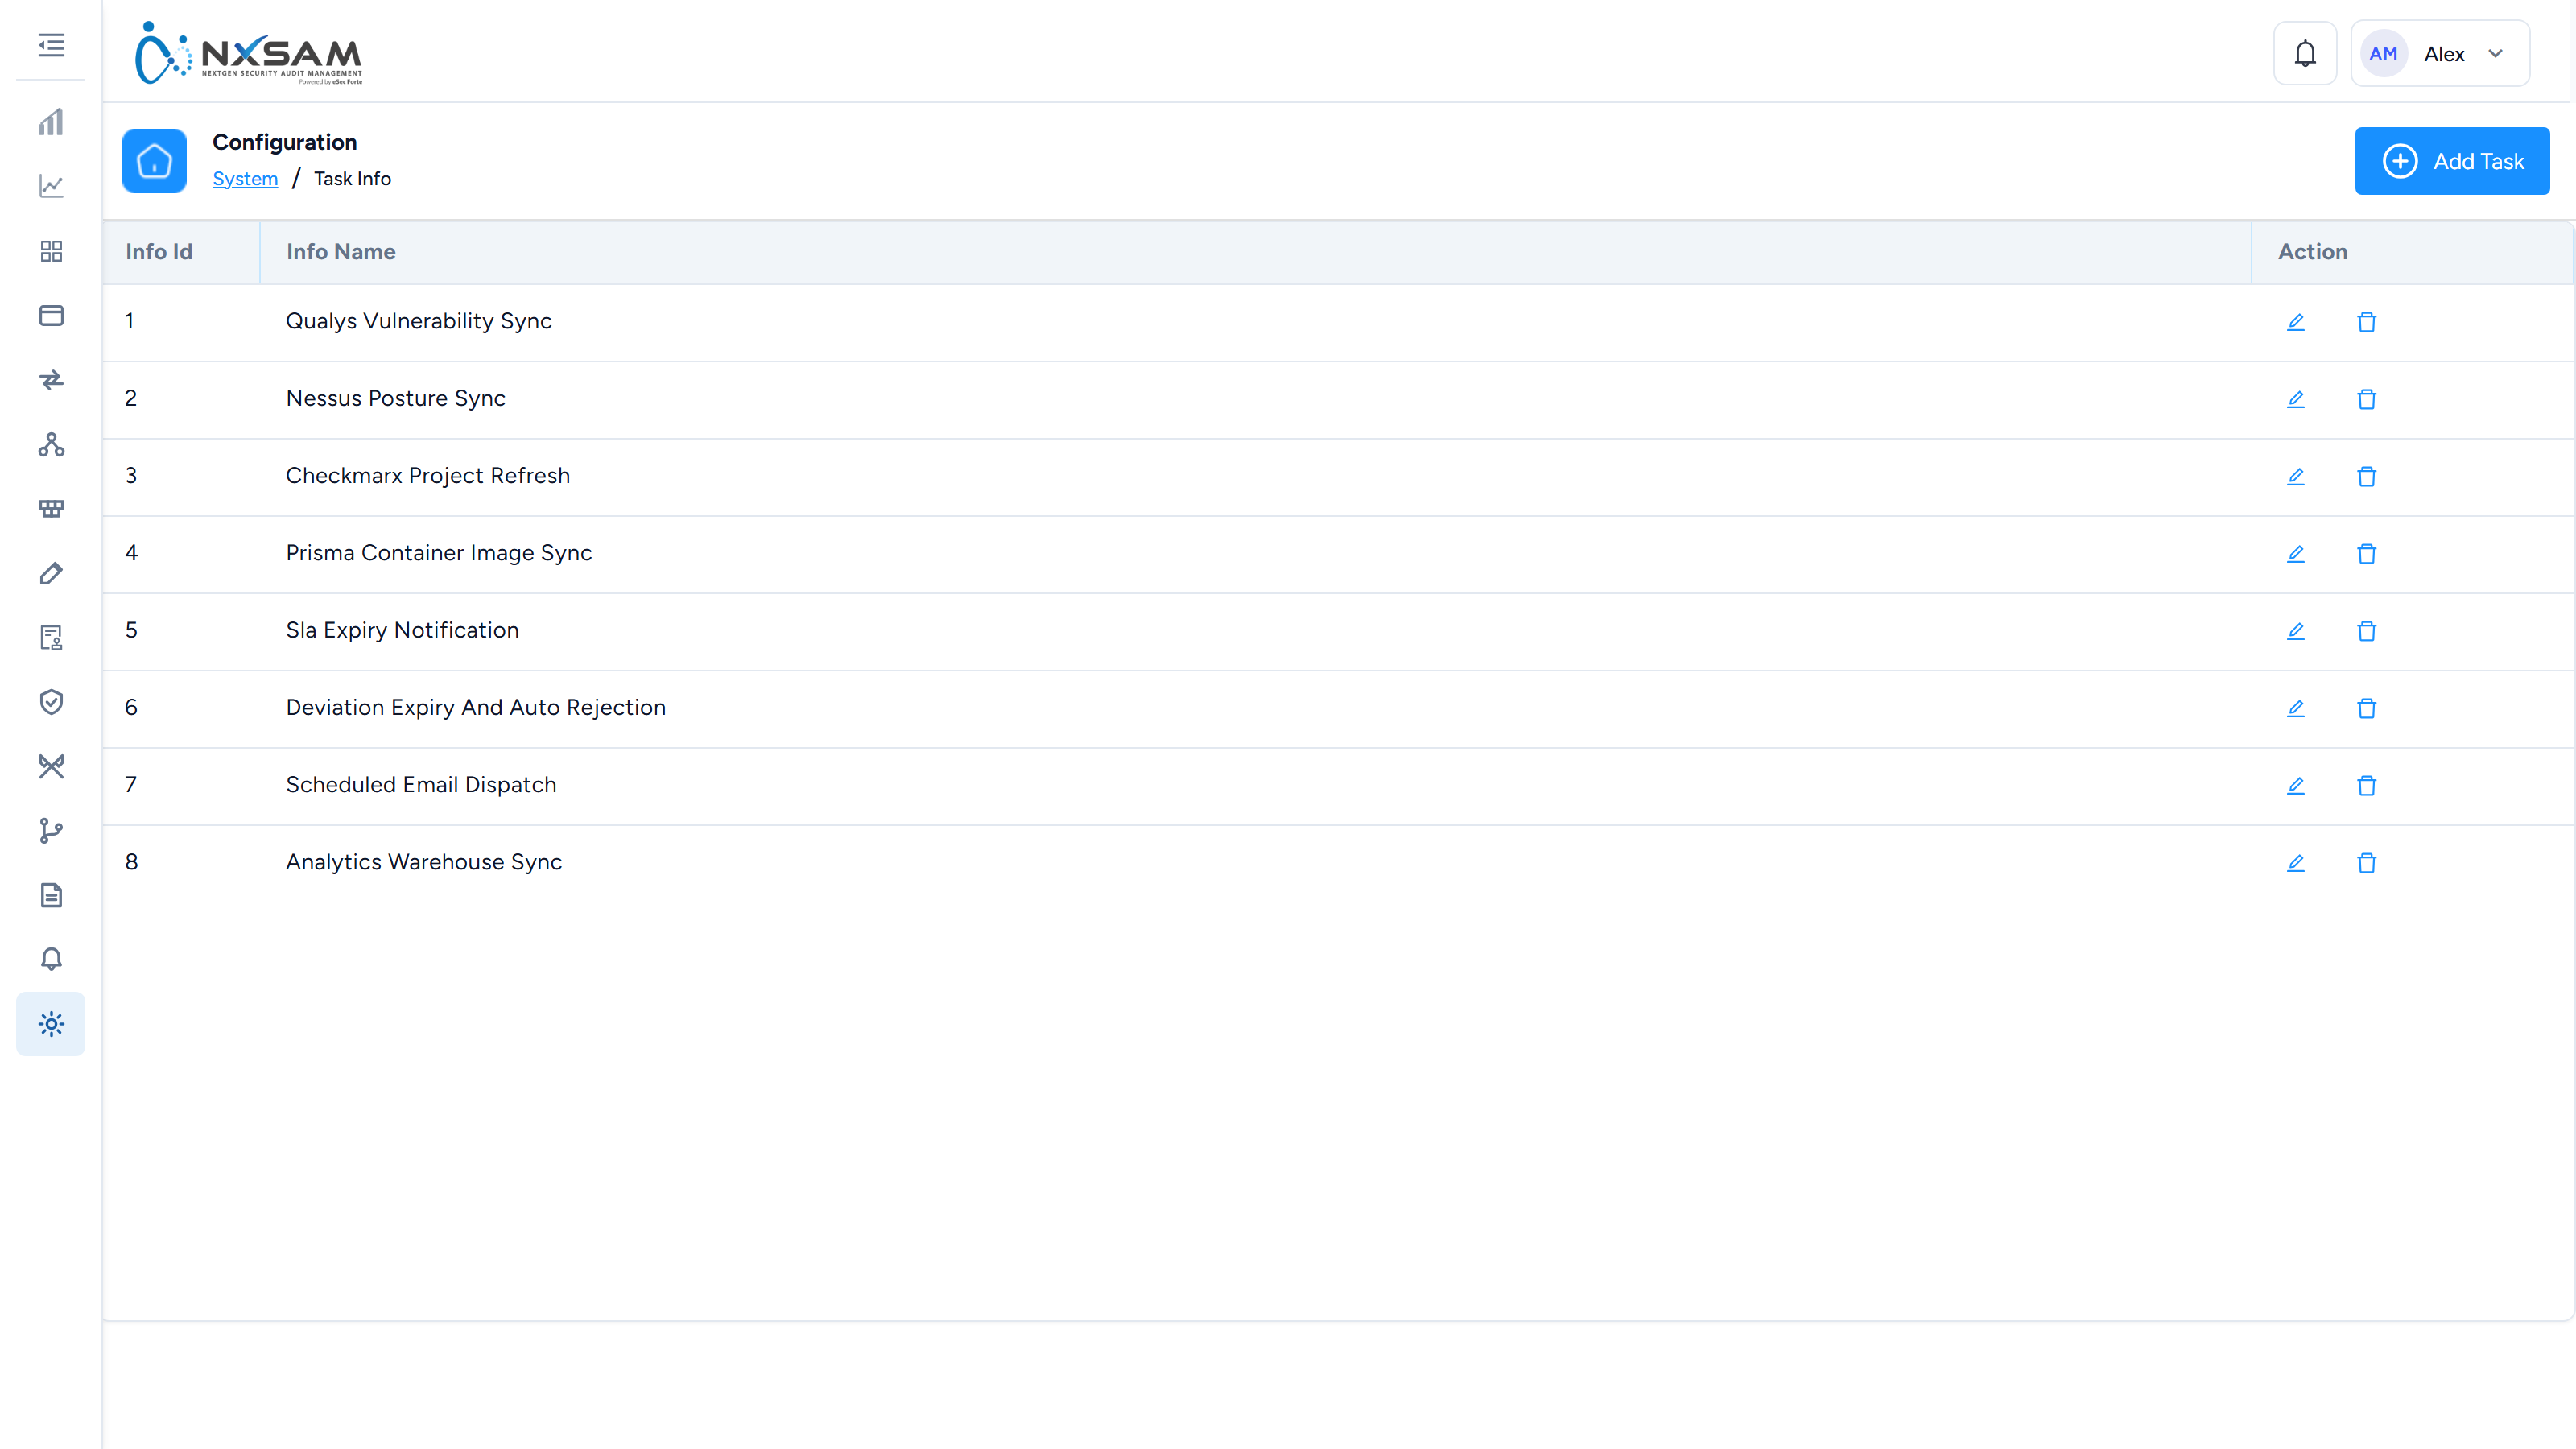
System & Health: support reference
Internal. The customer-facing explanation is in the screen reference.
These are the screens that tell you whether the platform itself is working. Reach for them when a symptom spans several modules — that pattern is almost never a module fault.
Symptom-to-screen
| Symptom | Look at |
|---|---|
| One module's data is stale, others fine | Beats — the job that maintains it |
| Figures wrong by a consistent interval | Beats — a stopped job, which reports no error anywhere else |
| An import "did nothing" | Import, including the child processes |
| Counts moved after a scan | Health Check |
| Notifications not arriving | Email logs, then the template's trigger and frequency |
| Nothing is processing at all | Process Manager |
| Sign-in failures for some users | Active Directory logs |
Beats
The periodic jobs that keep derived data current — SLA states as dates pass, pre-computed statistics.
Initiated At against Processed At is the pair that matters. A job initiated and never processed is stuck. A gap growing run on run is falling behind, and everything it maintains is increasingly stale.
Figures wrong by a fixed interval rather than randomly are almost always a stopped beat. Nothing in the product raises an error for it, which is why this screen exists.
Import child processes
One import spawns several processes, and the parent completing does not mean every child did. An import reporting success with fewer rows than expected usually has a failed child, visible only in the child view.
Health Check, and the match key
Health Check reconciles what a source reported against what NxSAM holds. Everything on it depends on Match Key — the field used to decide two findings are the same one.
High New and high Fixed with near-zero Repeated is a matching problem
That combination means findings are being seen as fixed and new rather than as the same finding twice. It is a matching-configuration problem, not data loss — and it looks exactly like data loss, which is why it escalates.
Re-open distinguishes a finding that came back from one that never left. A high re-open count against one asset usually means a fix that does not survive a rebuild.
Process Manager
Background work runs here. Logs is where a failure explains itself.
Restart is not free
A worker restarted mid-message leaves its job in progress with nothing consuming it — the job neither completes nor retries. Prefer letting a job finish, and check what is running before restarting.
Email
Two screens, two questions. Templates decide what is sent and when: a template that is active with no trigger sends nothing, and one with a daily frequency sends at its time rather than when the event occurred — which is why an SLA warning can arrive "a day late".
Email logs record what was actually attempted, with recipients. Added On is when the mail was queued, not delivered; a queued message that never sent points at the mail server.
Asset limits and SLA configuration
Both change behaviour without any data changing:
- Reaching an asset limit mid-import produces a partial inventory.
- Changing an SLA duration re-derives expiry dates, which can make a batch of findings overdue overnight with nothing else having happened.
Queries
Administrative operations bound to tasks. They are tooling rather than a working screen, and running one without knowing exactly what it does is not recoverable through the interface. Do not run one to explore.
What to collect before escalating
- Which modules are affected — one, or several.
- The relevant Beats entry, with both timestamps.
- For imports: the parent status and every child status.
- For count movements: the Health Check row, including Match Key and Classification.
- For notifications: the email log entry, and the template's trigger and frequency.