Tune the risk scoring rules
Setting → System → Analytics Risk Scoring holds the rules behind the Security Health Map and the Pending Risk Matrix. Every open finding is scored Likelihood × Impact, and this screen defines both axes, how remediation is graded, and where the charts draw their lines.
Nothing here is hard-coded. If the ranking does not match how your organisation actually prioritises work, this screen is where that is fixed — not a support request.
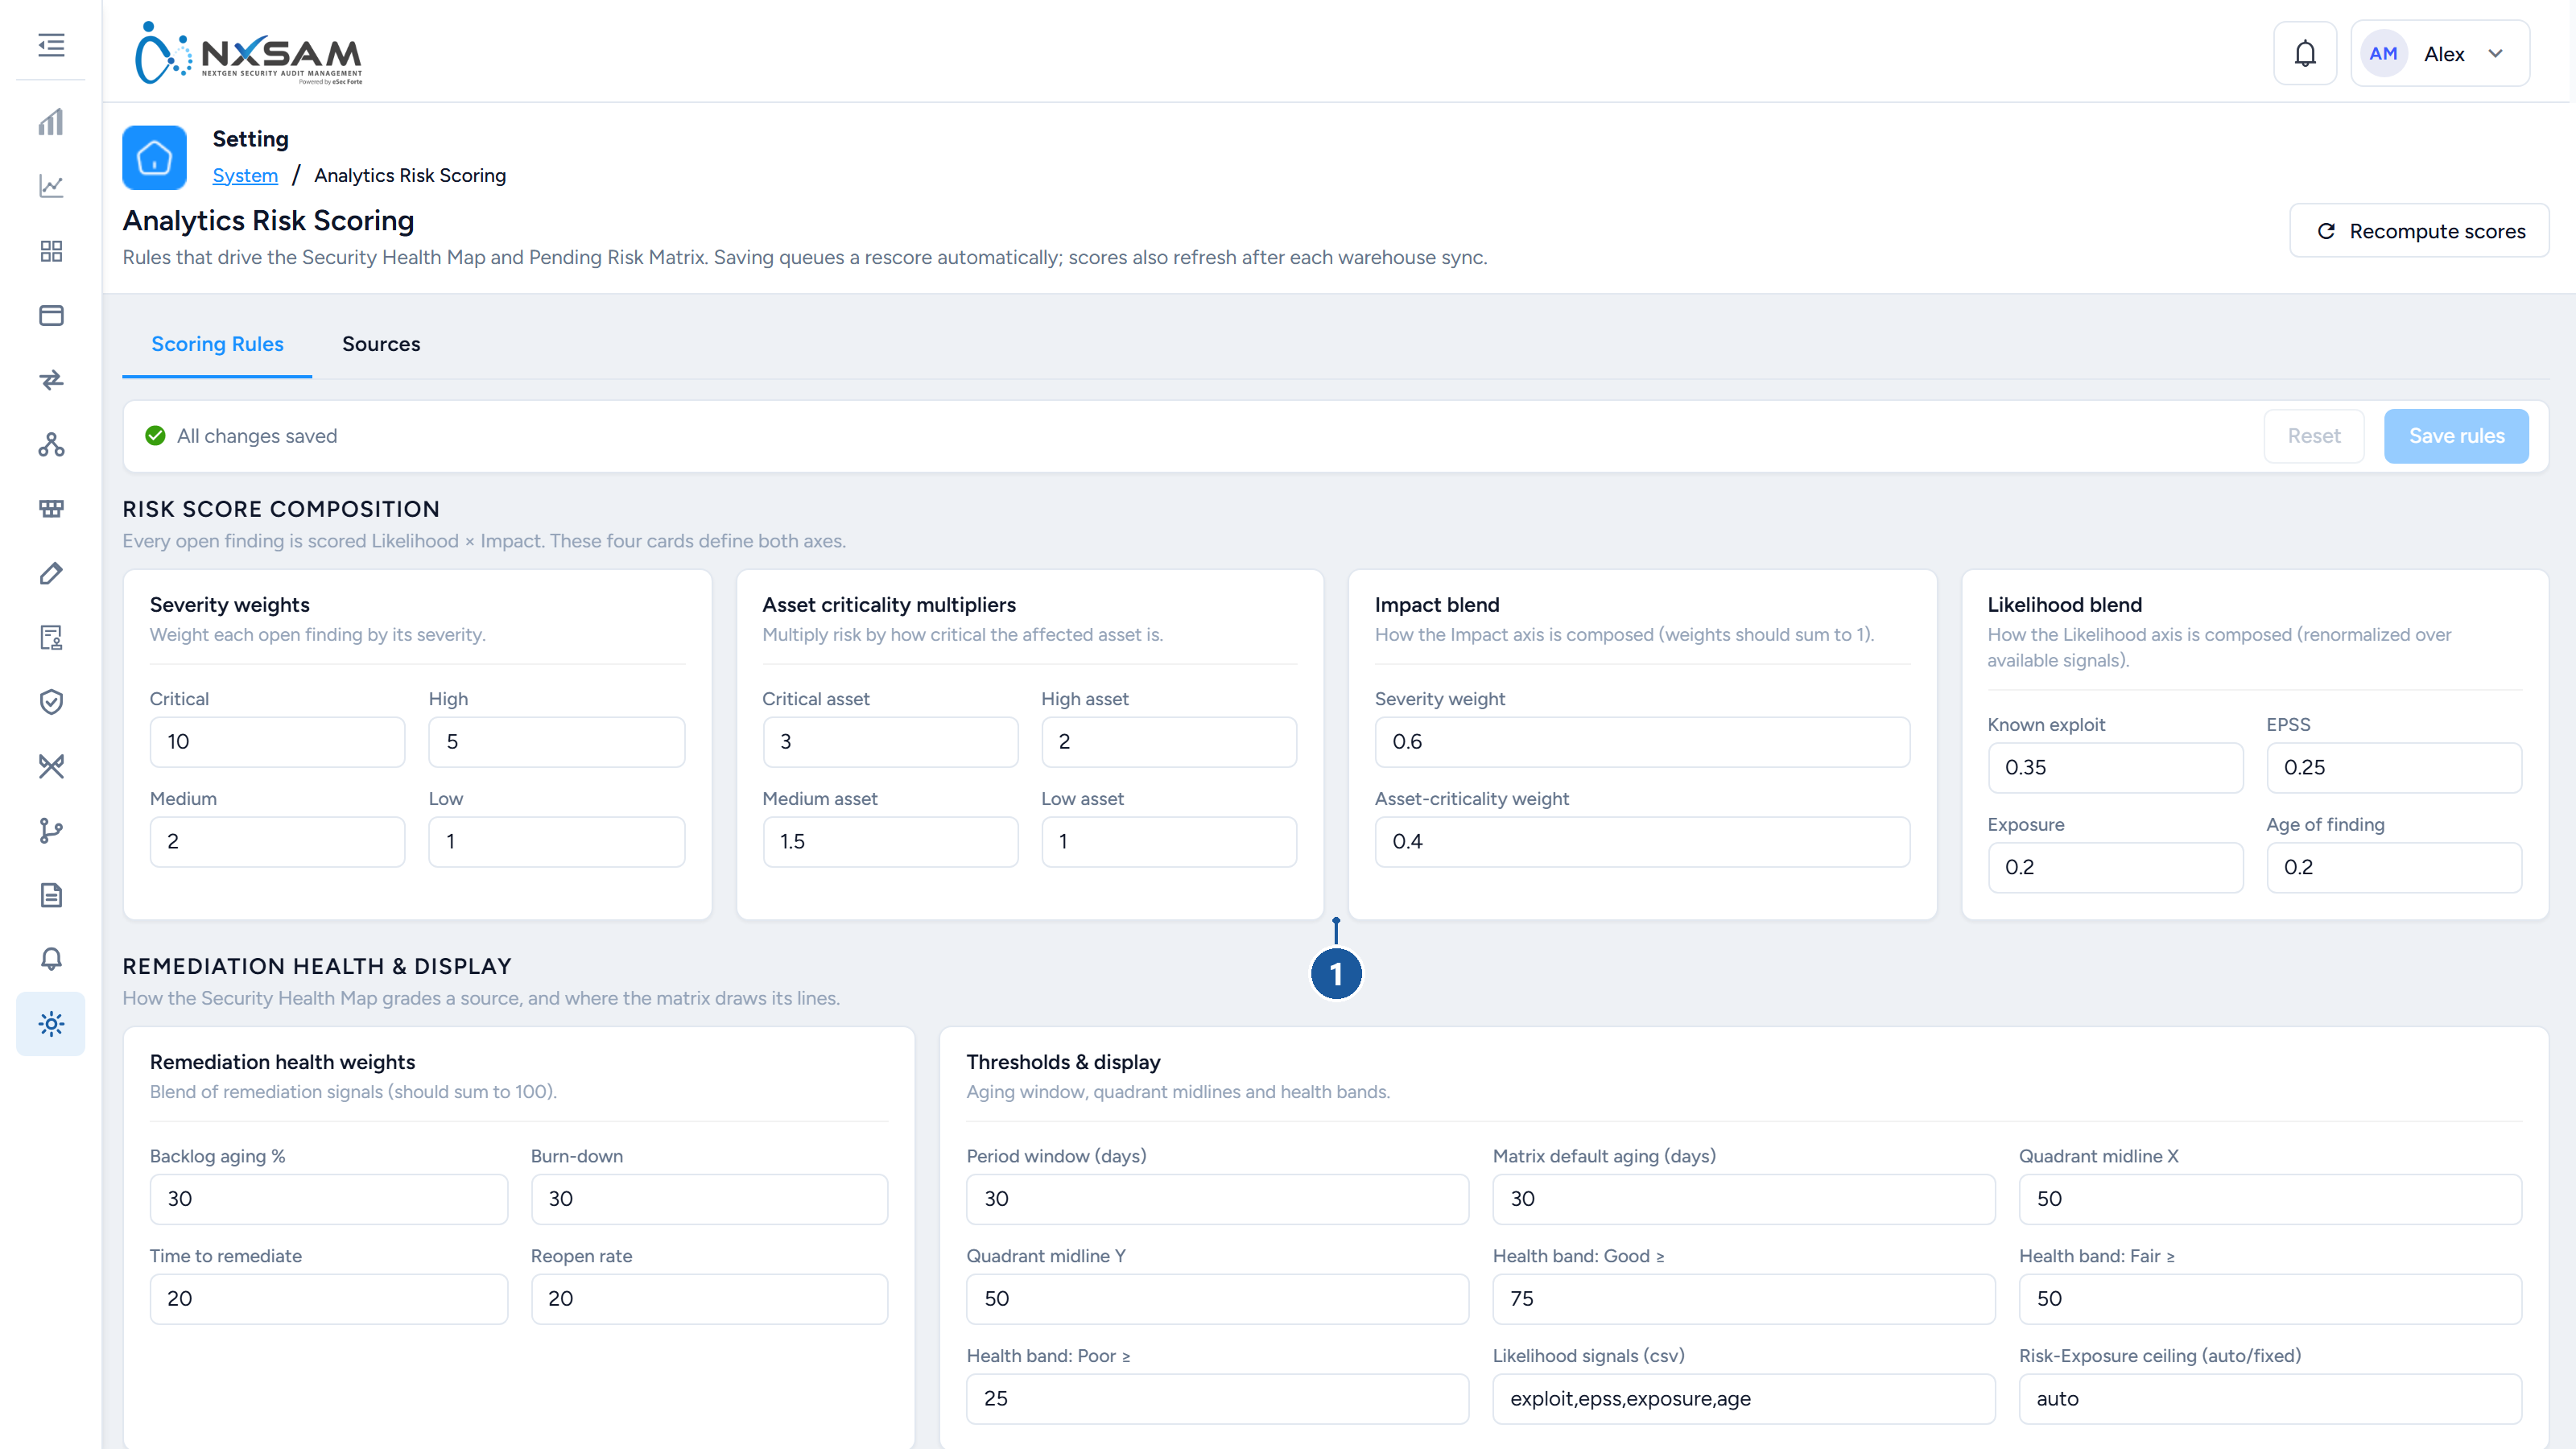
1 Likelihood × Impact — the two axes of the risk score
How the score is built
Four cards define the two axes.
Impact
Impact blends two things, and you choose the balance:
| Card | What it sets | Default |
|---|---|---|
| Severity weights | What each severity contributes | Critical 10 · High 5 · Medium 2 · Low 1 |
| Asset criticality multipliers | How much the affected asset's criticality multiplies the risk | Critical 3 · High 2 · Medium 1.5 · Low 1 |
| Impact blend | The split between the two above | Severity 0.6 · Asset criticality 0.4 |
The blend weights should sum to 1. Shift it toward asset criticality and a medium finding on a crown-jewel system outranks a high finding on a sandbox — which is usually what people mean when they say the ranking "does not reflect reality".
Asset criticality has to be set for this to mean anything
If criticality is unset across the estate, every multiplier is the same and the Impact axis collapses to severity with extra steps. The scoring rules are not the fix for that; populating asset criticality is.
Likelihood
Likelihood blend distributes weight across four signals — defaults in brackets:
- Known exploit (0.35) — a public exploit exists for this vulnerability
- EPSS (0.25) — the published probability of exploitation in the wild
- Exposure (0.20) — how reachable the affected asset is
- Age of finding (0.20) — how long it has been open
The weights are renormalised over whichever signals are available, which matters more than it sounds. A finding with no EPSS score does not silently score lower; its remaining signals are rescaled to fill the gap. That is why a mixed estate, where only some sources carry exploit data, still ranks sensibly.
Likelihood signals on the Thresholds card names which signals participate at all, comma separated. Removing one there is different from setting its weight to zero: a removed signal is excluded from the renormalisation entirely.
Remediation health
The Security Health Map grades each source on how well findings are actually being closed, not just how many exist. Remediation health weights blends four signals and should sum to 100 — defaults are 30 / 30 / 20 / 20:
| Signal | What it measures |
|---|---|
| Backlog aging % | How much of the open backlog is old |
| Burn-down | Whether the backlog is shrinking |
| Time to remediate | How long closure takes |
| Reopen rate | How often a closed finding comes back |
Reopen rate is the one worth raising if closures are being recorded optimistically: a team that closes quickly and reopens constantly scores well on the first three and badly on the fourth.
Thresholds and display
These do not change any score. They change where the charts draw their lines, which changes what people conclude from the same numbers.
| Setting | Effect | Default |
|---|---|---|
| Period window (days) | The window burn-down and time-to-remediate are measured over | 30 |
| Matrix default aging (days) | The ageing cut the Pending Risk Matrix opens on | 30 |
| Quadrant midline X / Y | Where the matrix splits into quadrants | 50 / 50 |
| Health band: Good ≥ | The score at or above which a source is Good | 75 |
| Health band: Fair ≥ | Fair | 50 |
| Health band: Poor ≥ | Poor; below this is the worst band | 25 |
| Risk-Exposure ceiling | auto scales the exposure axis to your data; fixed pins it |
auto |
Moving a midline moves sources between quadrants
Nothing was rescored, but a source that was in the acceptable quadrant yesterday can be in the attention quadrant today. If the health map changes character overnight and no data changed, this screen is the first place to look.
Sources: what gets scored, and by which rules
The Sources tab lists every scanner and tool discovered in your data.
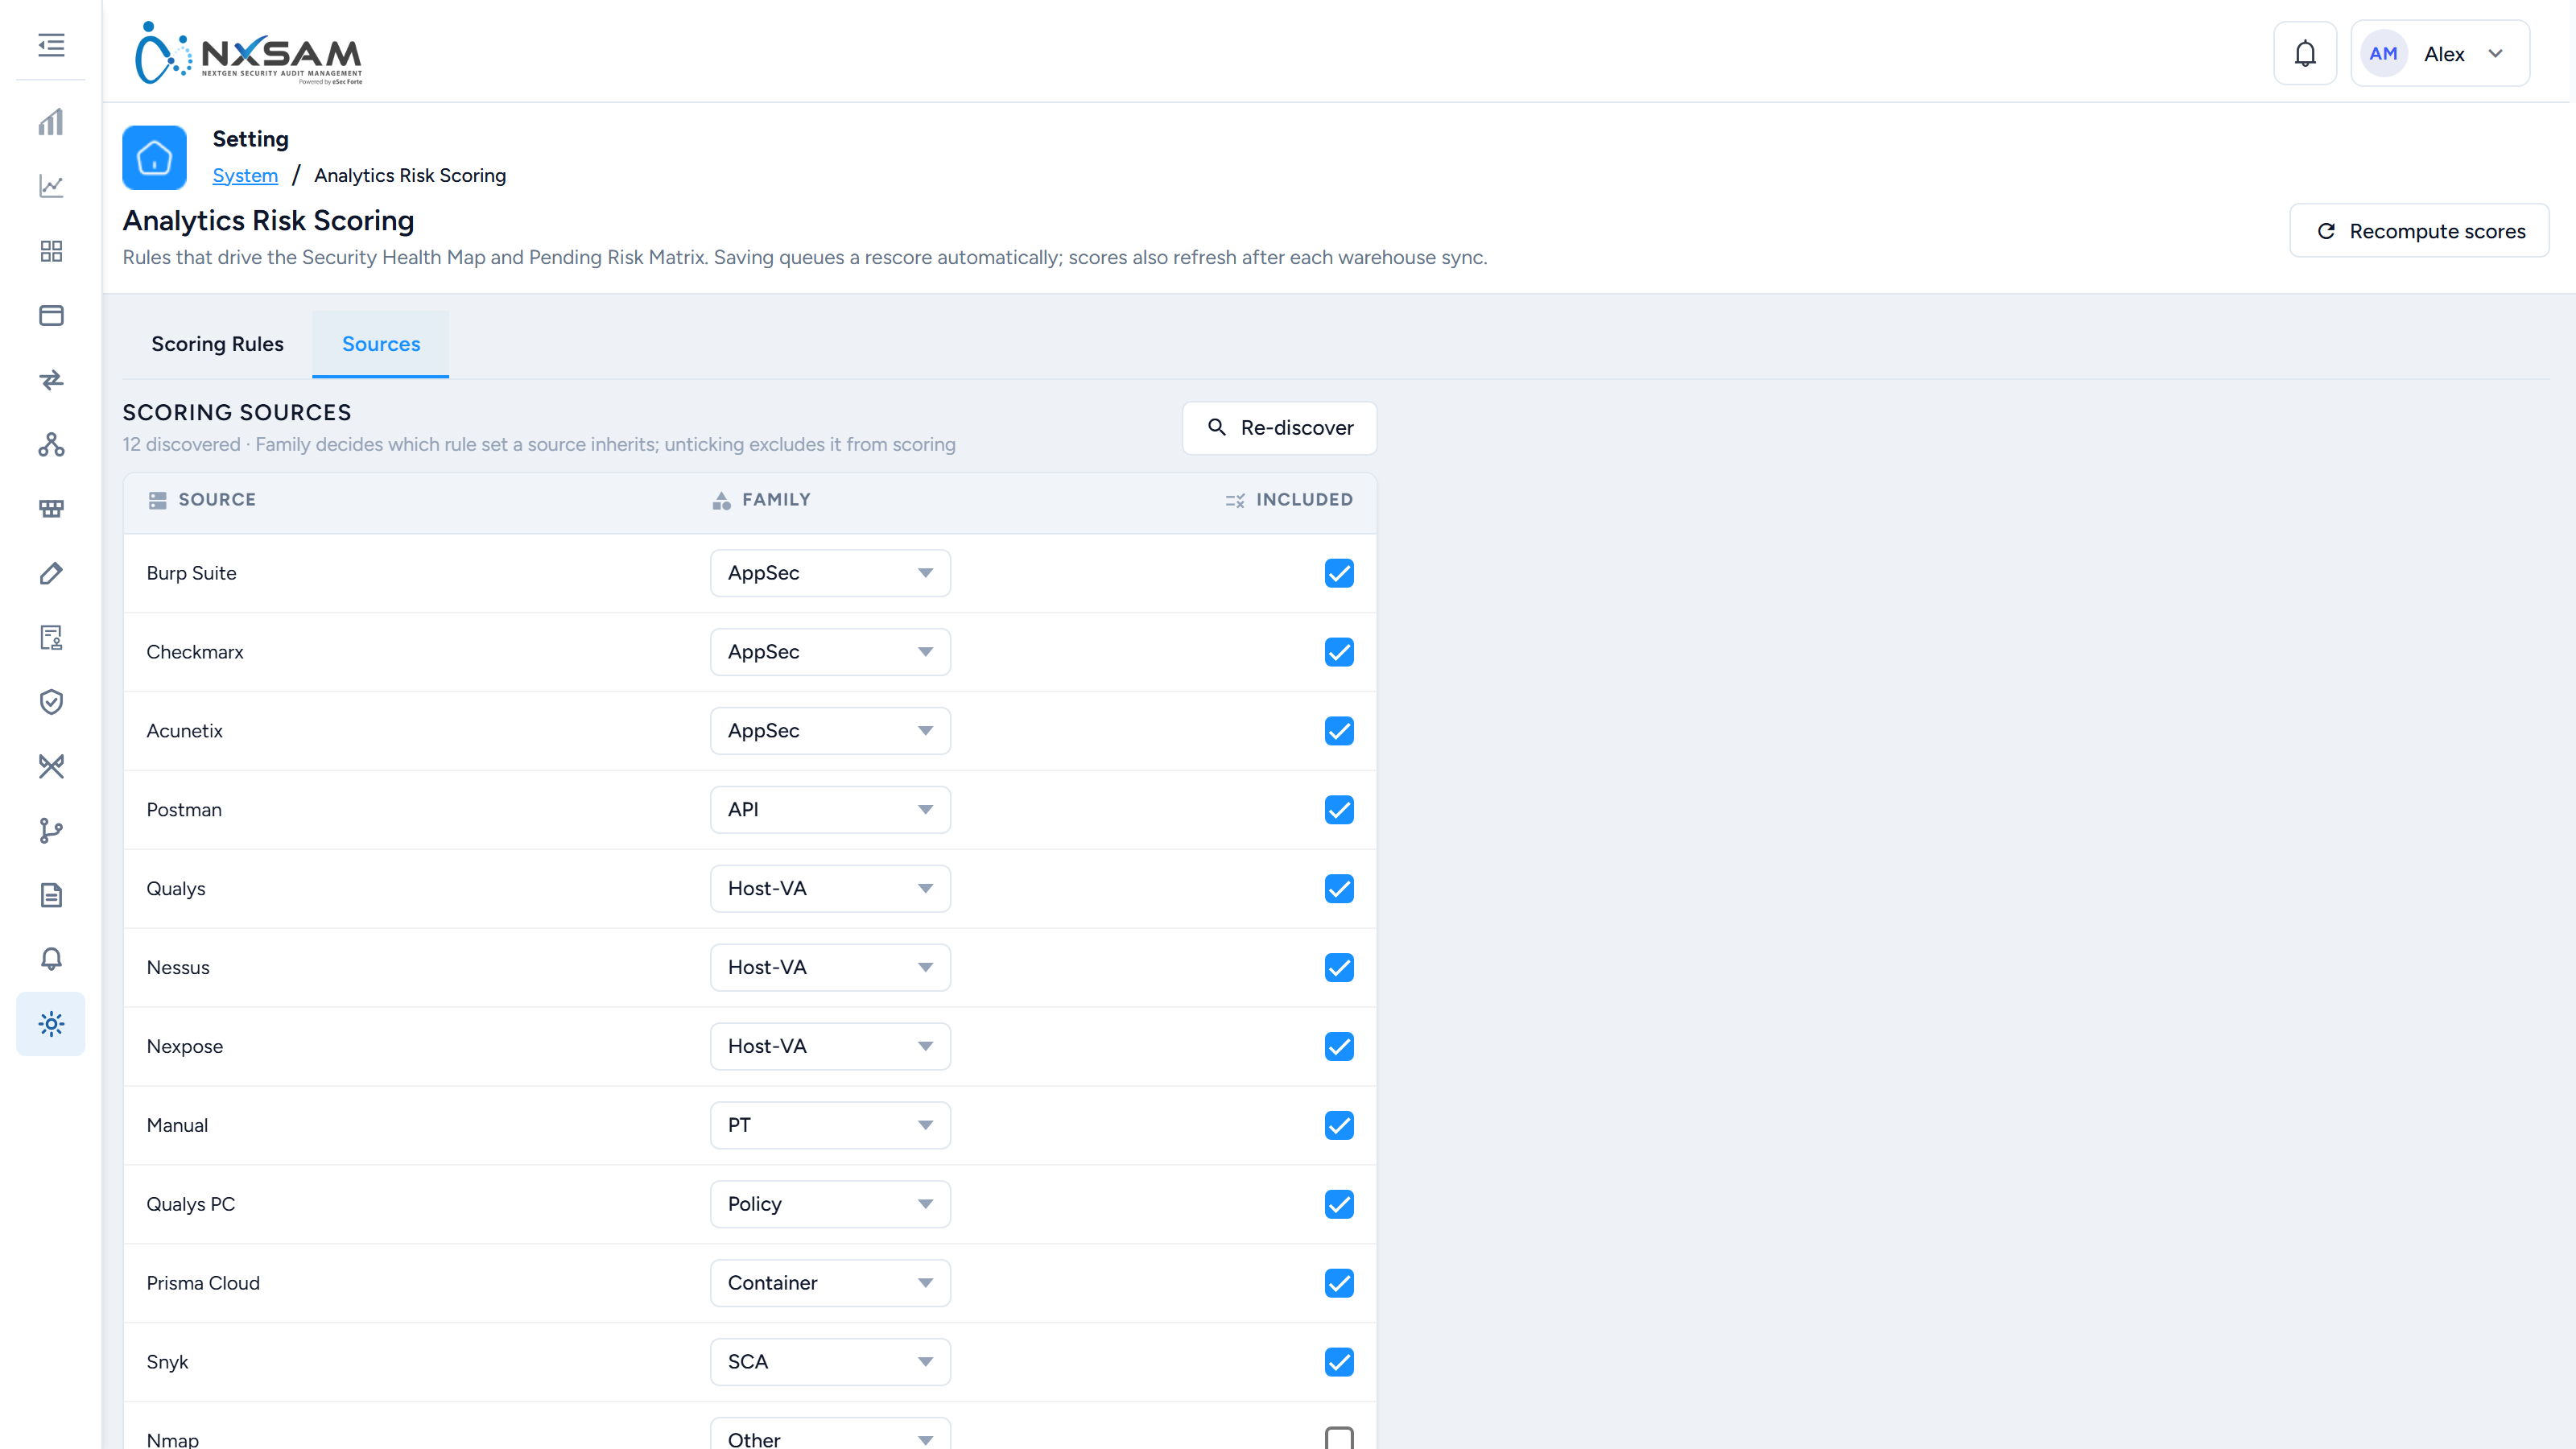
Each row has two controls:
- Family decides which rule set the source inherits: AppSec, Host-VA, PT, Policy, SCA, API, Container or Other. Families are assigned automatically from the shape of the data, and the assignment is a starting point rather than a verdict — change it where you disagree.
- Included takes the source out of scoring entirely when unticked. Use it for a tool whose findings are informational, or one being trialled, so it stops distorting the health map without anyone having to delete its data.
Re-discover rescans for sources that have appeared since. A tool integrated last week will not be scored until it has been discovered.
Saving, and when the numbers change
The bar above the rules shows either All changes saved or a count of unsaved changes, and each changed field is marked while you edit. Reset discards them; Save rules commits.
Saving queues a rescore automatically — you do not have to trigger one. Scores also refresh after each warehouse sync. Recompute scores rebuilds every score without changing a rule, which is what you want after correcting asset criticality or importing a backlog of findings.
A rescore is not instant on a large estate. If one is already running, a second request is told so rather than queueing behind it.
If the screen says no rules were found
The default rule set has not been seeded in that environment. The screen is doing the right thing by saying so rather than showing every input at zero, which would read as a configuration where nothing counts. Raise it with whoever provisions the environment.