Reading the Application Security screens
Both screens pack a lot into each row, and most of it is unlabelled — the chips, dots and bars all carry meaning that is not written on screen. This page names every element and says what it is telling you.
The audit list, row by row
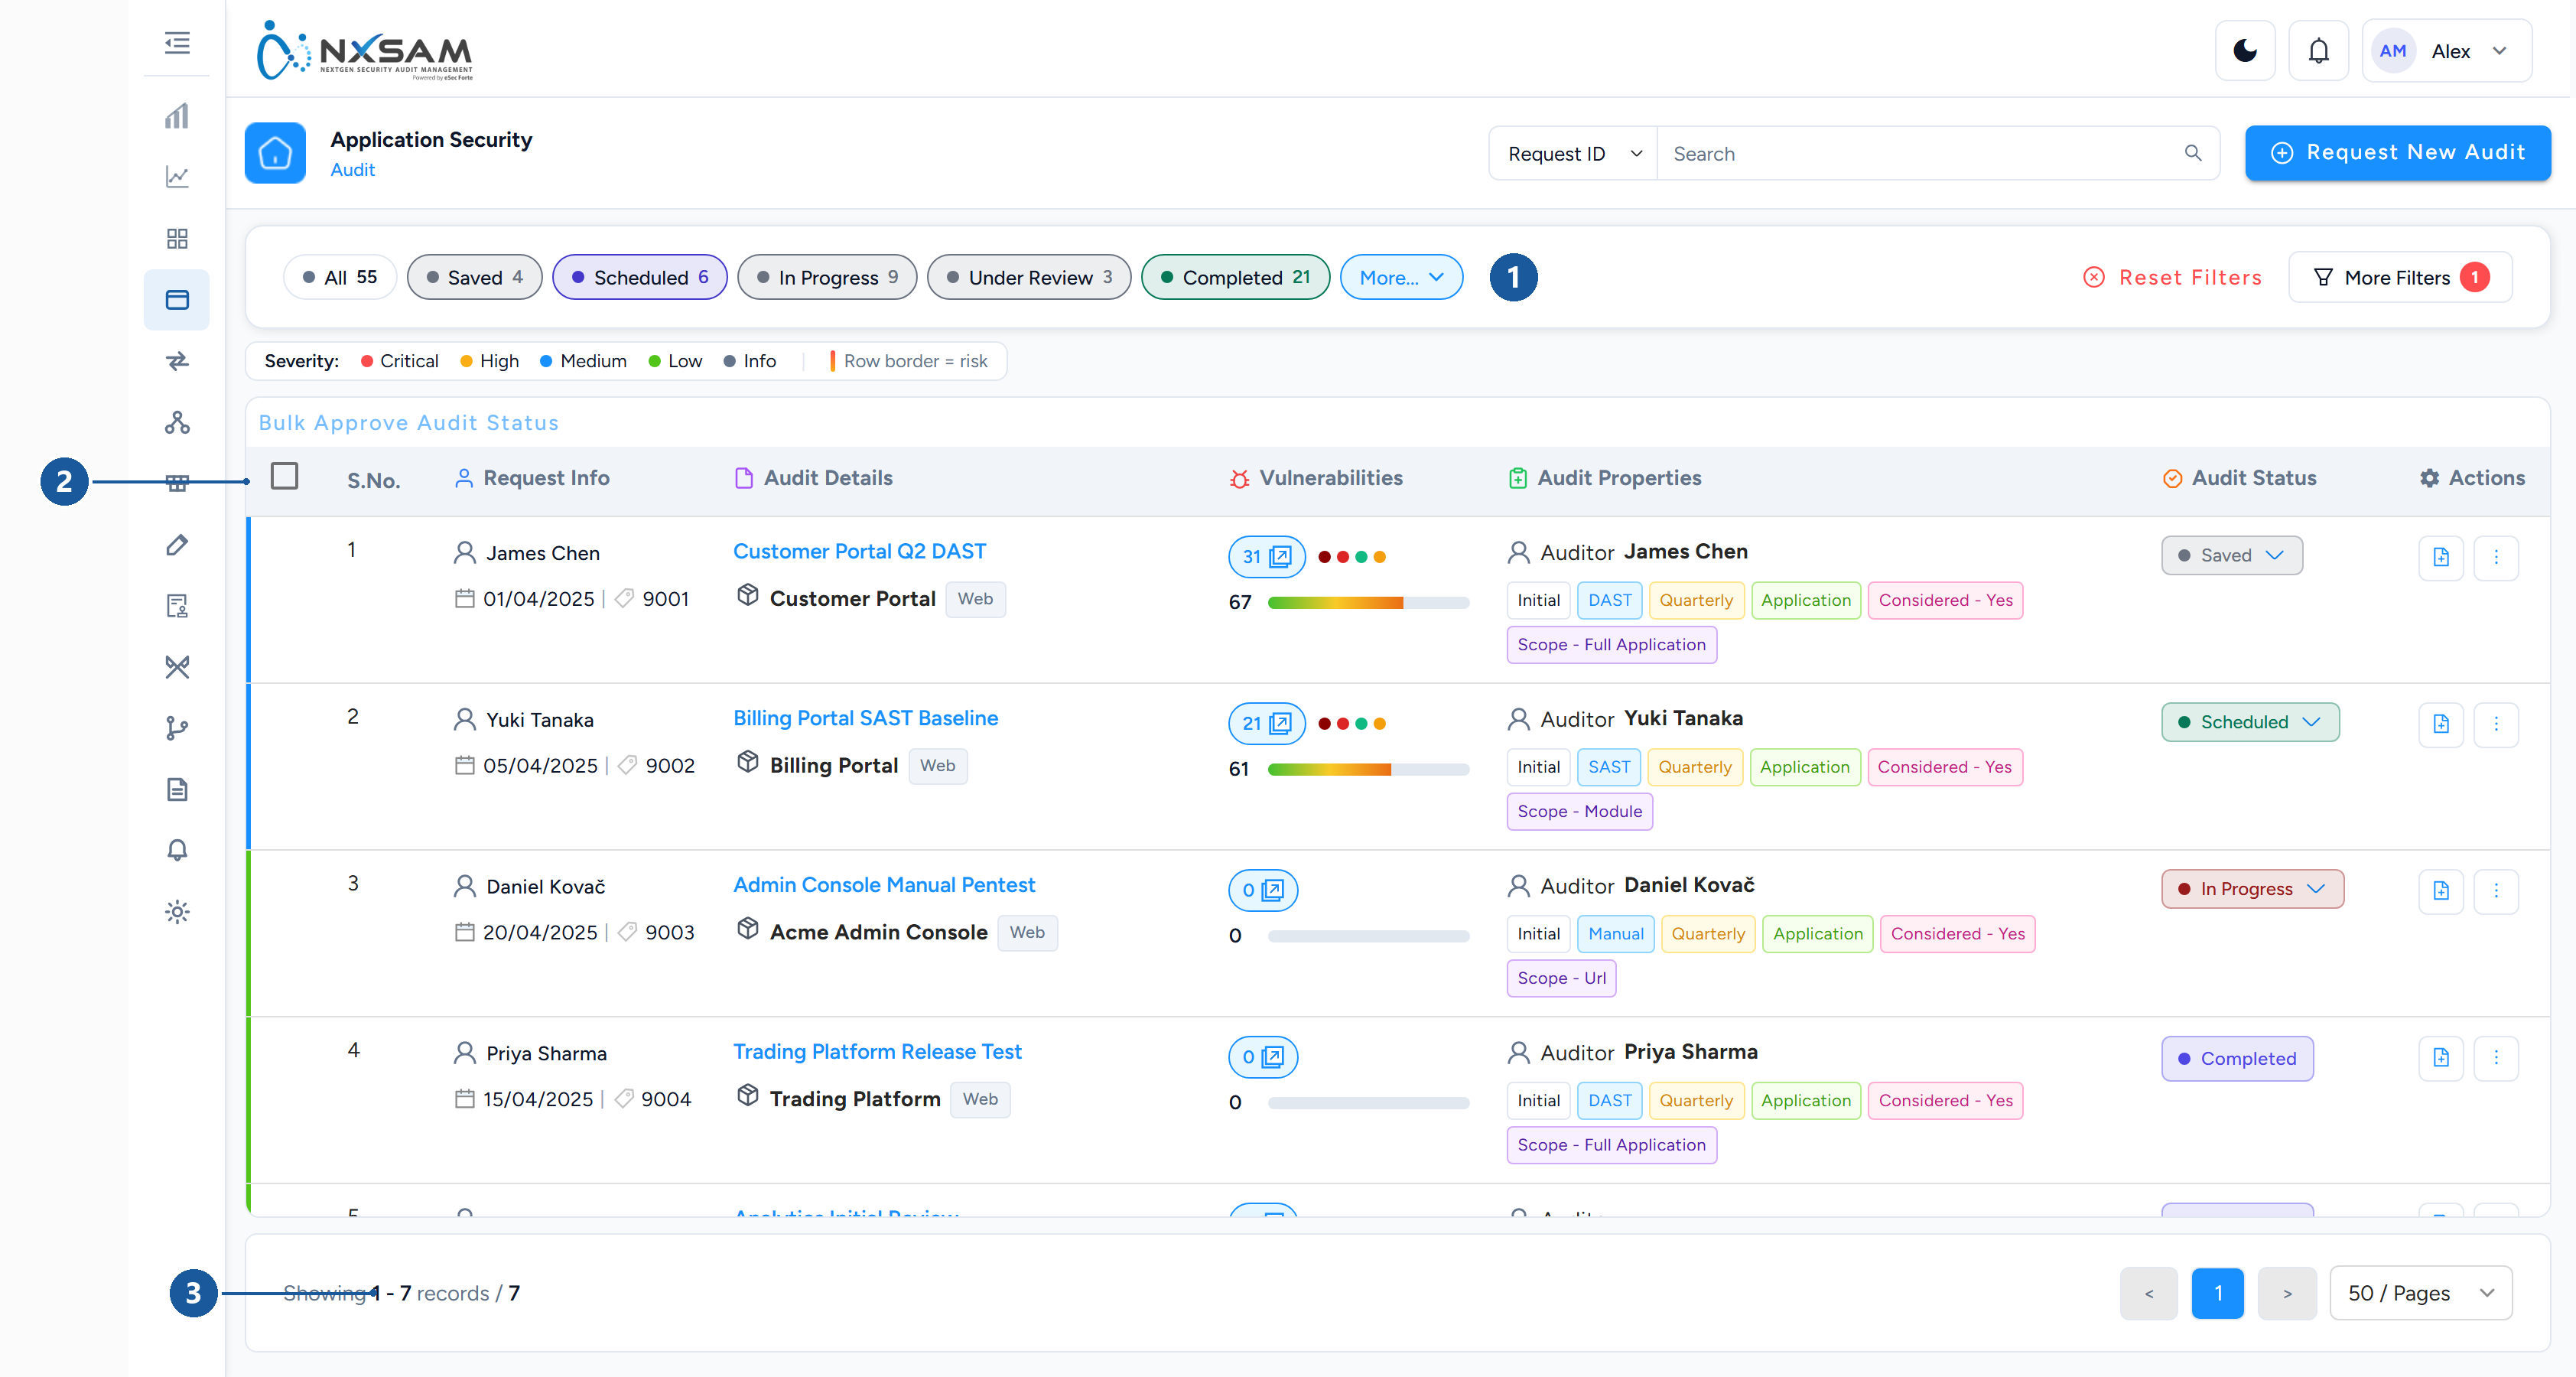
1 status filter chips · 2 what each audit records · 3 page size
The status chips above the table
All, Saved, Scheduled, In Progress, Under Review, Completed, and more behind
More…. Each carries a count, and the counts are of all audits matching your other
filters — not of the page you are looking at.
Clicking one filters the list. All clears the status filter but leaves the other filters
in place, which is why the count sometimes does not match what you expect: Reset Filters
is what clears everything.
The severity legend and the row border
Severity: Critical · High · Medium · Low · Info followed by Row border = risk.
The coloured bar down the left edge of each row is the audit's highest open severity. It is the fastest way to scan the list — a red edge means at least one Critical is open in that audit, regardless of what the counts column shows.
Request Info
Who requested the audit, the date, and the request ID. The ID is what to quote in a support ticket: it identifies the audit unambiguously where names repeat.
Audit Details
The audit name, then the asset it runs against with its type badge (Web, Mobile,
Thick Client, API). One application can have many audits; the audit name is what
distinguishes them, so a naming convention pays off here.
Vulnerabilities
Three separate things in one column:
| Element | Meaning |
|---|---|
| Count badge | Open findings in this audit. The arrow opens the finding list |
| Coloured dots | Which severities are present — one dot per severity that has at least one open finding |
| Number and bar | The audit's risk score, 0–100, coloured along a green-to-red ramp |
The dots answer "how bad", the number answers "how bad overall". An audit with 31 findings and a score of 67 has more, milder findings than one with 8 findings and a score of 90.
Audit Properties
The chips that generate the most questions. Each is a separate property:
| Chip | What it means |
|---|---|
| Initial / Confirmatory | Whether this is the first assessment or a re-test verifying earlier fixes |
| DAST / SAST / Manual | The kind of testing — dynamic, static, or hand-performed |
| Quarterly / Annual / … | The audit cycle it belongs to |
| Application / Module / URL | The bifurcation: whether the app was assessed whole or split into parts |
| Considered — Yes/No | Whether this audit counts towards aggregate figures |
| Scope — … | What was in scope for this particular run |
Considered is the one that surprises people
An audit marked Considered — No is fully visible here, with all its findings, and is excluded from dashboards, posture counts and reports.
That is deliberate: a superseded audit, a trial run, or an assessment of a decommissioned environment should not move the organisation's numbers. But it means "the dashboard does not match the audit list" is expected behaviour for those audits, not a defect.
Only an audit in a final state can be considered, and the date it reached that state is what aggregate views use as its date.
Audit Status
A dropdown, not a label — the status can be changed from here where your role permits it. Which statuses you can move to depends on the current one: the list offers only the legal next steps, so an option missing from the dropdown means that transition is not allowed from where the audit currently is, not that it is broken.
Some transitions require a comment; the product will ask.
Actions
The per-row menu. What appears depends on the audit's status and your permissions, which is why two people looking at the same row see different options. Typical entries are managing the audit's scope, assigning an auditor, editing the audit, and downloading its report.
An action that is absent is almost always a permission or a status question rather than a fault — check the audit's state first.
Bulk Approve Audit Status
Acts on the rows selected by the checkboxes. Useful after a large import when many audits need the same status change, and the reason the checkbox column exists.
The vulnerability list
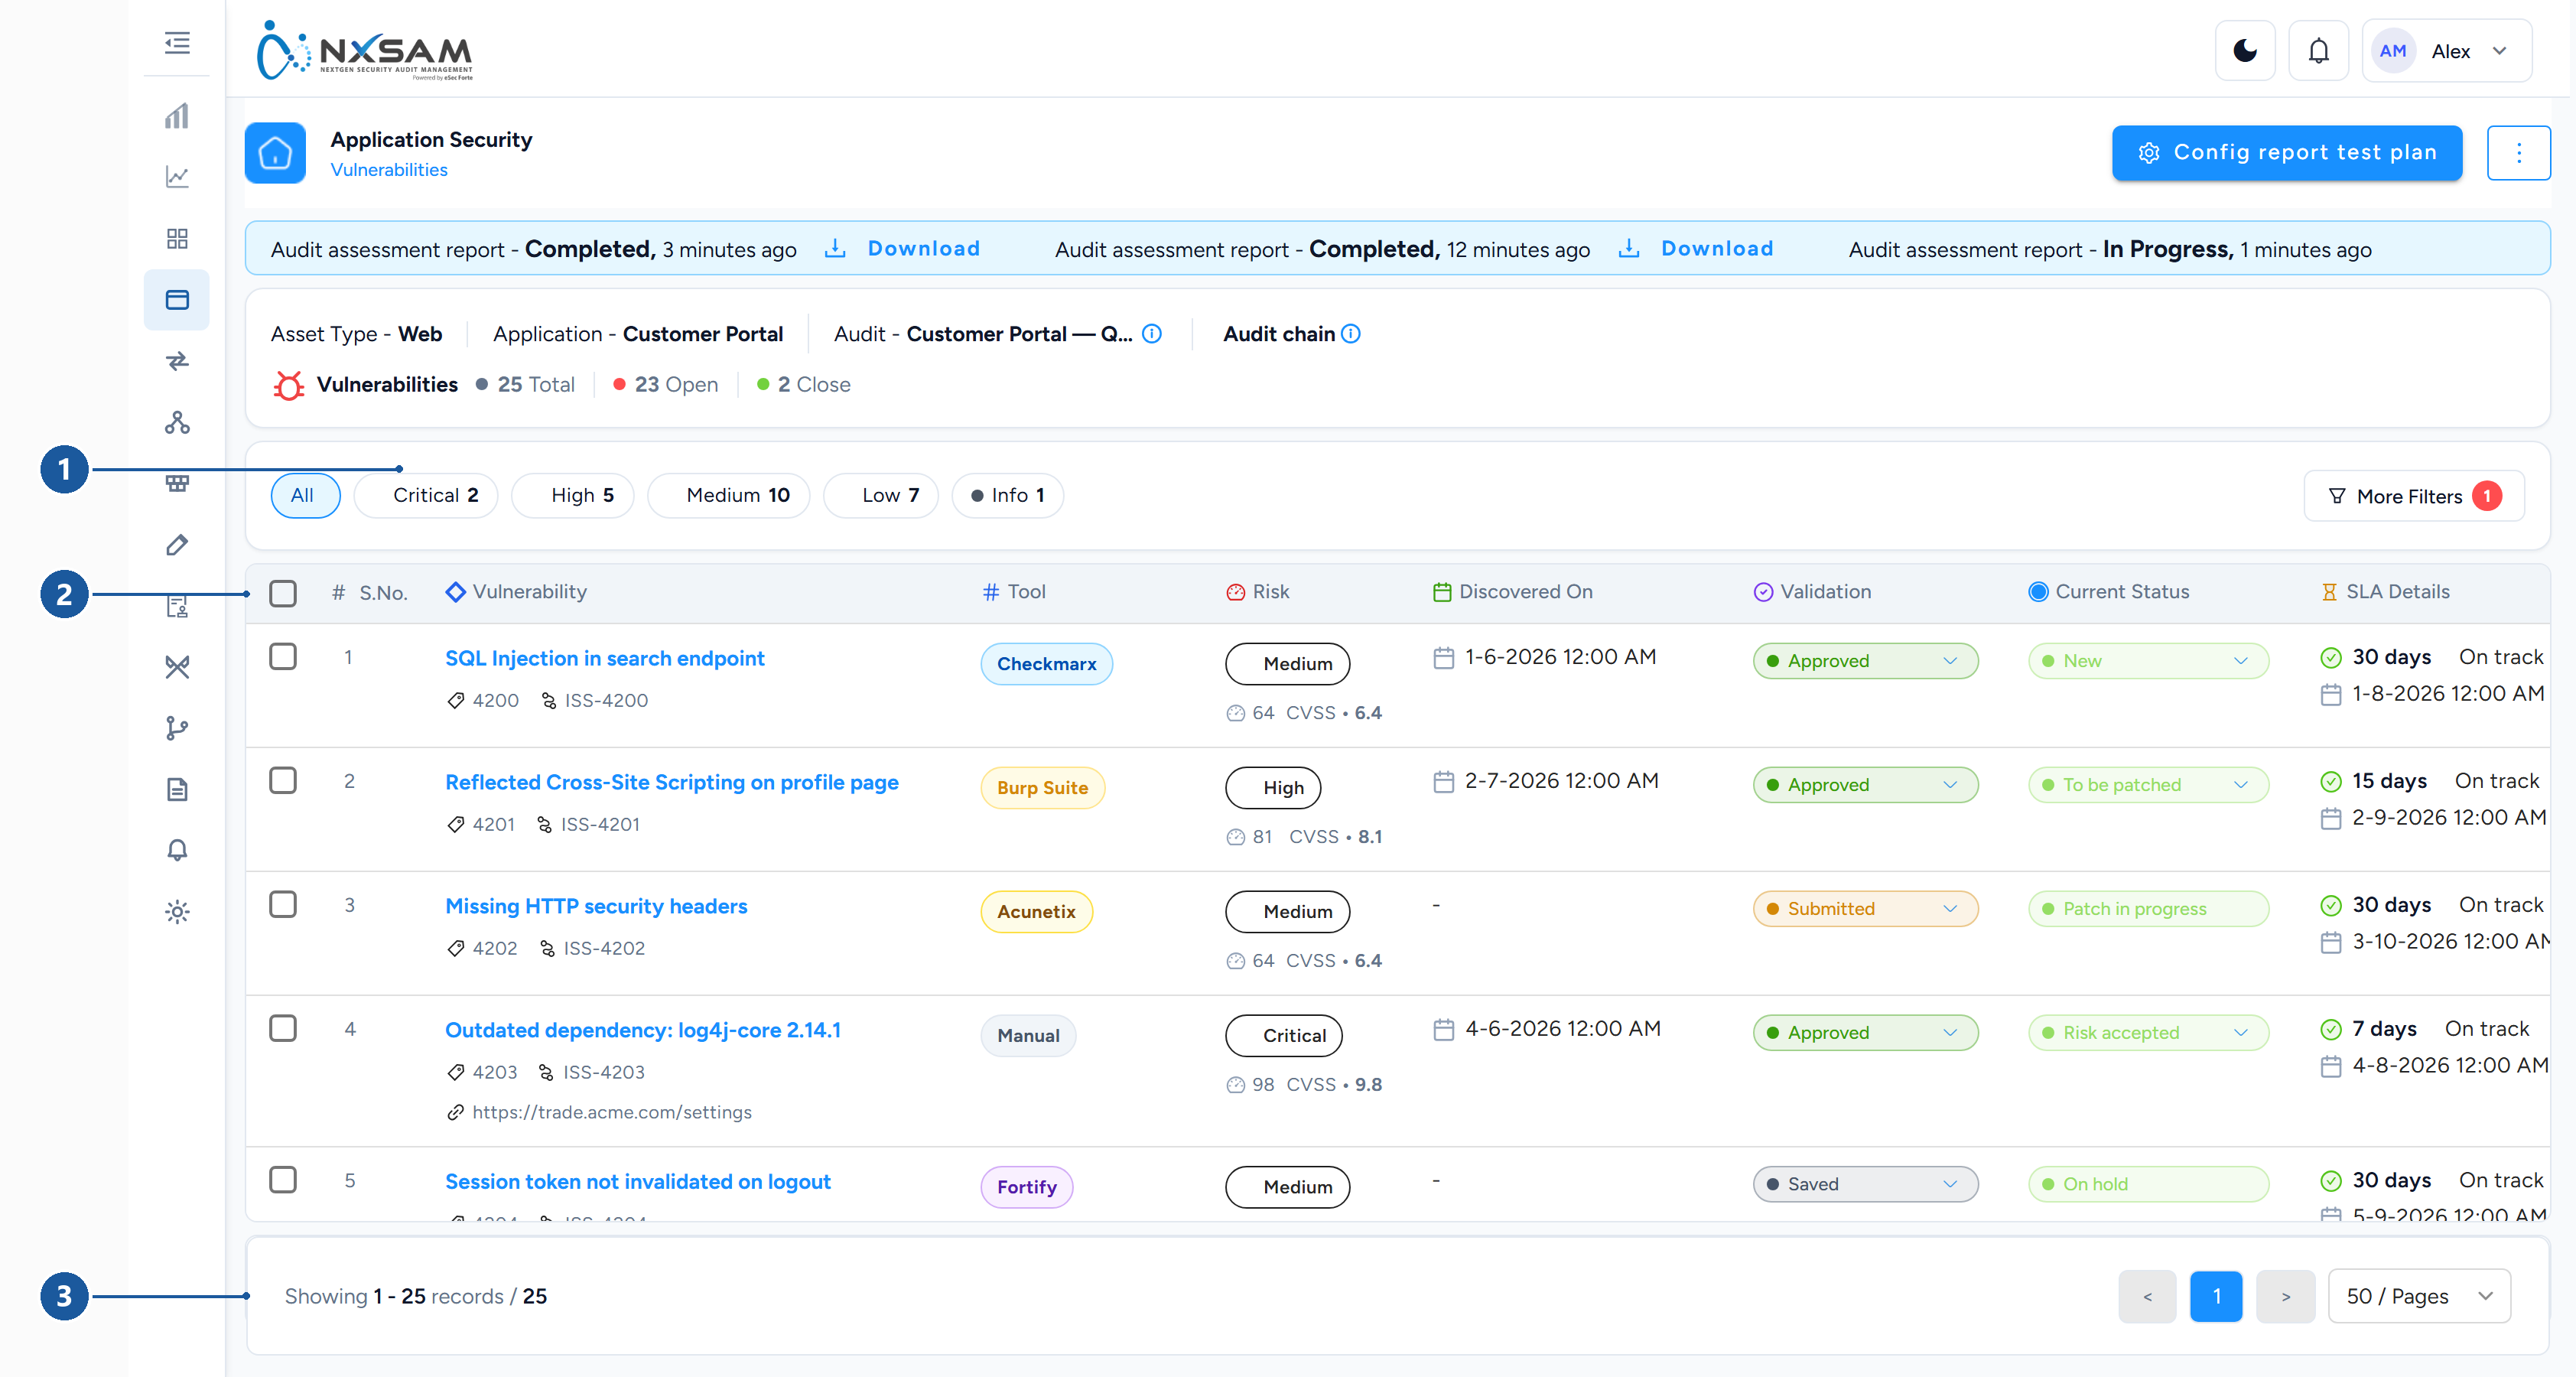
1 filter by severity · 2 finding, asset and status · 3 paging
This is reached by drilling into an audit — the count badge in the Vulnerabilities column above. It always shows findings within a scope, so a finding you expect to see and cannot is often in a different audit rather than missing.
Two status columns, not one
The column people read as "status" is actually two:
- Validation status — is this finding genuine and agreed? There are exactly five:
Saved,Submitted,Approved,Closed,False Positive. - Client status — what is being done about it? Fourteen values:
New,To be patched,Patch in progress,Patched,Not Patched,On hold,Reopen,Validated,Not Applicable,Risk accepted,Risk acceptance,Duplicate,Exception Handled,Expired.
Only Validated and Exception Handled count as closed. Everything else — including
Patched and Risk accepted — is still an open finding as far as every count in the
product is concerned, which is why a list that looks resolved can report every row as
open.
Both are dropdowns offering only the legal next steps. They move independently, and the distinction matters more than anything else on the screen — see the two status fields.
The remaining columns
| Column | Notes |
|---|---|
| Issue / track ID | Quote this in tickets; it survives re-scans |
| Title | The finding, usually with its category and OWASP mapping |
| Severity | Derived from the score, so it changes if the score mapping is edited |
| CVSS / risk score | The raw score, and NxSAM's contextual score |
| Asset | Which application, and the affected URL where the tool reported one |
| Discovered on | Last seen, not first — a re-scan updates it |
| SLA expiry | Read the SLA from here, not by counting days from discovery |
| Tool | Which scanner reported it. The same weakness from two tools should be one finding; if it is two, check the vulnerability master mapping |
Discovered today and overdue at the same time
Not a contradiction. A re-opened finding gets a new discovery date but keeps its original SLA expiry. The expiry column is authoritative.
Discovered On is blank until the finding is approved
The date is gated on validation status. A finding still Saved or Submitted shows
an empty Discovered On cell — visible in the screenshot above on rows 3 and 5, which
are the two rows not yet approved.
This is deliberate rather than missing data: before approval the finding is not counted anywhere, so it has no agreed discovery date to show. It appears the moment the finding is approved, and the SLA clock starts from it.