Analytics Dashboard
The Analytics Dashboard is the cross-module view of your security posture. Where each security module shows you its own findings, this shows everything at once — and lets you slice it.
The two halves
| Dashboard | Charts and figures. Built for understanding the shape of your posture. |
| Live Data | The underlying records as a table, filterable and exportable. Built for working with specifics. |
They share the same filters, so a shape you notice in a chart can be taken straight through to the rows behind it.
Reading the dashboard
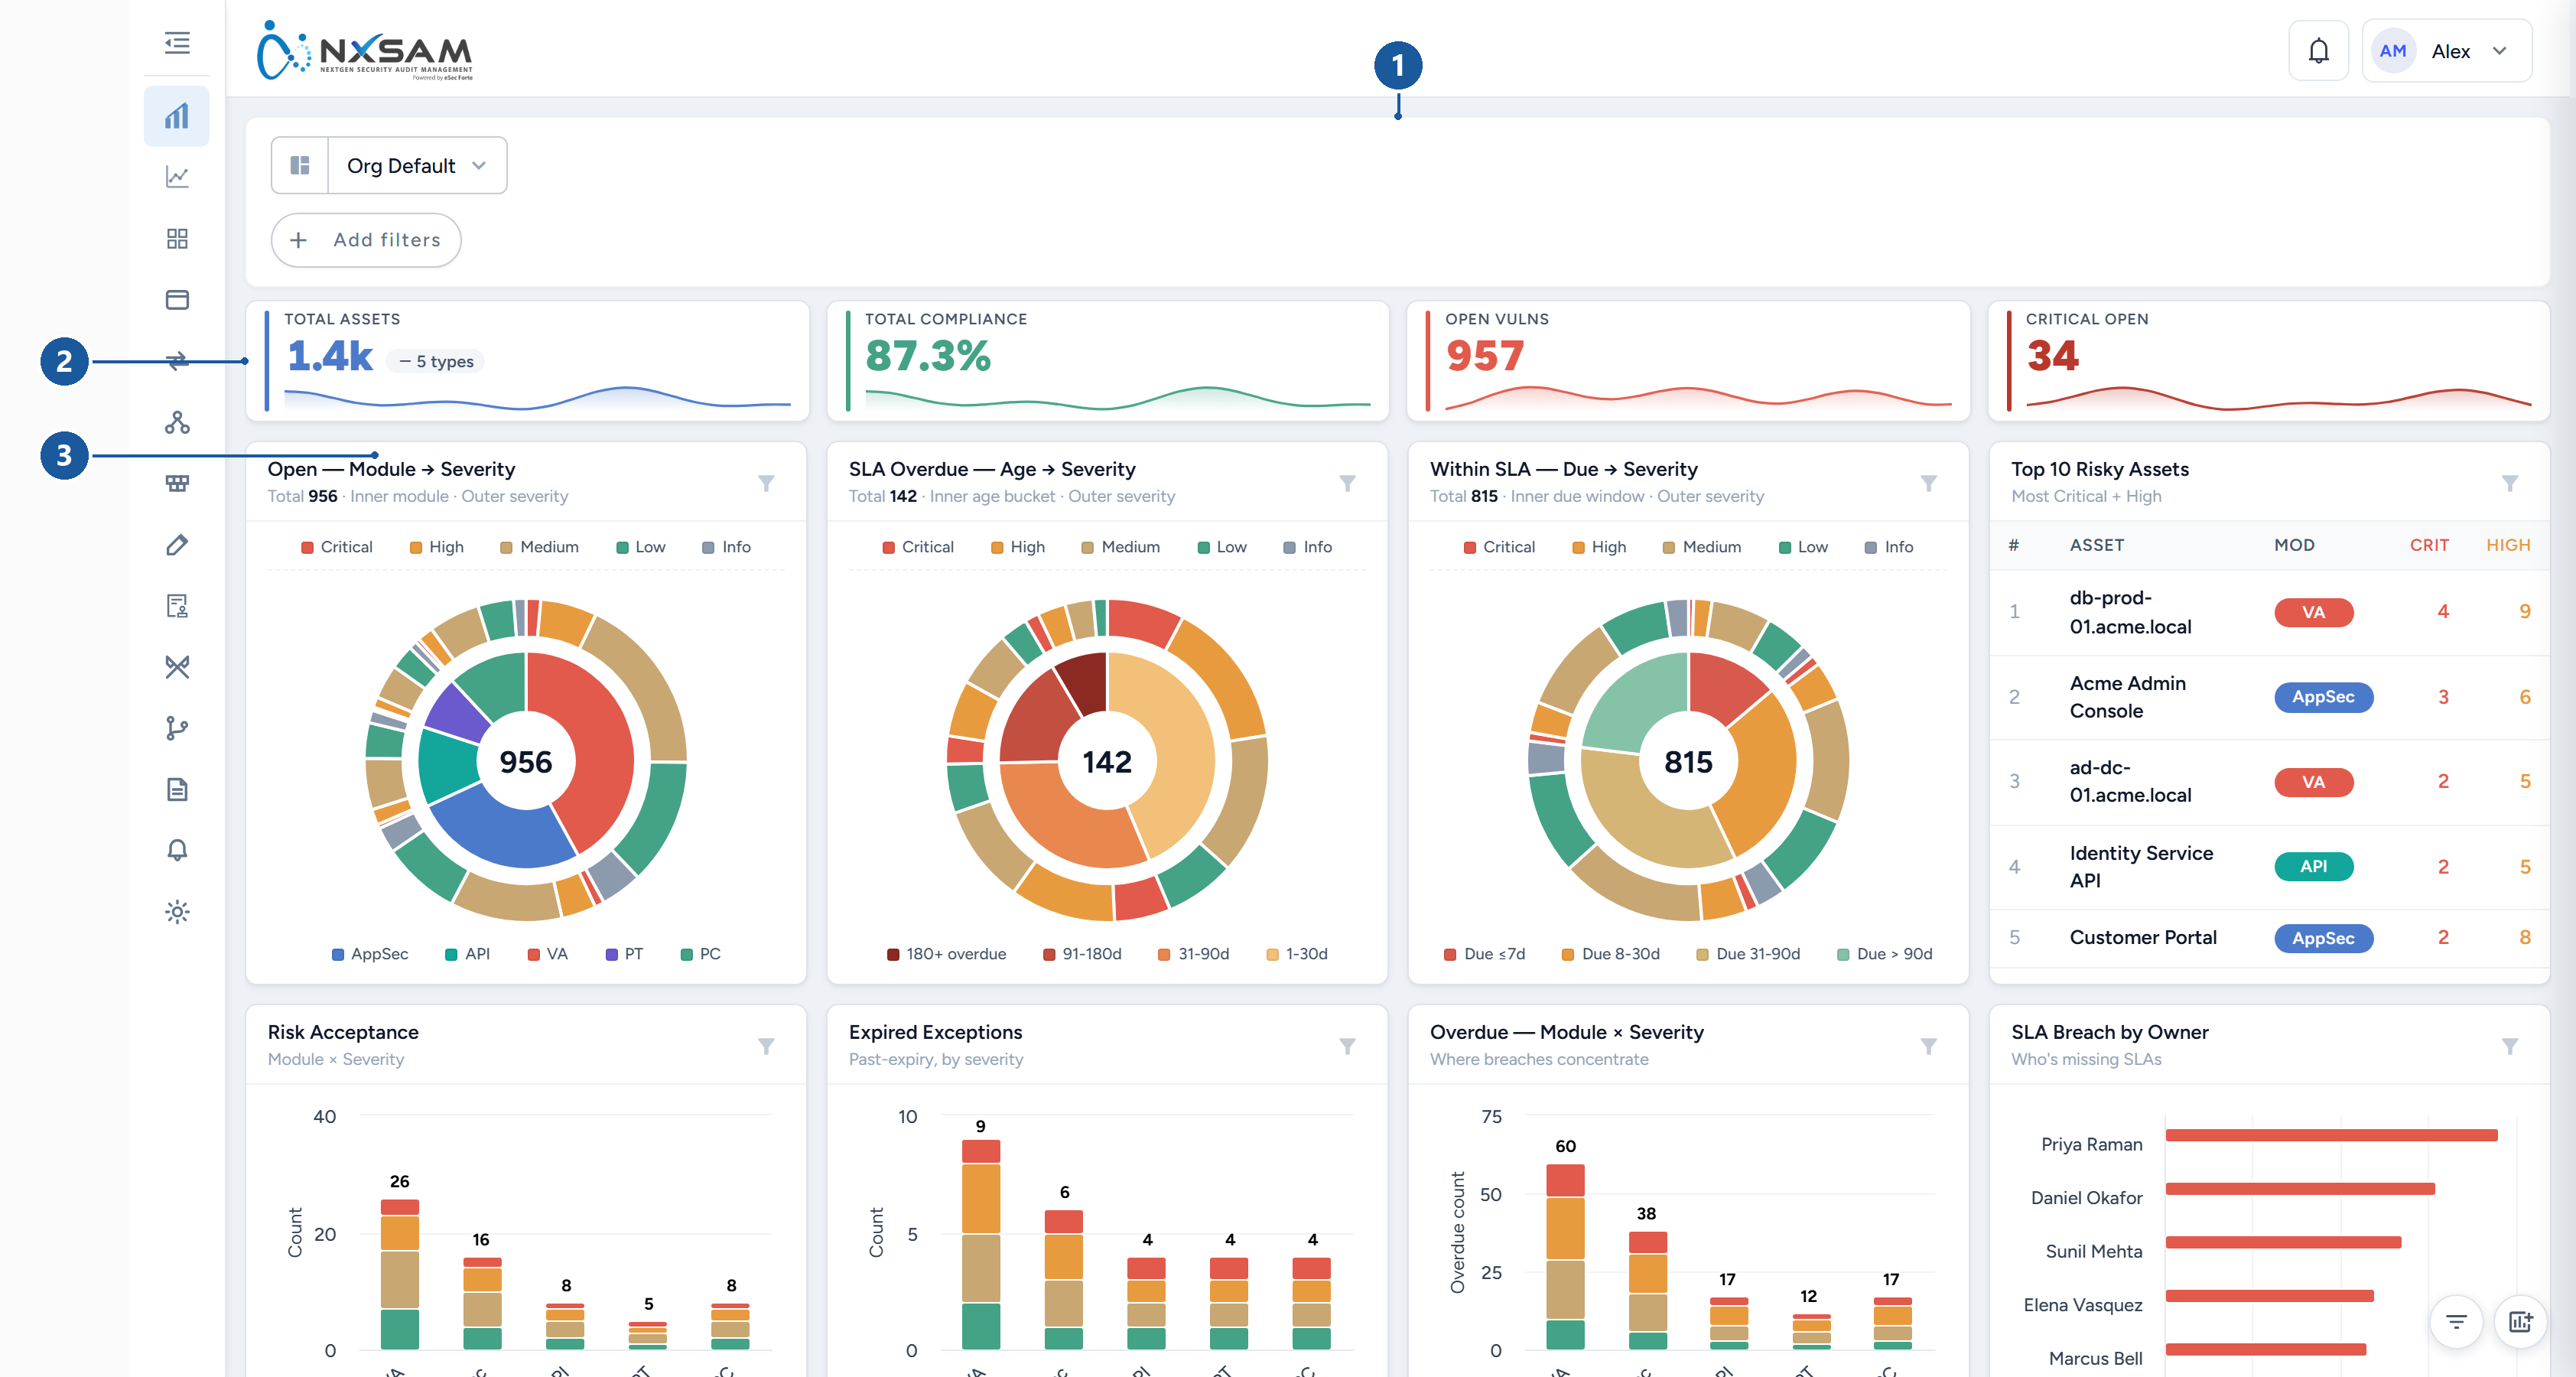
1 global filters · 2 headline figures · 3 one widget, with its own filter
The top row carries headline figures — total assets, open vulnerabilities, critical open, overall compliance. These are the numbers to quote.
Below them, widgets break the same population down by different dimensions: severity, module, age, SLA state, trend over time. Each widget answers a different question:
- Severity breakdowns — how bad is what we have?
- Age and SLA widgets — how long have we had it, and are we late?
- Trend widgets — are we getting better or worse?
- Top-N widgets — where should attention go first?
A dashboard figure and a module count can differ legitimately
The dashboard applies its own filters and counting rules. Before treating a discrepancy as an error, check the filters at the top — a pinned filter from an earlier session is the usual explanation.
Filtering
Filters sit along the top and apply to everything below. They combine, so narrowing by module and severity together shows only findings matching both.
Filters can be pinned, which keeps them applied. This is convenient and also the most common cause of "the numbers look wrong" — a pinned filter persists and is easy to forget. If a figure looks unexpectedly small, check the filter bar first.
Customising the layout
Almost nothing on this dashboard is fixed. You can rearrange and resize widgets, hide the ones you do not use, build charts the product does not supply, exclude severities across every widget at once, and save the result as a named profile to reuse or share.
Layouts are personal: changing yours does not change what anyone else sees, so two people comparing "the dashboard" may be looking at different arrangements of the same data — or at different profiles entirely.
Build your own dashboard covers all of it: edit mode and the grid, the widget list, the chart builder's types, metrics and groupings, profiles and sharing, and the settings that apply everywhere.
Live Data
Live Data shows the records behind the charts. It is where to go when you need to know which findings rather than how many.
- Columns can be chosen, so the table shows the fields you care about.
- Findings can be viewed as open, closed, or all.
- The result can be exported.
Large exports are prepared in the background
A large export is not produced instantly. It is queued, prepared, and made available when ready — so a moment's wait on a big export is expected rather than a failure.
When figures move without anyone changing anything
Two legitimate causes, worth knowing before investigating:
- SLA states change as dates pass. Something within SLA yesterday can be overdue today with no edit at all.
- Ageing moves findings between age bands for the same reason.
Both are the calendar, not the data.
Custom charts
Beyond the supplied widgets you can build your own, and each custom chart card carries three actions:
| Action | What it does |
|---|---|
| Edit | Change what the chart measures and how it is drawn |
| Refresh | Re-runs that chart's query alone |
| Delete | Removes the chart from the dashboard |
Refresh is the useful diagnostic. If one chart looks stale while the rest of the dashboard is current, refreshing it separates a problem with that chart's own query from a problem with the warehouse sync feeding everything.